Abstract
Background and Aims Biological soil crusts, comprising assemblages of cyanobacteria, fungi, lichens and mosses, are common in dryland areas and are important elements in these ecosystems. Increasing N deposition has led to great changes in community structure and function in desert ecosystems worldwide. However, it is unclear how moss crusts respond to increased atmospheric N deposition, especially in terms of growth and physiological parameters. The aim of this study was to understand how Syntrichia caninervis, a dominant species in moss crusts in many northern hemisphere desert ecosystems, responds to added N.
Methods The population and shoot growth, and physiological responses of S. caninervis to six different doses of simulated N deposition (0, 0·3, 0·5, 1·0, 1·5 and 3·0 g N m–2 year–1) were studied over a 3 year period.
Key Results Low amounts of added N increased shoot length and leaf size, whereas high doses reduced almost all growth parameters. Moss shoot density increased, but population biomass decreased with high N. Low N augmented chlorophyll b, total chlorophyll content and soluble protein concentrations, but not chlorophyll a or chlorophyll fluorescence. High N was detrimental to all these indices. Soluble sugar concentration declined with increased N, but proline concentration was not affected significantly. Antioxidant enzyme activities generally decreased with low N additions and increased with high doses of simulated N deposition.
Conclusions Low amounts of added N (0–0·5 g N m–2 year–1) may enhance moss growth and vitality, while higher amounts have detrimental effects.
Keywords: Antioxidant enzyme, chlorophyll, fluorescence, nitrogen deposition, osmotic substance, Syntrichia caninervis
INTRODUCTION
Biological soil crusts (BSCs), complex communities of cyanobacteria, fungi, lichens and mosses, are a major component of the soil surface in arid areas (Evans and Johansen, 1999). In some arid lands, BSC cover may exceed 70 % of the land surface (Belnap, 1995). BSCs may affect important ecological processes in desert ecosystems, such as sand surface stability (Eldridge and Greene, 1994; Hu et al., 2002; Zhang et al., 2006), the hydrological cycle, plant growth and community structure (Evans and Johansen, 1999; Belnap, 2006; Liu et al., 2006; Li et al., 2011), and nitrogen (N) sources (Belnap, 2002; Zaady, 2005; Stewart et al., 2011).
Moss crusts generally develop at advanced stages of crust succession and often form a mosaic in lichen or cyanobacterial crusts (Lan et al., 2012). Mosses are important floristic constituents of many dryland ecosystems and play an important role in the carbon balance of BSCs (Coe et al., 2012b). Being poikilohydric, mosses maintain the moisture content of their cells at equilibrium with the surrounding atmosphere. Mosses also exhibit several morphological and structural adaptations to dry environmental conditions throughout their life cycles (Zheng et al., 2011) and have the potential to resume photosynthesis rapidly after wetting, even in low temperatures and in low light (Proctor and Smirnoff, 2000; J. Zhang et al., 2011), and thus can survive extremely hot summers, bitterly cold winters and severe, protracted drought (Stark et al., 2012).
Because mosses acquire most of their nutrients from the atmosphere, they are extremely useful as bioindicators (Ochoa-Hueso and Manrique, 2013; Ochoa-Hueso et al., 2014) and should be included in studies of the impacts of environmental changes. There are already strong indications that rapid climate changes and anthropogenic disturbance greatly influence moss crusts (Belnap and Eldridge, 2003). For example, changes in timing, seasonality, frequency and intensity of rainfall events have been shown to alter the above-ground biomass and surface cover of the dominant moss Syntrichia caninervis (Coe et al., 2012b; Kidron et al., 2012; Reed et al., 2012) and, when grown in elevated CO2, biocrust mosses showed a decreased chlorophyll content and increased carbon uptake, but N content and photosynthetic performance remained unchanged (Coe et al., 2012a).
Aside from elevated CO2, increasing N deposition because of greater emission of N gas and particulates from continuously encroaching agricultural and industrial developments (Vitousek et al., 1997; Fenn et al., 2003; Bobbink et al., 2010) is also posing major threats to desert ecosystems. Since N is limited in desert soils, any increase in N deposition has the potential to modify plant growth and associated community structure greatly (Throop, 2005; Clark and Tilman, 2008). BSCs have already suffered negative impacts (Belnap et al., 2008; Ochoa-Hueso et al., 2014) including the invasion of annual exotic grass speciess (Belnap et al., 2006). Previous studies of the effects of added N on mosses have mainly focused on forest ecosystems where the responses of mosses to N addition vary among species, study sites and N concentrations (Jones et al., 2002; Pearce et al., 2003). In glasshouse trials modelling semi-arid Mediterranean ecosystems, addition of N, irrespective of quantity, resulted in increased moss cover, whereas under field conditions, N deposition affected moss physiology but not the extent of cover (Ochoa-Hueso and Manrique, 2013). The few comparable studies carried out to date on desert moss crusts indicate that low amounts of added N promote shoot burning (chlorosis) and negatively affect regeneration responses, whereas high amounts may be toxic (Soares and Pearson, 1997; Pearce et al., 2003) and inhibit the resumption of apical meristematic growth after desiccation (Stark et al., 2011). We therefore undertook a detailed 3 year study of the effects of added N on a range of growth (population density, biomass and leaf dimensions) and physiological parameters (concentrations of osmotic adjustment substances, and antioxidant enzyme activities) using S. caninervis, a widespread and often dominant moss species in arid northern hemisphere ecosystems.
The objectives were to (1) evaluate the growth and physiological characteristics of S. caninervis under different doses of added N and (2) test if there is a critical N concentration for optimal moss growth. Given the limitation of N in desert ecosystems, we hypothesized that (a) growth- and photosynthesis-related physiological activity of S. caninervis would be stimulated by the addition of small amounts of N, but would be suppressed by higher N concentrations (Pearce et al., 2003); and (b) the concentration of osmotic adjustment substances and antioxidant enzyme would show opposite trends to growth because more resources would be allocated to synthesis and maintenance of defensive compounds (Bazzaz et al., 1987).
Our study site was the Gurbantunggut Desert, the second largest desert in China, which, in recent years, has been experiencing increased N deposition (Jia et al., 2014). In desert areas close to the city of Urumqi, the rate of dry N deposition may reach 2·9 g N m−2 year−1 (Zhang et al., 2011), which has had significant effects on biomass and regeneration of moss crusts in other desert and semi-arid areas (Stark et al., 2011; Ochoa-Hueso and Manrique, 2013). However, this provides little or no clue as to how lower rates of N deposition, <1 g N m–2 year–1, further away from the city (Li et al., 2012) might affect the moss.
MATERIALS AND METHODS
Study site
The study site (44·62'N, 88·26'E, 570 m a.s.l.) is located in the centre of the Gurbantunggut Desert, north-western China. The desert has a mean annual temperature of 8 °C and mean annual precipitation of 70–150 mm, of which half (47·6 %) falls between April and July. In winter, about 20 cm of snow covers the sand surface. In spring, the melting snow together with increasing rainfall leads to abundant soil moisture which is favourable for the emergence of many annual plant species: Erodium oxyrrhynchum Bieb., Ceratocarpus arenarius L., Haloxylon ammodendron (C. A. Mey) Bunge ex Fenzl and H. persicum Bunge ex Boiss. & Buhse are the dominant desert shrubs. The desert is characterized by massive fixed and semi-fixed sand dunes, with roughly 40 % coverage by different types of BSCs, distributed from the dune crest to the inter-dune area (Zhang et al., 2010). The peak BSC growing period is in the cooler and wetter months of the year, when dew, fog and rainfall events are more frequent. Syntrichia caninervis is the dominant moss species in desert BSCs.
Field methods
In October 2010, ten replicated blocks, each consisting of six 2 × 2 m plots (2 m intervals), were set out at the study site. All plots were located in flat inter-dune areas, with well-developed lichen and moss BSCs. Vascular plant composition and density, and soil physiochemical characteristics were similar in all plots.
Five N addition treatments and a control (no added N) were randomly applied to the six plots of each block. The six treatments, each with ten replicates, were 0, 0·3, 0·5, 1·0, 1·5 and 3·0 g N m–2 year–1, henceforth designated N0, N0·3, N0·5, N1, N1·5 and N3, respectively. The N addition rates were within the range of natural N deposition rates at sites near the desert margin. The treatments were applied in equal amounts in October before snowfall and in March after snow thaw from October 2010 to October 2013. We selected these times because field cultivation and fertilizer application in farmland near the desert peak in March and October, with the strong likelihood of increased N emission and deposition onto desert soils. Each N application consisted of 2:1 NH4:NO3 (NH4NO3 and NH4Cl), which approximates the composition of N deposition recorded for nearby oases (Zhang et al., 2008), thus reproducing the impact of N deposition from nearby oases to desert ecosystems.
The N for each plot was dissolved in 10 L of water and sprayed evenly across the surface. In March, at the time of N application, the plots were moist from snow melt. In October, the N additions were applied either after small rainfall events or in the early morning when BSCs were wet with dew, in order to avoid additional stress (rapid desiccation) by the N application to the surface of the moss BSCs.
Fluorescence measurements
Four blocks were randomly selected for the fluorescence measurements and subsequent sample collection. In March 2014, at 2 d after the end of snow melt when the moss shoots were hydrated, and 1 d before the next N application, we selected plots from the four blocks in which to measure chlorophyll fluorescence of S. caninervis in situ using a portable pulse amplitude fluorometer (PAM 2500, Walz, Inc., Effeltrich, Germany). The mosses remained hydrated during the entire period of fluorescence measurement. Actual photochemical efficiency Y(II) of mosses was measured under ambient light. For measurement of maximum quantum yield (Fv/Fm), the saturation pulse method was used. The moss population sample used for Fv/Fm measurements was monitored in the dark in a box covered for >30 min. Fo was obtained on excitation with a weak measuring beam, and maximal fluorescence yield Fm measured following a 0·8 s saturating pulse (15 000 μmol m–2 s–1) to close all reaction centres. The Fv/Fm was calculated as (Fm – Fo)/Fm. Four points of moss crusts were selected in each plot. Y(II) and Fv/Fm at four points were averaged to represent one plot.
Sample collection
After the fluorescence measurements, samples of soil and of S. caninervis were collected from the above four blocks. For soil samples, three cores, each 5 cm in diameter and 0–5 cm deep, were collected from each treatment plot within each of the four blocks and mixed to form one composite sample. The samples were air-dried for physicochemical analysis. Soil pH and electrical conductivity (EC) were measured in a 1:5 mixture of soil and deionized water with pH and EC meters, respectively. Soil organic matter (OM) was determined by the K2Cr2O7 method (Walkley–Black); total N by the CuSO4-Se powder diffusion method; total phosphorus (P) by the NaOH fusion–Mo TeSc colorimetry method; and available N by the alkali hydrolyzation–diffusion method (Chen et al., 2007).
Syntrichia caninervis was collected in PVC tubes (11 cm diameter, 5 cm depth), placed in a portable ice-box and immediately transferred to the laboratory. The contents of some tubes were used to measure morphology and biomass; the other tubes were used to determine physiological characteristics, such as soluble sugar, proline, soluble protein and antioxidant enzyme activity. The photosynthetically active leaves and young stems were promptly removed using a sharp blade, and sand grains were carefully detached using mesh. Leaves and stems were wrapped in aluminium foil, frozen in liquid N, and stored at − 80 °C for physiological analysis.
Moss population density and biomass
A 1 × 1 cm frame was used to select moss samples in the PVC tube for shoot density and biomass measurements. Individual moss plants were separated and washed in a Petri dish to remove sand grains. We use ‘individual’ to refer to one whole shoot, comprising both above- and below-ground components. The number of individuals was recorded. The 1 cm2 moss samples were oven dried at 65 °C to constant weight and the dry biomass recorded to 0·0001 g accuracy.
Individual size and leaf growth characteristics
Biomass accumulation of individuals was calculated based on moss density and population biomass. Twenty individuals from different N treatments were randomly selected for morphological measurements. Individuals were placed in a Petri dish and distilled water added to ensure the plants remained hydrated and alive. The Petri dish was moved to a stereomicroscope to capture images of the shoot length using the same scale. A short needle was used as a reference measure. Shoot length was measured from the apex of the stem to the starting point of the below-ground section. For measurement of leaf length and width, and hairpoint length, leaves were carefully removed from the same moistened shoots. Each leaf was photographed under a light microscope (×10 objective). All measurements were recorded from the image using Image J software (National Institutes of Health, Bethesda, MD, USA).
Chlorophyll measurement
For chlorophyll determination, 0·15 g of fresh moss shoots were weighed and ground in liquid N and CaCO3 with a mortar and pestle. The pigments were extracted in 95 % (v/v) chilled ethanol in the dark and incubated overnight at 4 °C. The samples were centrifuged (4000 g, 10 min), after which the absorbance of the filtered extract was measured at 665, 649 and 470 nm. The chlorophyll concentration was calculated in accordance with the Lichtenthaler formula on a dry weight basis (Lichtenthaler and Wellburn, 1983).
Measurements of soluble sugar, proline, soluble protein concentrations and antioxidant enzyme activity
Soluble sugar was determined based on the method of Lassouane et al. (2013). Fresh tissue (leaf and stem together, 0·15 g) was ground to a fine powder in liquid N and mixed with 7 mL of 70 % ethanol (v/v) for 5 min on ice. The sample was centrifuged at 8000 g for 10 min at 4 °C. A sub-sample (200 mL) of the extract was mixed with 1 mL of anthrone and heated in a boiling water bath for 10 min. The absorbance was recorded at 625 nm. Glucose was used as the standard to calculate the soluble sugar concentration.
Proline concentration was measured in accordance with the methods of Bates et al. (1973) and Monreal et al. (2007), with some modifications. Specifically, 0·15 g of fresh tissue was ground in 5 mL of 3 % sulphosalicylic acid, and extracted in boiling water for 20 min. After centrifuging, 2 mL of supernatant was mixed with acetic acid and acid ninhydrin, and incubated in an oven at 100 °C for 40 min. The mixture was cooled at ambient temperature, then 5 mL of toluene was added and the absorbance was recorded at 520 nm.
To determine the soluble protein concentration, 0·15 g of fresh tissue was ground in deionized water at 4 °C, then centrifuged at 8000 g for 30 min. A 5 mL aliquot of Coomassie brilliant blue was added to 200 μL of protein extracts. Absorbance of soluble protein was read at 595 nm. Bovine serum albumin was used as the standard (Gonzalez and Pignata, 1994). The above three osmotic adjustment substances were expressed as dry weights.
Peroxidase (POD), superoxide dismutase (SOD) and catalase (CAT) activities were determined using the methods of Choudhury and Panda (2005), Sun et al. (2009) and Wu et al. (2012). Specifically, 9 mL of 0·2 m phosphate buffer (pH 7·0) was added to 0·15 g of ground fresh tissue, under ice-cold conditions. The mixture was centrifuged at 3500 g for 10 min. The supernatant was used for the measurement of POD, SOD and CAT activity. For POD, the H2O2 reaction mixture was added to the supernatant and the absorbance recorded at 420 nm. The SOD activity was calculated after recording the absorbance at 550 nm. One unit of SOD refers to the amount of enzyme that inhibits the reduction of nitroblue tetrazolium by 50 %. The CAT activity was estimated based on disappearance of H2O2, and the absorbance was measured at 405 nm. Activities of POD, SOD and CAT were calculated based on soluble protein.
Statistical analysis
The average moss density, size, leaf length and width, and hairpoint length were calculated for each plot. We employed a one-way analysis of variance (ANOVA) to assess the significance of differences among treatments, and the least significant difference (LSD) was performed to determine whether differences were statistically significant. All the data were tested for homoscedasticity and normality before analysis. All comparisons were performed using SAS 6.1 software (SAS Institute, Inc., Cary, NC, USA).
RESULTS
Soil physicochemical characteristics
The addition of nitrogen reduced soil pH, with significant decreases recorded for N3 treatments (Table 1, P < 0·05). However, N3 addition significantly increased EC compared with the control (N0). Organic matter, total N and available N were not significantly affected by the N treatments (P > 0·05).
Table 1.
Physicochemical characteristics of the soil in response to different N application rates
| N treatments | pH (1:5 w/v) | EC (μs cm−1) | OM (g kg−1) | Total N (g kg−1) | Total P (g kg−1) | Available N (mg kg−1) |
|---|---|---|---|---|---|---|
| N0 | 7·7 ± 0·1a | 78·67 ± 4·6b | 3·01 ± 0·21a | 0·19 ± 0·01a | 0·35 ± 0a | 16·87 ± 0·91a |
| N0·3 | 7·6 ± 0a | 80·67 ± 4·48ab | 3·13 ± 0·65a | 0·16 ± 0·05a | 0·35 ± 0·02a | 18·85 ± 1·79a |
| N0·5 | 7·6 ± 0·1ab | 79 ± 3·21b | 2·97 ± 0·49a | 0·17 ± 0·04a | 0·34 ± 0·01a | 17·77 ± 2·58a |
| N1 | 7·6 ± 0ab | 82 ± 4·73ab | 2·5 ± 0·27a | 0·19 ± 0·01a | 0·34 ± 0·01a | 14·88 ± 2·42a |
| N1·5 | 7·6 ± 0ab | 93·33 ± 9·35ab | 2·28 ± 0·25a | 0·16 ± 0·04a | 0·35 ± 0·01a | 15·51 ± 2·91a |
| N3 | 7·4 ± 0·1b | 97 ± 5·03a | 2·39 ± 0·14a | 0·16 ± 0·02a | 0·33 ± 0·01a | 18·28 ± 1·7a |
EC, electrical conductivity; OM, organic matter.
Moss population density and biomass accumulation
No significant differences in population density were observed between the controls and treatments with lower quantities of added N (N0·3 and N0·5) (P > 0·05; Fig. 1). Higher quantities of added N (N1–N3) significantly increased the population density (number of shoots per 1 cm2). No significant differences were observed among high N (N1–N3) treatments (P > 0·05). There was no increasing trend in population density corresponding to increased amounts of added N.
Fig. 1.
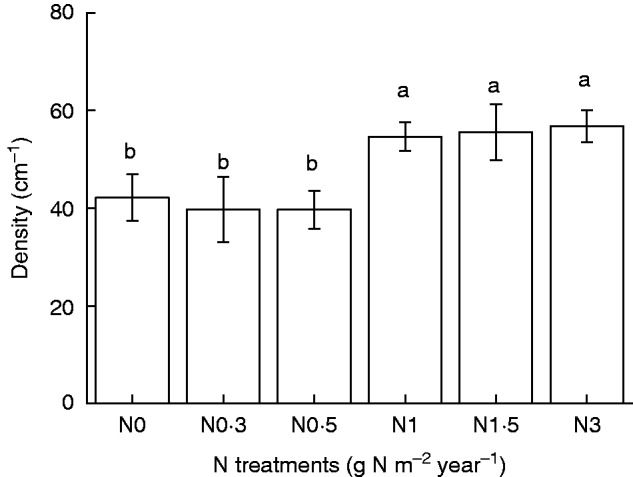
Population density (number of individuals per 1 cm2) of Syntrichia caninervis in response to different levels of N addition (mean ± s.e., n = 4). Different letters above a bar indicate a significant difference (P < 0·05).
In contrast, accumulation of population total biomass showed a gradually decreasing tendency as the rate of N addition increased from N0·3 to N1·5, though differences were not significant among N0–N1·5 treatments (P > 0·05; Fig. 2). However, population biomass decreased significantly at the highest N addition treatment (N3; P < 0·05).
Fig. 2.
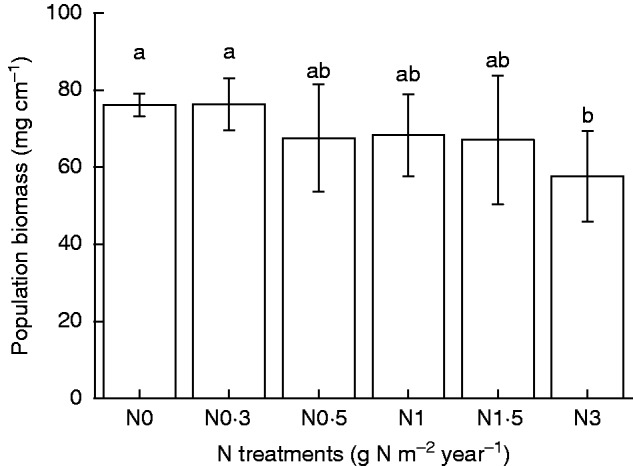
Dry biomass accumulation by 1 cm2 Syntrichia caninervis populations in response to different levels of N addition (mean ± s.e., n = 4). Different letters above a bar indicate a significant difference (P < 0·05).
Growth response of individual plants to N addition
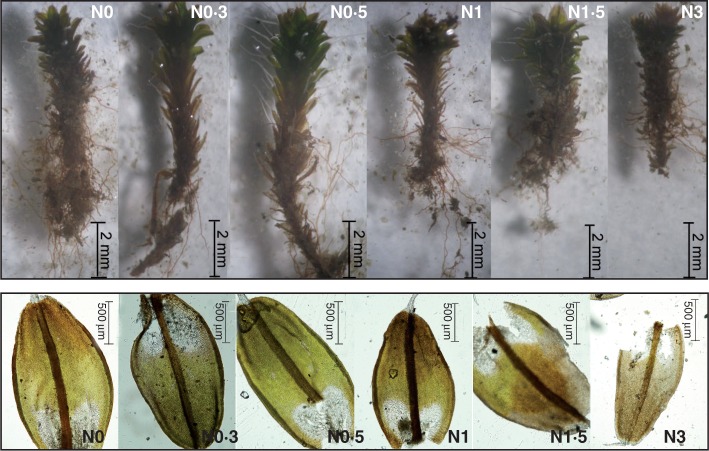
Figure 3 shows the differences in growth characteristics of individual plants and leaf dimensions under different N treatments. Added N significantly influenced individual plant biomass, shoot lengths and leaf dimensions (Fig. 4A–C; P < 0·05). Individual plant biomass was highest in the N0·3 treatment and then decreased gradually with increasing amounts of N (Fig. 4A).
Fig. 3.
Representative shoots (upper images) and leaves (lower images) of Syntrichia caninervis from the N addition treatments illustrate the different shoot lengths and leaf length.
Fig. 4.
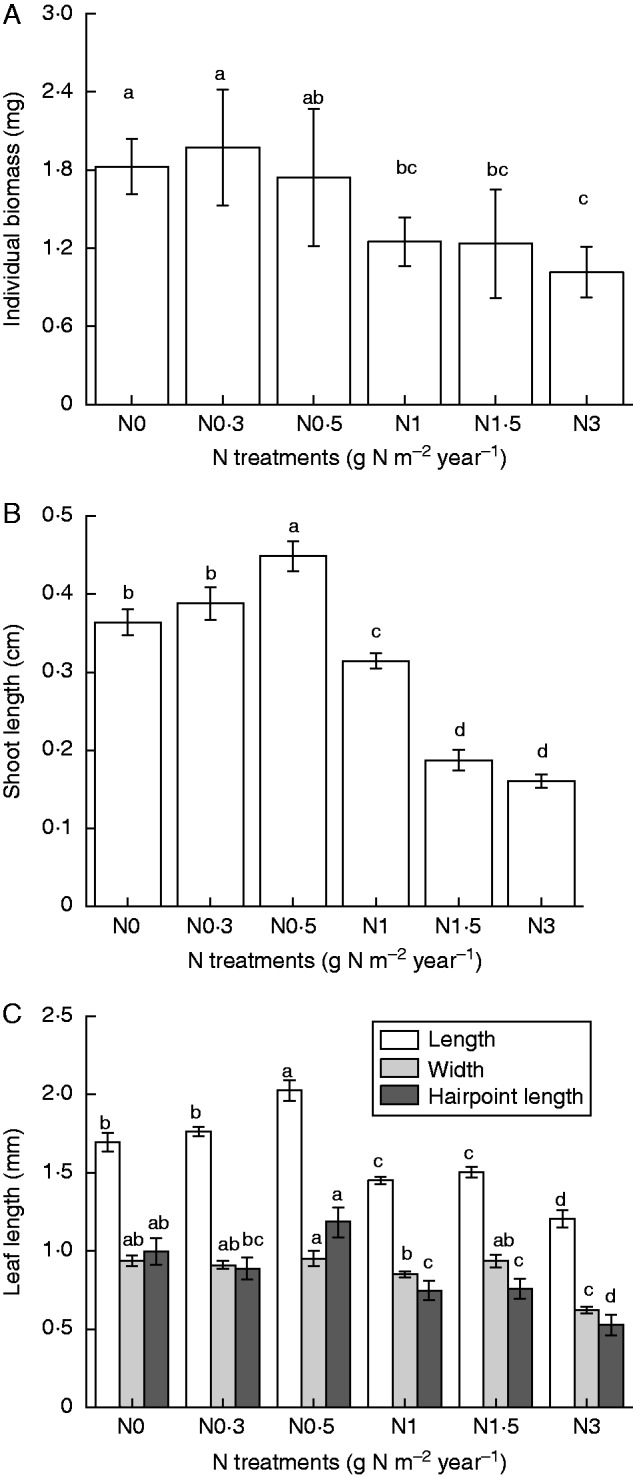
(A) Individual plant biomass (mean ± s.e., n = 4); (B) shoot length (mean ± s.e., n = 20); (C) leaf length, leaf width and hairpoint length (mean ± s.e., n = 15) of Syntrichia caninervis in response to different levels of N addition. Different letters above a bar indicate a significant difference (P < 0·05).
The highest amounts of added N (N1 –N3) reduced individual biomass and shoot lengths (Fig. 4A, B). Low amounts of N addition (N0·3–N0·5) positively affected leaf length and width, and hairpoint length (Fig. 4C). The highest rate of N addition (N3), however, reduced these leaf dimension parameters. The results demonstrated that high rates of N addition negatively impacted on the growth of S. caninervis.
Chlorophyll fluorescence parameters
Chlorophyll concentration increased at low amounts of added N (N0·3) then gradually decreased with increasing N addition (Fig. 5). However, chlorophyll a concentrations were not significantly affected by added N when compared with the control (N0) (P > 0·05). The values of both Y(II) and Fv/Fm showed a gradual downward trends with increasing amounts of added N, although, with the exception of the N3 treatment, the differences were not significant (Fig. 6; P < 0·05).
Fig. 5.
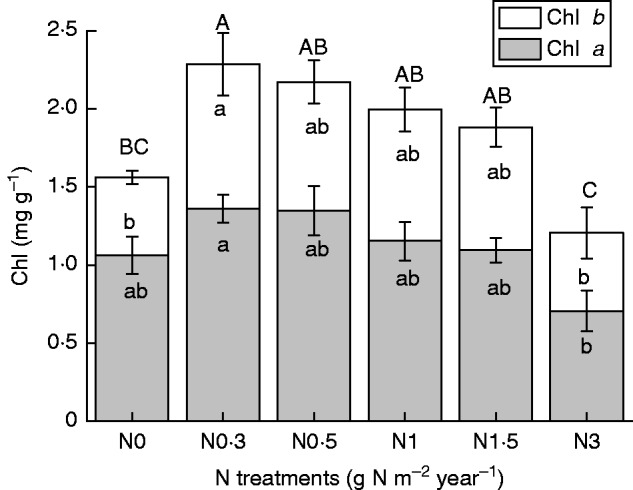
Concentration of chlorophyll a, b and a + b of Syntrichia caninervis in response to different levels of N addition (mean ± s.e., n = 4). Different lower case letters (chlorophyll a and b) and upper case letters (chlorophyll a + b) above a bar indicate a significant difference (P < 0·05).
Fig. 6.
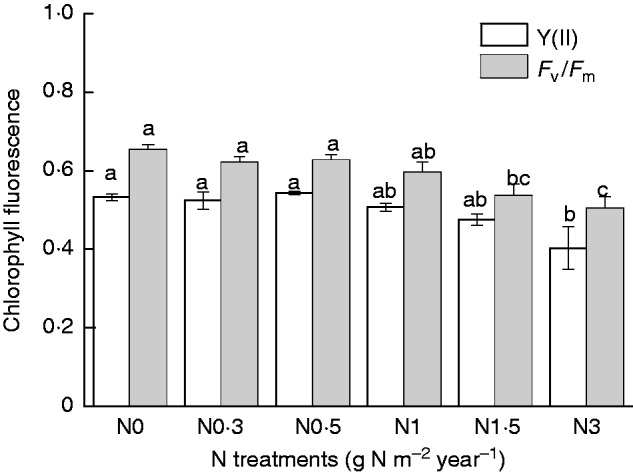
Actual photochemical efficiency [Y(II)] and maximum quantum yield (Fv/Fm) of Syntrichia caninervis in response to different levels of N addition (mean ± s.e., n = 4). Different letters above a bar indicate a significant difference (P < 0·05).
Concentration of osmotic adjustment substances and antioxidant enzyme activities
With an increasing amount of added N, soluble sugar, soluble protein and proline concentrations showed differing trends (Fig. 7). Soluble sugar increased slightly at N0·3 (P > 0·05) but then gradually decreased with increasing amounts of N (P < 0·05). Soluble protein increased from N0·3 to N1 (P > 0·05), then decreased at N1·5 and N3. No changes in proline concentrations were observed (P > 0·05).
Fig. 7.
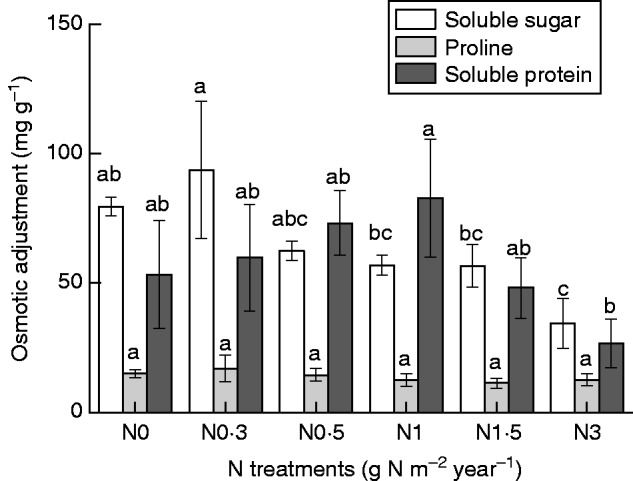
Concentration of osmotic adjustment constituents of Syntrichia caninervis in response to different levels of N addition (mean ± s.e., n = 4). Different letters above a bar indicate a significant difference (P < 0·05).
Similar trends for changes in activities of SOD, POD and CAT were observed with increasing N additions from N0 to N3 (Fig. 8). However, although the mean activity of the three enzymes varied greatly, significant differences were only observed for POD.
Fig. 8.
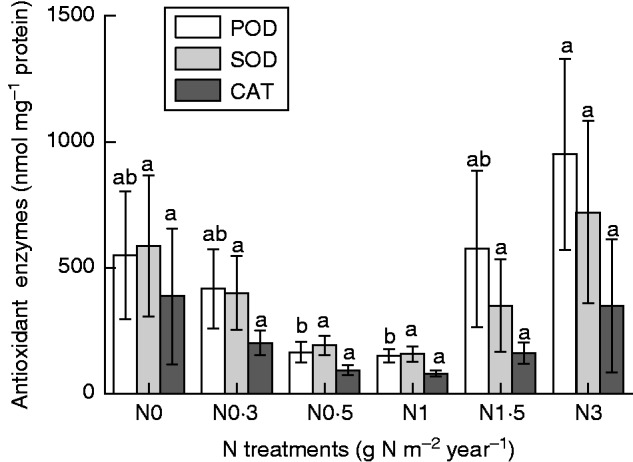
Antioxidant enzymes peroxidase (POD), superoxide dismutase (SOD) and catalase (CAT) of Syntrichia caninervis in response to different levels of N addition (mean ± s.e., n = 4). Different letters above a bar indicate a significant difference (P < 0·05).
DISCUSSION
Non-linear responses of moss growth to N enhancement
Low amounts of added N clearly increased individual plant biomass, shoot size and leaf size in the desert moss Syntrichia caninervis, whereas more added N decreased these parameters. These results are consistent with the initial hypothesis that moss growth is stimulated by low N addition, and suppressed by larger amounts of added N (for example Jones et al., 2002; Jägerbrand et al., 2003; Pearce et al., 2003). Whereas the addition of > 1 g N m–2 year–1 was clearly detrimental to S. canivervis from the Gurbantunggut Desert, the same species from the Mojave Desert in western North America showed no significant shoot biomass differences for various N treatments (0–4 g N m–2 year–1) (Stark et al., 2011). We attribute this difference to the greater number of N application events in the Gurbangunggut Desert each year (twice vs. once), or the differet rainfall patterns in the two desert.
Images of individual moss shoots from N1·5 and N3 plots (Fig. 3) revealed shoot burning (chlorosis) due to the large amounts of added N, resulting in much smaller shoots than the controls. This result also differs from the findings Stark et al. (2011), who recorded significantly higher shoot chlorosis with low amounts of added N (1 g) but not for higher amounts.
The positive benefits of the application of small amounts of added N (0·3–0·5 g N m–2 year–1) observed here in just 3 years suggest that moderate N deposition in N-limited arid areas (Noy-Meir, 1973; Zhou et al., 2011, 2014) might actually facilitate and accelerate growth of moss crusts.
The increase in population density of Syntrichia following high N enhancement partially compensated for the decrease in individual plant size and biomass. Interestingly, the increase in moss abundance recorded here stands in contrast to several previous studies. For example, in the western USA, summer irrigation and N application interacted to mitigate the effects of decreased shoot numbers of S. caninervis (Stark et al., 2011). Increased N deposition in acidic grassland of the Derbyshire Dales in the UK resulted in a loss of up to 90 % bryophyte cover with no observed recovery (Arróniz-Crespo et al., 2008). A possible explanation for the increased population density observed in this study may be that added N stimulates protonemal growth leading to a trade-off between individual plant biomass and number of individual shoots. This is reminiscent of the analogous strategy of size–density relationships in vascular plants as a result of competition for resources (Chu et al., 2008) and, in mosses, may be a mechanism that facilitates survival under changing environments. However, when biomass accumulation based on specific area is taken into account, population biomass decreased with large amounts of added N. Changes in bryophyte population biomass have also been observed in other studies; increasing atmospheric N deposition was accompanied by decreased stem volumetric density (g dm–3) in Sphagnum (Bragazza et al., 2004), and 2 years of N addition led to increased total bryophyte biomass in a coastal dune grassland in the UK (Plassmann et al., 2009).
High N additions reduced soil pH and increased EC, while no significant effects were found for soil OM, total N and P, and available N. Acidification generated by N deposition has also been reported in other studies. For example, in semi-arid Mediterranean environments of central Spain, increasing N deposition increased soil inorganic N availability and acidified the soil (Ochoa-Hueso et al., 2014).
Sensitivity of moss physiological activity to N addition
Small amounts of added N increased the concentrations of both chlorophyll b and total chlorophyll, but did not affect chlorophyll fluorescence. In contrast, these parameters were suppressed by high N. These results are consistent with our hypothesis that photosynthetic activity in S. caninervis would be stimulated by small amounts of added N, and suppressed by higher amounts.
Osmotic indices may reflect physiological status in response to added N. The decrease in soluble sugar concentrations we recorded suggests that added N may alleviate the effect of N limitations on moss growth. Similar results have been observed for vascular plants. For example, increased levels of N have been correlated with lower soluble sugar and proline concentrations for two annual vascular plants in the Gurbantunggut Desert (Zhou et al., 2011). However, in this study, proline concentrations were not affected by added N. The trend observed in the concentration of soluble protein, increasing at low amounts of added N (up to N1) and decreasing with higher concentrations (N1·5 and N3), probably reflects the fact that while N is directly absorbed by the moss leaf where it is readily transformed into protein (Soares and Pearson, 1997), large amounts of N impair leaf metabolic function, thus disrupting protein synthesis.
The general trend in antioxidant enzyme activities observed in Syntrichia to added N, although we recorded a statistically significant response only in POD and not SOD and CAT activities, parallels that of the growth parameters, i.e. increasing at low concentrations of added N and increasing with higher amounts. POD, SOD and CAT are important antioxidative defence enzymes, protecting cells from the damage induced by free radicals when cells are under oxidative stress, for example as a result of drought, salinity, chilling and metal toxicity (Sharma et al., 2012; Hashempour et al., 2014). Antioxidant enzyme activity usually increases when plants are under stress, e.g. in cyanobacterial crusts, increases in SOD, POD and CAT activity prevent oxidative damage from UV-B radiation (Xie et al., 2009), but may also decrease if the antioxidative enzyme system becomes disrupted, e.g. moss crusts under enhanced UV-B radiation (Hui et al., 2012). N limitation can also cause oxidative stress. N deficiency elicits oxidative damage in tobacco and rice, with a corresponding increase in SOD and CAT activity and in the concentration of malondialdehyde (Huang et al., 2004; Rubio-Wilhelmi et al., 2011). In the present study, N deficiency was alleviated by moderate N addition, and POD, SOD and CAT activity decreased. However, large amounts of added N (N1·5 and N3 treatments), which had a negative effect on moss growth and physiology, resulted in increased activity of these antioxidative enzymes. Therefore, POD, SOD and CAT activity in S. caninervis may be used a useful indicator of N pollution in desert soils.
Critical levels of N deposition on growth of moss crusts and implications for desert ecosystems
Mosses are particularly sensitive to environmental change and thus are suitable bioindicators for environmental assessments (Ochoa-Hueso and Manrique, 2013; Ochoa-Hueso et al., 2014). Critical levels of pollution are defined as the concentrations of pollutants in the atmosphere which have direct adverse effects on receptors such as plants and ecosystems (Krupa, 2003). For example, physiological responses to N of the moss Racomitrium lanuginosum indicate that the critical level on heathlands is exceeded by addition of 1 g N m–2 year–1 (Pearce et al., 2003).
Nitrate reductase, phosphomonoesterase, and tissue N and K+ concentrations in the moss Pleurochaete squarrosa from a semi-arid area of Central Spain were saturated at only 1 g N m–2 year–1 above the background levels, whereas chlorophyll a and lutein increased even at amounts of up to 6 g N m–2 year–1 (Ochoa-Hueso and Manrique, 2013). The addition of only 1 g N m–2 year–1 (plus severe desiccation stress) promoted chlorosis and inhibited regeneration responses of mosses from arid areas of western USA (Stark et al., 2011). Overall, most moss species appear to respond negatively to N addition at rates of up to 1 g N m–2 year–1. From the present study, we conclude that the relatively safe rate for N deposition on moss BSCs in the Gurbantunggut Desert is up to 0·5 g N m–2 year–1; above this rate, N deposition will almost certainly have a negative effect. It must be underlined that this rate is lower than that for cyanobacterial and lichen BSCs (Zhou et al., 2015) and the range of critical levels reviewed by Krupa (2003), who concluded that 0·5–1 g N m–2 year–1 total N deposition would not affect cryptogam ecosystems.
We conclude that if N pollution continues to increase, this may lead to the decline and the disappearance of moss BSCs from the Gurbantunggut Desert.
ACKNOWLEDGEMENTS
This study was jointly supported by the National Basic Research Program (2014CB954202), the National Natural Science Foundation of China (41471251, 41571256), the West Light Foundation of the Chinese Academy of Sciences (XBBS-2014-20) and the Youth Innovation Promotion Association CAS (2015356). We thank Lin Wu, Ye Tao and Guodong Li for their hard work in the field. We are grateful to two anonymous reviewers and the handling editor Dr Silvia Pressel, who greatly contributed to improving the article.
LITERATURE CITED
- Arróniz-Crespo M, Leake JR, Horton P, Phoenix GK. 2008. Bryophyte physiological responses to, and recovery from, long-term nitrogen deposition and phosphorus fertilisation in acidic grassland. New Phytologist 180: 864–874. [DOI] [PubMed] [Google Scholar]
- Bates LS, Waldren RP, Teare ID. 1973. Rapid determination of free proline for water-stress studies. Plant and Soil 39: 205–207. [Google Scholar]
- Bazzaz FA, Chiariello NR, Coley PD, Pitelka LF. 1987. Allocating resources to reproduction and defense. Bioscience 37: 58–67. [Google Scholar]
- Belnap J. 1995. Surface disturbances: their role in accelerating desertification In: Mouat DA, Hutchinson CF, eds Desertification in developed countries. Dordrecht: Springer, 39–57 [DOI] [PubMed] [Google Scholar]
- Belnap J. 2002. Nitrogen fixation in biological soil crusts from southeast Utah, USA. Biology and Fertility of Soils 35: 128–135. [Google Scholar]
- Belnap J. 2006. The potential roles of biological soil crusts in dryland hydrologic cycles. Hydrological Processes 20: 3159–3178. [Google Scholar]
- Belnap J, Eldridge D. 2003. Disturbance and recovery of biological soil crusts In: Belnap J, Lange OL, eds. Biological soil crusts: structure, function, and management. Berlin: Springer-Verlag, 363–383. [Google Scholar]
- Belnap J, Phillips SL, Troxler T. 2006. Soil lichen and moss cover and species richness can be highly dynamic: the effects of invasion by the annual exotic grass Bromus tectorum, precipitation, and temperature on biological soil crusts in SE Utah. Applied Soil Ecology 32: 63–76. [Google Scholar]
- Belnap J, Phillips SL, Flint S, Money J, Caldwell M. 2008. Global change and biological soil crusts: effects of ultraviolet augmentation under altered precipitation regimes and nitrogen additions. Global Change Biology 14: 670–686. [Google Scholar]
- Bobbink R, Hicks K, Galloway J, et al. 2010. Global assessment of nitrogen deposition effects on terrestrial plant diversity: a synthesis. Ecological Applications 20: 30–59. [DOI] [PubMed] [Google Scholar]
- Bragazza L, Tahvanainen T, Kutnar L, et al. 2004. Nutritional constraints in ombrotrophic Sphagnum plants under increasing atmospheric nitrogen deposition in Europe. New Phytologist 163: 609–616. [DOI] [PubMed] [Google Scholar]
- Chen YN, Wang Q, LI WH, Ruan X. 2007. Microbiotic crusts and their interrelations with environmental factors in the Gurbantonggut Desert, western China. Environmental Geology 52: 691–700. [Google Scholar]
- Choudhury S, Panda SK. 2005. Toxic effects, oxidative stress and ultrastructural changes in moss Taxithelium nepalense (Schwaegr.) Broth. under chromium and lead phytotoxicity. Water, Air, and Soil Pollution 167: 73–90. [Google Scholar]
- Chu CJ, Maestre FT, Xiao S, et al. 2008. Balance between facilitation and resource competition determines biomass–density relationships in plant populations. Ecology Letters 11: 1189–1197. [DOI] [PubMed] [Google Scholar]
- Clark CM, Tilman D. 2008. Loss of plant species after chronic low-level nitrogen deposition to prairie grasslands. Nature 451: 712–715. [DOI] [PubMed] [Google Scholar]
- Coe KK, Belnap J, Grote EE, Sparks JP. 2012a. Physiological ecology of desert biocrust moss following 10 years exposure to elevated CO2: evidence for enhanced photosynthetic thermotolerance. Physiologia Plantarum 144: 346–356. [DOI] [PubMed] [Google Scholar]
- Coe KK, Belnap J, Sparks JP. 2012b. Precipitation-driven carbon balance controls survivorship of desert biocrust mosses. Ecology 93: 1626–1636. [DOI] [PubMed] [Google Scholar]
- Eldridge DJ, Greene RSB. 1994. Microbiotic soil crusts – a review of their roles in soil and ecological processes in the rangelands of Australia. Australian Journal of Soil Research 32: 389–415. [Google Scholar]
- Evans RD, Johansen JR. 1999. Microbiotic crusts and ecosystem processes. Critical Reviews in Plant Sciences 18: 183–225. [Google Scholar]
- Fenn ME, Haeuber R, Tonnesen GS, et al. 2003. Nitrogen emissions, deposition, and monitoring in the western United States. Bioscience 53: 391–403. [Google Scholar]
- Gonzalez CM, Pignata ML. 1994. The influence of air pollution on soluble proteins, chlorophyll degradation, MDA, sulphur and heavy metals in a transplanted lichen. Chemistry and Ecology 9: 105–113. [Google Scholar]
- Hashempour A, Ghasemnezhad M, Ghazvini RF, Sohani MM. 2014. Olive (Olea europaea L.) freezing tolerance related to antioxidant enzymes activity during cold acclimation and non acclimation. Acta Physiologiae Plantarum 36: 3231–3241. [Google Scholar]
- Hu CX, Liu YD, Song LR, Zhang DK. 2002. Effect of desert soil algae on the stabilization of fine sands. Journal of Applied Phycology 14: 281–292. [Google Scholar]
- Huang ZA, Jiang DA, Yang Y, Sun JW, Jin SH. 2004. Effects of nitrogen deficiency on gas exchange, chlorophyll fluorescence, and antioxidant enzymes in leaves of rice plants. Photosynthetica 42: 357–364. [Google Scholar]
- Hui R, Li X-r, Jia R-l, Zhao X, Liu Y-m, Chen C-y. 2012. Effects of enhanced UV-B radiation on physiological characteristics of Bryum argenteum. Shengtaixue Zazhi 31: 38–43 (in Chinese with English abstract). [Google Scholar]
- Jägerbrand AK, Molau U, Alatalo JM. 2003. Responses of bryophytes to simulated environmental change at Latnjajaure, northern Sweden. Journal of Bryology 25: 163–168. [Google Scholar]
- Jia Y, Yu G, He N, et al. 2014. Spatial and decadal variations in inorganic nitrogen wet deposition in China induced by human activity. Scientific Reports 4: 3763. doi:10.1038/srep03763. [DOI] [PMC free article] [PubMed] [Google Scholar]
- Jones M, Oxley E, Ashenden T. 2002. The influence of nitrogen deposition, competition and desiccation on growth and regeneration of Racomitrium lanuginosum (Hedw.) Brid. Environmental Pollution 120: 371–378. [DOI] [PubMed] [Google Scholar]
- Kidron GJ, Barinova S, Vonshak A. 2012. The effects of heavy winter rains and rare summer rains on biological soil crusts in the Negev Desert. Catena 95: 6–11. [Google Scholar]
- Krupa SV. 2003. Effects of atmospheric ammonia (NH3) on terrestrial vegetation: a review. Environmental Pollution 124: 179–221. [DOI] [PubMed] [Google Scholar]
- Lan SB, Wu L, Zhang DL, Hu CX. 2012. Successional stages of biological soil crusts and their microstructure variability in Shapotou region (China). Environmental Earth Sciences 65: 77–88. [Google Scholar]
- Lassouane N, Aïd F, Lutts S. 2013. Water stress impact on young seedling growth of Acacia arabica. Acta Physiologiae Plantarum 35: 2157–2169. [Google Scholar]
- Li KH, Song W, Liu XJ, et al. 2012. Atmospheric reactive nitrogen concentrations at ten sites with contrasting land use in an arid region of central Asia. Biogeosciences 9: 4013–4021. [Google Scholar]
- Li XR, Jia RL, Chen YW, Huang L, Zhang P. 2011. Association of ant nests with successional stages of biological soil crusts in the Tengger Desert, Northern China. Applied Soil Ecology 47: 59–66. [Google Scholar]
- Lichtenthaler HK, Wellburn AR. 1983. Determinations of total carotenoids and chlorophylls a and b of leaf extracts in different solvents. Biochemical Society Transactions 11: 591–592. [Google Scholar]
- Liu LC, Li SZ, Duan ZH, Wang T, Zhang ZS, Li XR. 2006. Effects of microbiotic crusts on dew deposition in the restored vegetation area at Shapotou, northwest China. Journal of Hydrology 328: 331–337. [Google Scholar]
- Monreal J, Jiménez E, Remesal E, Morillo-Velarde R, García-Mauriño S, Echevarría C. 2007. Proline content of sugar beet storage roots: response to water deficit and nitrogen fertilization at field conditions. Environmental and Experimental Botany 60: 257–267. [Google Scholar]
- Noy-Meir I. 1973. Desert ecosystems: environment and producers. Annual Review of Ecology and Systematics 4: 25–51. [Google Scholar]
- Ochoa-Hueso R, Manrique E. 2013. Effects of nitrogen deposition on growth and physiology of Pleurochaete squarrosa (Brid.) Lindb., a terricolous moss from Mediterranean ecosystems. Water Air and Soil Pollution 224: 1492. [Google Scholar]
- Ochoa-Hueso R, Mejias-Sanz V, Perez-Corona ME, Manrique E. 2013. Nitrogen deposition effects on tissue chemistry and phosphatase activity in Cladonia foliacea (Huds.) Willd., a common terricolous lichen of semi-arid Mediterranean shrublands. Journal of Arid Environments 88: 78–81. [Google Scholar]
- Ochoa-Hueso R, Arroniz-Crespo M, Bowker MA, et al. 2014. Biogeochemical indicators of elevated nitrogen deposition in semiarid Mediterranean ecosystems. Environmental Monitoring and Assessment 186: 5831–5842. [DOI] [PMC free article] [PubMed] [Google Scholar]
- Pearce I, Woodin S, Van der Wal R. 2003. Physiological and growth responses of the montane bryophyte Racomitrium lanuginosum to atmospheric nitrogen deposition. New Phytologist 160: 145–155. [DOI] [PubMed] [Google Scholar]
- Plassmann K, Edwards-Jones G, Jones MLM. 2009. The effects of low levels of nitrogen deposition and grazing on dune grassland. Science of the Total Environment 407: 1391–1404. [DOI] [PubMed] [Google Scholar]
- Proctor MCF, Smirnoff N. 2000. Rapid recovery of photosystems on rewetting desiccation-tolerant mosses: chlorophyll fluorescence and inhibitor experiments. Journal of Experimental Botany 51: 1695–1704. [DOI] [PubMed] [Google Scholar]
- Reed SC, Coe KK, Sparks JP, Housman DC, Zelikova TJ, Belnap J. 2012. Changes to dryland rainfall result in rapid moss mortality and altered soil fertility. Nature Climate Change 2: 752–755. [Google Scholar]
- Rubio-Wilhelmi MM, Sanchez-Rodriguez E, Rosales MA, et al. 2011. Effect of cytokinins on oxidative stress in tobacco plants under nitrogen deficiency. Environmental and Experimental Botany 72: 167–173. [Google Scholar]
- Sharma P, Jha AB, Dubey RS, Pessarakli M. 2012. Reactive oxygen species, oxidative damage, and antioxidative defense mechanism in plants under stressful conditions. Journal of Botany 2012: 217037. [Google Scholar]
- Soares A, Pearson J. 1997. Short-term physiological responses of mosses to atmospheric ammonium and nitrate. Water, Air, and Soil Pollution 93: 225–242. [Google Scholar]
- Stark LR, Brinda JC, McLetchie DN. 2011. Effects of increased summer precipitation and N deposition on Mojave Desert populations of the biological crust moss Syntrichia caninervis. Journal of Arid Environments 75: 457–463. [Google Scholar]
- Stark LR, Brinda JC, McLetchie DN, Oliver MJ. 2012. Extended periods of hydration do not elicit dehardening to desiccation tolerance in regeneration trials of the moss Syntrichia caninervis. International Journal of Plant Sciences 173: 333–343. [Google Scholar]
- Stewart KJ, Coxson D, Grogan P. 2011. Nitrogen inputs by associative cyanobacteria across a low arctic tundra landscape. Arctic Antarctic and Alpine Research 43: 267–278. [Google Scholar]
- Sun S-Q, He M, Cao T, Zhang Y-C, Han W. 2009. Response mechanisms of antioxidants in bryophyte (Hypnum plumaeforme) under the stress of single or combined Pb and/or Ni. Environmental Monitoring and Assessment 149: 291–302. [DOI] [PubMed] [Google Scholar]
- Throop HL. 2005. Nitrogen deposition and herbivory affect biomass production and allocation in an annual plant. Oikos 111: 91–100. [Google Scholar]
- Vitousek PM, Aber JD, Howarth RW, et al. 1997. Human alteration of the global nitrogen cycle: Sources and consequences. Ecological Applications 7: 737–750. [Google Scholar]
- Wu H, Wu X, Li Z, Duan L, Zhang M. 2012. Physiological evaluation of drought stress tolerance and recovery in cauliflower (Brassica oleracea L.) seedlings treated with methyl jasmonate and coronatine. Journal of Plant Growth Regulation 31: 113–123. [Google Scholar]
- Xie Z, Wang Y, Liu Y, Liu Y. 2009. Ultraviolet-B exposure induces photo-oxidative damage and subsequent repair strategies in a desert cyanobacterium Microcoleus vaginatus Gom. European Journal of Soil Biology 45: 377–382. [Google Scholar]
- Zaady E. 2005. Seasonal change and nitrogen cycling in a patchy Negev Desert: a review. Arid Land Research and Management 19: 111–124. [Google Scholar]
- Zhang J, Zhang YM, Downing A, Wu N, Zhang BC. 2011. Photosynthetic and cytological recovery on remoistening Syntrichia caninervis Mitt., a desiccation-tolerant moss from Northwestern China. Photosynthetica 49: 13–20. [Google Scholar]
- Zhang W, Liu X, Hu Y, Li K, Shen J, Luo X, Song W. 2011. Analysis on input of atmospheric nitrogen dry deposition in Urumqi. Arid Zone Research 28: 771–716 (in Chinese with English abstract). [Google Scholar]
- Zhang Y, Zheng LX, Liu XJ, et al. 2008. Evidence for organic N deposition and its anthropogenic sources in China. Atmospheric Environment 42: 1035–1041. [Google Scholar]
- Zhang Y, Wu N, Zhang B, Zhang J. 2010. Species composition, distribution patterns and ecological functions of biological soil crusts in the Gurbantunggut Desert. Journal of Arid Land 2: 180–189. [Google Scholar]
- Zhang YM, Wang HL, Wang XQ, Yang WK, Zhang DY. 2006. The microstructure of microbiotic crust and its influence on wind erosion for a sandy soil surface in the Gurbantunggut Desert of Northwestern China. Geoderma 132: 441–449. [Google Scholar]
- Zheng Y, Xu M, Zhao J, Zhang B, Bei S, Hao L. 2011. Morphological adaptations to drought and reproductive strategy of the moss Syntrichia caninervis in the Gurbantunggut Desert, China. Arid Land Research and Management 25: 116–127. [Google Scholar]
- Zhou X, Zhang Y, Ji X, Downing A, Serpe M. 2011. Combined effects of nitrogen deposition and water stress on growth and physiological responses of two annual desert plants in northwestern China. Environmental and Experimental Botany 74: 1–8. [Google Scholar]
- Zhou X, Zhang Y, Niklas KJ. 2014. Sensitivity of growth and biomass allocation patterns to increasing nitrogen: a comparison between ephemerals and annuals in the Gurbantunggut Desert, north-western China. Annals of Botany 113: 501–511. [DOI] [PMC free article] [PubMed] [Google Scholar]
- Zhou X, Zhang Y, Yin B. 2015. Divergence in physiological responses between cyanobacterial and lichen crusts to a gradient of simulated nitrogen deposition. Plant and Soil 399: 121–134. [Google Scholar]


