

Abstract
Reversible cysteine modifications play important physiological roles such as modulating enzymatic catalysis, maintaining redox homeostasis and conducting cellular signaling. These roles can be critical in the context of disease. Oxidative modifications such as S-nitrosylation (SNO) are signatures of neurodestruction in conditions of oxidative stress however are also indicators of neuroprotection and normal signaling in cellular environments with low concentrations of reactive oxygen and nitrogen species. SNO is a dynamic and low abundance modification and requires sensitive and selective analytical methods for its detection in biological tissues. Here we present an enhanced multiplexing strategy to study SNO in complex mixtures arising from tissues. This method, termed oxidized cysteine-selective cPILOT (OxcyscPILOT), allows simultaneous analysis of SNO-modified peptides in 12 samples. OxcyscPILOT has three primary steps: (1) blocking of free thiols by a cysteine-reactive reagent, (2) enrichment of peptides containing SNO on a solid phase resin, and (3) isotopic labeling and isobaric tagging of enriched peptides on the solid phase resin. This approach offers the advantage of allowing total protein abundance levels to be measured simultaneously with endogenous SNO levels and measurement of SNO levels across four biological replicates in a single analysis. Furthermore, the relative amount of SNO on a specific cysteine site can also be determined. A well-known model of Alzheimer’s disease, the APP/PS-1 transgenic mouse model, was selected for demonstration of the method as several SNO-modified proteins have previously been reported in brain and synaptosomes from AD subjects. OxcyscPILOT analysis resulted in identification of 138 SNO-modified cysteines in brain homogenates that corresponds to 135 proteins. Many of these SNO-modified proteins were only present in wild-type or AD mice, whereas 93 proteins had SNO signals in both WT and AD. Pathway analysis links SNO-modified proteins to various biological pathways especially metabolism and signal transduction, consistent with previous reports in the literature. The OxcyscPILOT strategy provides enhanced multiplexing capability to current redox proteomics methods to study oxidative modifications of cysteine.
Keywords: OxcyscPILOT, Cysteine, S-nitrosylation, Alzheimer’s disease, Isotopic labeling, Isobaric tagging, cPILOT, Mass spectrometry, Quantitative proteomics, Redox proteomics, Cysteine oxidation
Graphical abstract
Introduction
Cysteine is an important amino acid in biology as it is involved in cellular redox status, signaling, and often located in the center of enzyme active sites1. Under conditions of oxidative stress, whereby the cellular concentration of reactive oxygen and nitrogen species are elevated, cysteine can be modified with a number of oxidative post-translational modifications (PTMs)2, 3. For example, high levels of nitric oxide (NO) can lead to reversible S-nitrosylation (SNO) of cysteine and glutathione4. Other common oxidative modifications of cysteine include glutathionylation, disulfide bridge formation, sulfinic, sulfonic, and sulfenic acids, and palmitoylation1, 5–8. S-nitrosylation is key to cellular signaling processes similar to other majors PTMs such as phosphorylation9, 10 and can influence protein conformation, activity, protein-protein interactions, transcription, autophagy, apoptosis and DNA repair11, 12. As opposed to some oxidative modifications that may occur sporadically to proteins, SNO is believed to be highly regulated and occur at specific cysteine sites4.
SNO is critical in disease pathogenesis11, especially in the context of neurodegenerative diseases12, 13. SNO has been linked to protein aggregation and misfolding, mitochondrial dysfunction, synaptic injury, neuronal loss, impaired metabolism and autophagy in Alzheimer’s disease13. While these are detrimental consequences of SNO that likely occur with high concentrations of NO derived from environmental toxins, this PTM can be neuroprotective in Alzheimer’s and has been used as a therapeutic target14. Many proteins have been S-nitrosylated in tissues of Alzheimer’s disease patients or models, including: cyclin-dependent-like kinase 5 (Cdk5), apolipoprotein E (ApoE), tubulin, glyceraldehyde-3-phosphate dehydrogenase (GAPDH), voltage-dependent anion-selective channel protein (VDAC), superoxide dismutase [Mn] (SOD2) and heat shock protein HSP 90 (HSP90)13.
There are noted challenges to studying SNO on a global scale, which include its reversible nature as it can be denitrosylated/transnitrosylated enzymatically, its low abundance, and its potential occurrence at multiple cysteine sites in a protein6, 15. Redox proteomics however, provides tools with which SNO can be studied for individual proteins or globally in an entire proteome. Several approaches have been developed and have been recently reviewed2, 6, 7, 16, 17, including immunoblotting18, biotin-switch assays followed by Western blotting19, redox difference gel electrophoresis (Redox-DIGE)20, isotope-coded affinity tag (ICAT)21, resin-assisted isotopic labeling22 or isobaric tagging23 and iodoTMT24–26. Isobaric tagging methods such as iodoTMT, TMT, or the inclusion of iTRAQ22 allow greater sample multiplexing capabilities (i.e., up to eight samples can be analyzed simultaneously). We recently developed a simple, straightforward, and robust approach to measure oxidized cysteine in global proteome experiments, through coupling on-resin capture of cysteines and isotopic dimethylation reactions27. This approach, called OxcysDML, could be readily modified to study SNO by exchanging the dithiothreitol reducing agent with ascorbate. Ours and other methods26, 28 however, require additional experiments in order to normalize the SNO modification levels to total protein abundance and have limited sample throughput (i.e., can only multiplex two to six samples).
In order to help improve the sample multiplexing capability of measuring SNO in a global fashion and the sensitivity to measure endogenous levels of SNO in biological tissues, we developed an oxidized cysteine-selective combined precursor isotopic labeling and isobaric tagging (OxcyscPILOT) strategy. OxcyscPILOT, is based on global cPILOT for quantifying proteomes29, 30 and total cysteine proteome31 detection. While we use TMT6 reagents to multiplex 12 samples in a single analysis, the method is amenable to 20 samples by using TMT10-plex reagents32. A primary advantage of having enhanced multiplexing is the ability to analyze several biological replicates which minimizes false-positive detection of biologically relevant SNO modifications and methodological error. Additionally, because there are 12 channels available for measurement, total cysteine abundance levels can be obtained alongside SNO modification levels. As a biologically relevant demonstration of OxcyscPILOT, the strategy was applied to brain homogenates from an APP/PS-1 transgenic mouse model29, 33 of Alzheimer’s disease. SNO modification in AD has been reported in the literature13, 18, 34, 35 including, specific SNO-modification sites and proteins. In a single analysis, OxcyscPILOT allows unbiased quantification of SNO-modified protein levels in wild-type and APP/PS-1 mice across biological replicates. Also, SNO levels for specific cysteine sites and the relative amount of SNO compared to total cysteine levels are obtained. Among 520 identified proteins, 135 are SNO-modified proteins, and are mainly involved in metabolism and signal transduction pathways. After conservative criteria were applied, eleven SNO sites were statistically different in expression levels in the AD mice. OxcyscPILOT is a versatile and flexible redox proteomics method, and can be applied to study other oxidative PTMs of cysteine in addition to SNO.
Experimental
Animal Husbandry
Fourteen-month old APP/PS-1 male mice [B6.Cg-Tg(APPswe,PSEN1dE9)85Dbo/Mmjax, stock number 005864, genetic background C57BL/6J express the chimeric mouse/human (Mo/Hu) APP695swe (i.e., K595N and M596L) and a mutant human PS1-dE9] and the genetically heterogeneous wild type (WT) (stock number 000664, genetic background C57BL/6J) were purchased from Jackson Laboratory. Mice were housed in the Division of Laboratory Animal Resources at the University of Pittsburgh and fed standard Purina rodent laboratory chow ad libitum on a 12 hour light/dark cycle. APP/PS-1 (hereafter referred to as AD) and WT mice (N = 4 for each genotype) were euthanized using CO2. Brain tissues were harvested immediately and stored at −80°C until further experiments. Animal protocols were approved by the Institutional Animal Care and Use Committee at the University of Pittsburgh.
Brain Homogenization and Protein Digestion
Brain tissues were homogenized in an ice-cold phosphate buffer saline (PBS) solution containing 8 M urea with 100 passes of a Wheaton homogenizer for total cysteine enrichment. For SNO cysteine enrichment, the same homogenization procedure was utilized except 5 mM N-ethylmaleimide (NEM) and 5 mM EDTA were added into the buffer. Homogenate solution was collected, sonicated, and centrifuged at 13000 rpm for 10 minutes (4°C) to collect supernatant. For total cysteine samples, WT or AD proteins (100 μg, two aliquots for each genotype) containing equimolar mixing of four biological replicates were digested according to previously reported procedures31. Briefly, proteins were denatured and reduced in 50 mM Tris buffer (pH = 8.2), 8 M urea, and 10 mM dithiothreitol (DTT) for 1 hour at 37°C. The resulting protein mixture was diluted 10-fold with 20 mM Tris buffer (pH = 8.2). TPCK-treated trypsin from bovine pancreas (Sigma) was added to each sample in a 4% w/w enzyme/protein ratio and incubated at 37°C overnight. For SNO samples, WT or AD proteins (four biological replicates for each genotype) were incubated with 50 mM NEM for two hours at room temperature in the dark followed by acetone precipitation. After BCA determination of protein concentrations, each sample (1 mg) was digested by adding 4% trypsin in 20 mM Tris buffer (pH = 8.2). Digests were acidified with 0.5% formic acid, cleaned using Waters Oasis HLB C18 cartridges, and lyophilized.
SNO Measurement by Slot Blot
Brain tissues from WT (N = 4) and AD (N = 4) mice were homogenized with the presence of NEM and incubated with 5% SDS for 0.5 h at room temperature. BCA assay was used to determine protein concentrations. An aliquot of 250 μL PBS containing 0.5 μg protein was loaded onto a nitrocellulose membrane with a slot blot apparatus (Bio-Rad). The membranes were blocked with 3% (w/v) BSA solution and 5 mM NEM overnight at 4°C and incubated with a 1:2500 dilution of anti-SNO antibody produced by mouse (Sigma) for 2 hours. After rinsing the membrane, anti-mouse IgG alkaline phosphatase secondary antibody (Sigma) was added with the dilution factor 1:5000 and incubated with the membrane for 1 hour. The membrane was washed in wash blot (PBS with 0.1% Tween 20) and developed using 5-bromo-4-chloro-3-indolyl phosphate (BCIP) (Thermo Fisher)/nitro blue tetrazolium chloride (NBT) (Sigma) colorimetric development. The blot was dried, scanned and slot profiles quantified using Scion Image. Statistical testing (student’s t-test) was performed in Origin 8.0. The entire experiment was repeated twice.
Total Cysteine and SNO-cysteine Enrichment
Enrichment of total cysteine-containing peptides were performed as previously reported31. Briefly, tryptic digests were reduced with 5 mM DTT for 1 hour at 37°C, after which the samples were diluted five-fold to lower the concentration of DTT. After dilution, resin was largely in excess, and the concentration of DTT (< 1 mM) was lower than the minimum level required for efficient reduction of disulfide bonds36. Any remaining DTT, did not appear to significantly affect the resin’s enriching capacity, based on no observable changes to the resin’s physical properties after enrichment37 and previous experiments by our laboratory31. For SNO-cysteine enrichment, tryptic mixtures were reconstituted by HEPES buffer (pH = 7.7) and 20 mM sodium ascorbate was added to selectively reduce SNO. All samples were immediately mixed with pretreated 35 mg Thiopropyl Sepharose 6B thiol-affinity resin (Sigma) for 1.5 h incubation at room temperature. Unbound portion was removed by centrifugation, and the resin was washed by Tris buffer (pH = 8.0), 2 M NaCl, 80% acetonitrile/0.1% TFA and 1% acetic acid (pH = 2.5).
On-Resin Low pH Stable-Isotope Dimethyl Labeling
Extensively washed resin was mixed with 100 μL of 1% acetic acid solution. After that 8 μL of 4% CH2O/13C2H2O (98% 2H and 99% 13C) and 8 μL of 0.6 M NaBH3CN/NaB2H3CN (96% 2H) were added to the sample for light and heavy labeling. The following samples were subject to light (i.e., (-CH3)2) dimethylation: one total cysteine sample from WT, one total cysteine sample from AD, two SNO samples from WT, and two SNO samples from AD. The remaining samples were subject to heavy dimethylation (i.e., (-13C2H3)2). Samples were incubated for 10 min while mixing, and terminated by adding ammonia to a final 0.2% (v/v) concentration. After centrifugation, the resin was washed by tetraethylammonium bromide (TEAB).
On-Resin High pH TMT Tagging
Purified resin was mixed with 75 μL TEAB, and tagged with TMT6 reagents (Thermo Scientific) individually according to the manufacturer’s protocol. TMT reagents 126 and 127 were used to tag total cysteine samples from WT and AD, respectively. SNO samples from WT were tagged with TMT6 reagents 128 and 130, and SNO samples from AD were tagged with TMT6 reagents 129 and 131. Tagging reactions were quenched by 1% hydroxylamine, and the resin washed by Tris buffer (pH = 8.0).
Elution, Alkylation and SCX Fractionation
The captured and labeled cysteinyl-peptides were released by incubating the resin with 20 mM DTT. Each elution was reacted with 80 mM iodoacetamide for 1 hour at room temperature in the dark. Samples were pooled into a single mixture, purified by HLB C18 cartridges, dried and dissolved by SCX reconstitution buffer. The pooled peptide sample was separated by a SCX spin tip (Protea Biosciences) according to manufacturer’s instruction. Four fractions were collected by eluting the sample using buffers containing 40 mM, 80 mM, 150 mM and 500 mM ammonia acetate (10% ACN, pH = 3). Each fraction was dried by speed-vac and reconstituted in 0.1% formic acid solution.
LC-MS/MS Analysis
Online desalting and reversed-phase chromatography was performed with a Nano-LC system equipped with an autosampler (Eksigent). Mobile phases A and B were 3% (v/v) acetonitrile with 0.1% formic acid and 100% (v/v) acetonitrile with 0.1% formic acid, respectively. Sample (5 μL) was loaded onto a trapping column (100 μm i.d. × 2 cm), which was packed in-house with C18 200 Å 5 μm stationary phase material (Michrom Bioresource Inc) at 3 μL/min in 3% mobile phase B for 3 min. The sample was loaded onto an analytical column (75 μm i.d. × 13.2 cm), which was packed in-house with C18 100 Å 5 μm stationary phase material (Michrom Bioresource Inc.; Auburn, CA). The following gradient was used: 0–5 min, 10% mobile phase B; 5–40 min, 10–15% B; 40–90 min, 15–25% B; 90–115 min, 25–30% B; 115–130 min, 30–60% B; 130–135 min, 60–80% B; 135–145 min, 80% B; 145–150 min, 80–10%B; 150–180 min, 10%B. The LC eluent was analyzed with positive ion nanoflow electrospray using a LTQ-Orbitrap Velos mass spectrometer (Thermo Fisher).
Each SCX fraction was injected two times. The MS survey scan in the Orbitrap was 60 000 resolution over m/z 400–1700. The top seven ions were selected for each DDA cycle. DDA parameters were as follows: precursor ions were isolated with a width of 2.8 m/z and normalized collision energy of 35%, the most intense CID fragment ion over the m/z range 400–1300 was selected for HCD-MS3. The HCD fragment-ion isolation width was set to 3 m/z, the normalized collision energy was 60%, and HCD resolution was 7500 in the Orbitrap. The maximum fill time for MS, MS/MS and MS3 is 500 ms, 50 ms and 250 ms, respectively. The total duty cycle timing is ~4 sec.
Database Searching and Data Analysis
RAW files were analyzed using the SEQUEST HT search engine with Proteome Discoverer 1.4 software (Thermo Fisher) and searched against the Uniprot mouse database. SEQUEST HT search parameters are as follows: precursor mass tolerance 15 ppm; fragment mass tolerance 1 Da; dynamic modifications light dimethyl/+28.031 Da (N-terminal) or heavy dimethyl/+36.076 Da (N-terminal), dynamic carbamidomethyl modification/+57.021 Da (Cys), dynamic ethylmaleimide/+125.048 Da (Cys), dynamic oxidation/+15.995 Da (Met) and dynamic TMT-6plex/+229.163 Da (Lys). Decoy database searching was employed to calculate false discovery rate and the cutoff was set to 5% to ensure high level of confidence while maintaining high proteome coverage38. The reporter ions (i.e., m/z 126–131) were identified with the following parameters: centroid with smallest delta mass, 30 ppm for reporter ion mass tolerance. Only peptide spectral matches (PSMs) containing reporter ions of 126 and 127 were used for quantification. The median value across an individual reporter ion channel was calculated from all extracted PSMs, and used for normalization. SNO channels with missing signal were replaced by a minimal signal, and the ratios were calculated based on the summed reporter ion intensities. SNO site occupancy was calculated based on reporter ion intensities of SNO to total cysteine in WT or AD (e.g. 128/126, 130/126 for WT and 129/127, 131/127 for AD, see formulas 1 and 2). Protein level ratios were used to correct SNO ratios between AD and WT. SNO ratios were then log(2) transformed for statistical analysis. For SNO peptides quantified by three or four biological replicates, permutation tests were used to calculate p-values. For SNO peptides quantified by two biological replicates, relative standard deviation (RSD) was calculated. P-value cutoff and RSD cutoff were 0.05 and 30%, respectively. Finally, a fold change cutoff of 25% (log2 (AD/WT) > 0.3 or < −0.3) was also applied. This cutoff was determined based on the relative error of TMT reporter ion signals (Supplemental Figure S1).
| (1) |
| (2) |
Results and discussion
S-nitrosylation is a notable PTM in Alzheimer’s disease and contributes to both neuroprotective39 and neurodestructive processes40. In the APP/PS-1 mouse model of AD used in this work, SNO is detectable in brain tissue homogenates by immunoblot detection (Figure 1). While there is a trend towards higher expression levels of SNO in AD animals, there was no statistically significant difference based on a student’s t-test (p < 0.05). A moderate number of animals were used (N = 4) for this analysis and that SNO is a highly dynamic modification would contribute to this observation. Because the immunoblot detection represents changes across many proteins, assessment of the individual differences in SNO levels of proteins requires more specific detection methods such as immunoprecipitation or mass spectrometry (MS).
Figure 1.

Histogram plot of protein S-nitrosylation (SNO) levels in brain proteins isolated from WT (N = 4) and AD (N = 4) mice. Intensities are normalized to WT. Error bar: ±standard deviation. P-values are 0.57 and 0.10 for trial one and trial two, respectively.
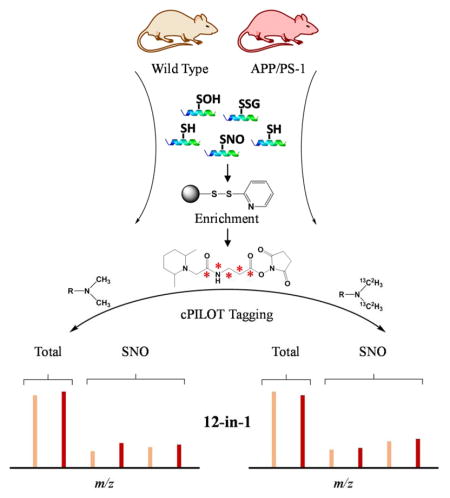
Here we developed an enhanced multiplexing approach “OxcyscPILOT” to detect SNO-proteins and quantify their levels across multiple biological replicates in a single analysis (Figure 2). This approach is an extension to our cPILOT methodologies29–31 and allows more specificity and multiplexing than the previously reported OxcysDML approach27. Oxidative modifications to cysteine are several and overall occur at low abundance levels estimated to be ~1–2% across all tryptic peptides8; and SNO-modified peptides are estimated to be even lower. Enrichment methods are extremely valuable for increasing the detection of these modifications in complex tissues, such as brain homogenate. Realizing this large difference in concentration levels of cysteine-containing peptides and those peptides modified with SNO, we varied the amount of protein starting material used to detect total cysteine levels in comparison to SNO modifications on peptides. Additionally, to enable normalization of the protein SNO levels to the protein abundance, a pooled sample (0.1 mg) of either wild-type or AD tissues across the four biological replicates was generated. Pooled samples were subject to DTT (10 mM) in order to reduce all thiols, trypsin digestion, and then were enriched using a Thiol Sepharose 6B resin. Digested samples were dimethylated (either isotopically labeled light or heavy versions) at low pH conditions to tag N-termini and then labeled with TMT reagents 126 or 127 on lysine amines, for WT and AD samples respectively. Brain homogenate samples (1 mg) from each individual animal were subject to NEM (50 mM) in order to label any free thiols. Next proteins were digested and subject to ascorbate to specifically reduce SNO sites. In this manner, the peptides are enriched with the thiol resin however we note that SNO-modifications are not directly detected in the mass spectrum. These previously SNO-modified peptides were dimethylated (light or heavy) and tagged with TMT reagents 128 to 131. This on-resin dual tagging strategy allows 12 samples to be multiplexed in a single analysis that enables direct normalization of SNO levels to total protein abundance and allows comparison across several biological replicates. Strong cation exchange fractionation coupled with reversed-phase nanoLC-MS/MS and MS3 in the HCD of the LTQ Orbitrap Velos was used for separation and mass analysis.
Figure 2.

Schematic representation of the oxidized cysteine-selective cPILOT (OxcyscPILOT) redox proteomics workflow. For protein level quantification, a pooled sample of 0.1 mg of brain total protein containing an equimolar mixture proteins from four biological replicates of WT or AD mouse is made. Proteins are reduced by DTT and digested by trypsin. Cysteine-containing peptides are enriched by a thiol-affinity resin followed by on-resin low pH dimethylation using light (-C2H6) or heavy (-13C22H6) tags. After buffer exchange, resin-linked peptides are labeled with TMT 126 and 127 reagents for WT and AD, respectively. For S-nitrosylation quantification, 1 mg brain proteins from individual WT or AD mice are treated with NEM to block free sulfhydryl groups. After tryptic digestion, ascorbate is added to the peptide mixture to selectively reduce SNO. Reduced peptides containing newly-formed sulfhydryl groups are enriched by the thiol-affinity resin and subject to similar tagging procedures as the total cysteine samples, except TMT 128, TMT 129, TMT 130 and TMT 131 are used for WT and AD samples from different animals, respectively. Enriched and tagged peptide samples are eluted from the resin and alkylated by iodoacetamide. The twelve samples are combined to a single mixture. This mixture is fractionated by SCX and analyzed using nanoLC-MS/MS3. Protein level ratios, SNO site occupancy in WT or AD, and SNO ratios between WT and AD can be calculated by using corresponding reporter ion intensities.
The efficiencies of the enrichment, dimethylation, and TMT tagging are higher than 98%, 97% and 96% based on peptide spectral matches (PSMs), respectively, and are consistent with previous reports by our laboratory27, 31, which allows us to examine a large number of cysteine-containing proteins and get quantitative information. The total number of cysteine-containing peptides identified in this experiment is 661 (520 proteins) and we detected 138 SNO peptides (135 SNO-proteins) (Table 1). Compared with the previously demonstrated cysteine-selective cPILOT31, OxcyscPILOT identified 170% more cysteinyl peptides with experimental conditions that employed half the number of SCX fractions and 2/3 less instrument acquisition time. The number of SNO-modified proteins is comparable to several iodoTMT24–26 or label-free34 based quantitative studies, and higher than gel-based approaches18. In terms of quantitation, ~ 36% of the identified peptide spectra did not have quantitative information via HCD MS3. This is mostly due to the tryptic peptides with Arg on C-terminus which lack a TMT tag. In a previous study performed by our laboratory whereby trypsin and Lys-C were evaluated. Trypsin resulted in better proteome coverage compared with Lys-C30. Trypsin can also generate peptides with missed cleavage sites, and these peptides (up to two miscleavages) are included in the quantification for individual proteins. In addition, not all peptides modified by TMT can release reporter ions in MS3. One reason is the selection of a b-type ion in MS/MS spectra that is fragmented by HCD and resulting in no reporter ions. The other reason is the very low abundance of SNO modifications present in the samples and the MS3 acquisition is accompanied with significant loss of signal intensities. A dramatic increase in SNO-modifications will be possible with instrumentation such as the Orbitrap Fusion mass spectrometer equipped with faster MS3 acquisition and synchronous precursor selection technology, which takes multiple fragment ions from the MS/MS for HCD-MS3 and results in enhanced sensitivity of reporter ions41.
Table 1.
Summary of OxcyscPILOT results in WT and AD brain tissues.
| Total Proteins Identified | 520 |
| Total Cysteinyl Peptides Identified | 661 |
| Light PSMs | 6574 |
| Heavy PSMs | 8557 |
| WT SNO Proteins | 115 |
| AD SNO Proteins | 113 |
| Total SNO Proteins | 135 |
| Total SNO Peptides | 138 |
| Quantified SNO-modified Peptides (N = 4) | 43 (6)a |
| Quantified SNO-modified Peptides (N = 3) | 14 (2)a |
| Quantified SNO-modified Peptides (N = 2) | 41 (4)b |
| Quantified SNO-modified Peptides (N = 1) | 40 |
Number in bracket indicates the significantly changed SNO-modified peptides in AD compared with WT. A p-value cutoff (<0.05) and fold change cutoff (>25%) is applied.
Number in bracket indicates the significantly changed SNO-modified peptides in AD compared with WT. A RSD cutoff (<30%) and fold change cutoff (>25%) is applied.
In this particular experiment, it is important to note that not all cysteine-containing peptides will generate SNO-related reporter ion signals. For example, the precursor peaks at m/z 617.673 and 620.354 correspond to the triply-charged peptide G(dimethyl)VLFGVPGAFTPGC(IAM)SK(TMT6) of peroxiredoxin-5 (Figure 3a). Upon isolation and fragmentation of the y5 fragments, the MS3 spectrum shows only reporter ion signal at m/z 126 and 127, for the total WT and AD pooled samples. No measurable signal is detected for SNO of this peptide which is consistent with likely sulfenic acid modification of Cysteine 96 on this protein42. Because OxcyscPILOT is only selective to SNO modification, sulfenic acid modifications are not expected to be reduced, enriched and detected. The peptide with Cys96 of peroxiredoxin-5 only shows detectable signals in TMT channels 126 and 127. In WT and AD brain tissues, the lack of TMT signals in this peptide suggest that Cys96 is not SNO-modified in our experiments, or is at such low concentration and not detectable in our experiments, resulting in missing signals in TMT channels 128-131 for this peptide. There are several sample preparation steps (i.e., reduction, enrichment, digestion, chemical labeling, etc.) in OxcyscPILOT that present opportunities for the introduction of experimental error. The intensities of the reporter ions for the WT and AD pooled samples shown in Figure 3a, are very similar across the light and heavy dimethylated samples. Total TMT signals from all peptides detected in the WT or AD pooled samples are heavily correlated in the light (R2 = 0.9807) and heavy dimethylation samples (R2 = 0.9867) (Supplemental Figure S1). This indicates the robustness of this approach and lends to an overall error of ~25%.
Figure 3.

Example OxcyscPILOT MS spectra. a) Pair of triply charged precursor peaks with m/z = 617.673 and m/z = 620.354. Both peaks are isolated and fragmented by CID to generate tandem mass spectra to sequence the peptide, which is G(dimethyl)VLFGVPGAFTPGC96(IAM)SK(TMT6) of peroxiredoxin-5. The most intense peaks within the m/z range of 400–1300 in CID spectra (y5) are further selected and fragmented to give the HCD MS3 spectra, which are zoomed-in over the reporter ion region. Reporter ions of 126 and 127 represent the level of total cysteine, and the absence of reporter ion 128, 129, 130 and 131 indicate this site is not modified by SNO. b) Pair of doubly charged precursor peaks with m/z = 619.380 and m/z = 623.402. Both peaks are isolated and fragmented by CID to generate tandem mass spectra to sequence the peptide, which is A(dimethyl)VLC178(IAM)PPPVK(TMT6) of ras-related C3 botulinum toxin substrate 3. The most intense peaks within the m/z range of 400–1300 in CID spectra (y5) are further selected and fragmented to give the HCD MS3 spectra, which are zoomed-in over the reporter ion region. Reporter ions of 126 and 127 represent the level of total cysteine, and the signals of 128, 129, 130 and 131 indicate the presence of SNO on this site.
Several situations arise in this dataset where the detection of SNO may only exist in peptides detected for a single biological replicate (N = 40) or in as many as all four biological replicates (N = 43) of WT and AD animals (see Table 1 and Supplemental Tables S2 and S3). Stringent criteria were applied and only those peptides that were detected in any two biological replicates were considered for further analysis. Ideally, all peptides that are SNO-modified would be detected in reporter ion channels 128-131 in both light and heavy dimethylated samples. An example of this is shown in Figure 3b, for the doubly-charged precursor pair at m/z 619.380 and 623.402 identified as A(dimethyl)VLC(IAM)PPPVK(TMT6) of the ras-related C3 botulinum toxin substrate 3 protein. The MS3 spectra for both light and heavy y5 fragments show low intensity of detectable ion signals across reporter ions for all four biological replicates.
A total of 115 SNO-modified proteins were identified in WT mice and 113 SNO-modified proteins were identified in AD mice (Supplemental Table S1). Ninety-three proteins had detectable SNO-modified peptides in both WT and AD samples, while 22 and 20 SNO- modified proteins are exclusive for WT and AD, respectively. A total of 135 SNO-modified proteins are involved in a range of biological pathways such as cell cycle, immune system, homeostasis, neuronal system, and vesicle-mediated transport (Figure 4). A majority of SNO-modified proteins are involved in metabolism (32 proteins) or signal transduction (29 proteins). An interesting example is L-lactate dehydrogenase, which is only present in WT but not in AD (Supplemental Table 1). The SNO modification of L-lactate dehydrogenase in WT tissue has been reported for normal enzymatic function in metabolism43. The absence of this modification in AD brain may be indicative of dysregulated energy metabolism in disease. These results indicate that SNO is a very dynamic modification, and are highly consistent with other reports in the literature18, 34. A total of 56 SNO-modified proteins (Supplemental Table S1) were also frequently reported in previous AD studies13, 18, 34, 35, such as glial fibrillary acidic protein18, 34, 35, heat shock cognate 71 kDa protein18, 34, elongation factor 234, sarcoplasmic/endoplasmic reticulum calcium ATPase 234, glyceraldehyde-3-phosphate dehydrogenase18, 34, triosephosphate isomerase18, 34, 35, fructose-bisphosphate aldolase A18, 34, dynamin-1-like protein44, 2′,3′-cyclic-nucleotide 3′-phosphodiesterase34, 45, ras-related C3 botulinum substrate 334, 46 and ADP/ATP translocase 134, 46. In addition 79 SNO-modified proteins (Supplemental Table S1) were identified for the first time in this work. It is important to observe the number of cellular signaling pathways, such as Pho GTPases, Wnt, NGF that SNO contributes to which suggests this oxidation status of cysteine is critical for normal cellular signaling (Figure 4). Network analysis of 135 SNO-modified proteins in WT and AD brains using STRING (version 10) shows that the modified proteins are enriched in some basic molecular pathways such as citrate cycle, 2-oxocarboxylic acid metabolism, oxidative phosphorylation, glycolysis/gluconeogenesis, Huntington’s disease and axon guidance (Figure 5). These pathways are zoomed-in to show the differences of the network patterns of SNO-modified proteins in WT and AD. Although most of SNO-modified proteins widely participate in both WT and AD, some pathways containing abnormal SNO are observed. For example in the pathway of glycolysis/gluconeogenesis, triosephosphate isomerase (Tpi1), glucose-6-phosphate isomerase (GM1840) and alcohol dehydrogenase 1 (Adha) have SNO modifications in WT but not AD. A lower p-value (3.29E-8 v.s. 2.01E-4) and a higher gene number (8 v.s. 5) indicates that SNO is more enriched in WT than AD in glycolysis/gluconeogenesis pathway. The different SNO involvement in carbohydrate metabolism in AD mice brain was also reported in a previous study34, and is consistent with the finding of altered glucose tolerance and metabolic changes in PET analyses of AD patients47. While previous studies mainly focused on proteins with only SNO modification in AD18, 34, our data also suggests the absence of SNO modification may be important for disease pathogenesis in AD. Generally SNO-modified proteins in this study have a trend of increased levels in AD compared to WT (Figure 1 and Table 2).
Figure 4.

Pathway analysis of 135 SNO-proteins identified in WT and AD mouse brain tissues using Reactome database (http://www.reactome.org/). The pie chart shows primary pathways that SNO-proteins are involved and the number of proteins in each pathwa. SNO-proteins involved in metabolism and signal transduction are further broken down into categories as shown in histogram plots.
Figure 5.

Interaction network of 135 SNO-modified proteins identified in WT and AD mouse brain tissues. Some example KEGG pathways are circled by dished ovals and zoomed-in to show the differences of the network patterns between WT and AD. The p-value and number of proteins in each pathway are provided. Network analysis was performed using STRING (version 10) with confidence view and confidence score of 0.700. No text mining was used. Uniprot accession numbers are uploaded to STRING and return as gene symbols.
Table 2.
Quantified SNO sites with significant changes in levels between WT and AD.
| Protein Name | Uniprot Acc. No. |
Peptide Sequence | Modified Site |
Protein Level AD/WT |
Relative SNO Site Occupancy in WTa |
Relative SNO Site Occupancy in ADa |
SNO log(2) Fold Change AD/WT in Each Biological Replicate |
Average SNO log(2) Fold Change AD/WTb |
Statistics | Ne | ||||
|---|---|---|---|---|---|---|---|---|---|---|---|---|---|---|
| 1 | 2 | 3 | 4 | |||||||||||
|
| ||||||||||||||
| Septin-5 | Q9Z2Q6 | ADCLVPSEIRK | C193 | 0.895 | 0.18% | 0.30% | 1.868 | 0.528 | 0.576 | 0.246 | 0.804 | p-Valuec | 0.0001 | 4 |
| ADP/ATP translocase 1 | P48962 | EFNGLGDCLTK | C160 | 0.850 | 0.73% | 1.05% | 0.410 | 0.330 | 0.176 | 1.325 | 0.560 | 0.0001 | 4 | |
| Myc box-dependent-interacting protein 1 | O08539 | AAPQWCQGK | C186 | 0.906 | 0.35% | 0.47% | 0.979 | 0.045 | 0.415 | 0.341 | 0.445 | 0.0050 | 4 | |
| Isocitrate dehydrogenase [NAD] subunit | Q91VA7 | GVIECLK | C184 | 0.936 | 0.29% | 0.38% | 0.657 | 0.123 | 0.644 | 0.092 | 0.379 | 0.0112 | 4 | |
| Ras-related C3 botulinum toxin substrate 3 | P60764 | AVLCPPPVK | C178 | 0.929 | 0.48% | 0.60% | 1.073 | 0.006 | 0.020 | 0.362 | 0.365 | 0.0099 | 4 | |
| 14-3-3 protein gamma | P61982 | NCSETQYESK | C112 | 1.152 | 7.18% | 5.00% | −0.626 | −0.023 | −0.967 | −0.549 | −0.541 | 0.0001 | 4 | |
| Glutamine synthetase | P15105 | TLDCEPK | C49 | 0.911 | 0.22% | 0.29% | 0.200 | 0.742 | 0.520 | N.A. | 0.487 | 0.0001 | 3 | |
| Myelin proteolipid protein | P60202 | VCGSNLLSICK | C220 | 1.099 | 2.29% | 0.89% | −2.385 | −2.091 | −0.826 | N.A. | −1.767 | 0.0001 | 3 | |
|
| ||||||||||||||
| Citrate synthase, mitochondrial | Q9CZU6 | FRGYSIPECQK | C101 | 0.988 | 0.07% | 0.42% | 2.658 | 2.434 | N.A. | N.A. | 2.546 | RSDd | 0.1097 | 2 |
| 14-3-3 protein zeta/delta | P63101 | ACSLAK | C188 | 0.515 | 27.86% | 54.41% | 0.868 | 1.072 | N.A. | N.A. | 0.970 | 0.0998 | 2 | |
| 2′,3′-cyclic-nucleotide 3′-phosphodiesterase | P16330 | TAWRLDCAQLK | C157 | 1.149 | 0.45% | 0.66% | 0.515 | 0.581 | N.A. | N.A. | 0.548 | 0.0326 | 2 | |
| Citrate synthase, mitochondrial | Q9CZU6 | GYSIPECQK | C101 | 0.933 | 0.21% | 0.30% | 0.310 | 0.731 | N.A. | N.A. | 0.520 | 0.2045 | 2 | |
Relative SNO site occupancy percentage is calculated based on normalized reporter ion intensities of SNO to total cysteine in WT or AD (e.g. 128/126, 130/126 for WT and 129/127, 131/127 for AD, see formulas 1 and 2).
SNO fold changes are corrected by protein level abundance change. A fold change of at least 25% is applied to determine significance (log2(AD/WT)>0.3 or <−0.30).
P-value cutoff (<0.05) is applied for group of N = 4 and 3.
RSD cutoff (<30%) is applied for group of N =2.
Number of biological replicates quantified.
There are several challenges for quantifying SNO-modified proteins in disease. One is cysteine PTM levels can be affected by protein expression changes. In order to take this into consideration, multiple experiments must be performed. For example, in a redox proteomic study using duplex ICAT reagents, because there are no more channels available for protein quantification, a separate experiment using isotopic dimethyl labeling is employed to provide protein abundance data48. Even in our OxcysDML approach, two experiments were performed to obtain total cysteine oxidation levels and protein abundance information based on cysteine-containing peptides27. Two, there is a large difference (roughly two to three orders of magnitude49) between total peptide and SNO-modified peptide abundance. This means non-cysteinyl peptides can cause significant matrix effects and suppress the detection of SNO-modified peptides, thus decreasing sensitivity. Solutions are to use the total cysteinyl peptides to represent the protein for protein abundance information, and to increase the sample starting material of SNO-modified samples by a factor of 10. The latter helps facilitate reducing the abundance differences, so that both total cysteinyl and SNO-modified peptides can be detected in a single experiment. This design was successfully been utilized with iodoTMT26. The throughput of iodoTMT is greater than ICAT or OxcysDML methods but still requires multiple experiments to measure across biological replicates26. Due to the enhanced multiplexing ability of OxcyscPILOT, the total cysteinyl peptides which represent the protein abundance in each genotype and also SNO levels from four biological replicates of each genotype can be detected in a single run. After proteins were filtered based on having SNO-modifications detectable in at least two biological replicates, the SNO levels were normalized to the total protein abundance level (see Experimental). Following normalization, permutation testing31, 50 was done in order to determine which SNO-modified peptides were statistically different between WT and AD samples. Table 2 provides a list of 11 proteins that were statistically different in SNO modification level in AD compared to WT mice. Most of these proteins have SNO site occupancy below 1%, except for 14-3-3 proteins. The high SNO-modification levels (28–54%) of 14-3-3 proteins may be linked to the binding nature of 14-3-3 proteins to microtubule-associated protein tau, whose hyperphosphorylation results in the formation of amyloid plaques and neurofibrillary tangles in AD51. The low SNO site occupancy percentage data in Table 2 suggests the room for further improvement. In the sample preparation we used a 10-fold higher sample amount for SNO enrichment. However, if the tissue amounts permit, our data suggests a 100-fold SNO loading amount would be a better choice. SNO levels are variable amongst mice of the same genetic background, leading to differences in the AD/WT ratios detected. For some peptides, the measured SNO ratios are highly diverse. We mainly attribute this to the dynamic nature of SNO modification across different animals, and used permutation testing for statistical analysis. Permutation testing is an ideal statistical test for proteomic data to calculate p-values without further adjustment50. However the p-value only indicates the mathematical probability of the null hypothesis (H0: μ= 0, no significant change), regardless of the degree of change. Thus we also applied a 25% SNO ratio cutoff to look for the peptides with the significant changes of SNO modification. As we can see from Table 2, most of them have increased SNO levels in AD, which is consistent with previous studies18, 34. A few of these proteins have been previously identified as SNO-modified in AD: ADP/ATP translocase 134, 46, ras-related C3 botulinum toxin substrate 334, 46, 14-3-3 protein zeta/delta18, glutamine synthetase18, 34, myelin proteolipid protein34, citrate synthase34 and 2′,3′-cyclic-nucleotide 3′-phosphodiesterase34. Furthermore, specific modification sites such as C160 for ADP/ATP translocase 1 and C178 for ras-related C3 botulinum toxin substrate 3 have been quantified as significantly SNO-modified in AD mouse brain tissue over WT, which are consistent with a relevant proteomic study34. These two proteins have been linked with AD and reviewed in detail52, 53. It must be noted that the whole brain tissue is used in this study. This is unlike some other studies using specific cell types or brain regions. For example, one report studied the SNO-modified proteins in different AD brain regions (hippocampus, substantia nigra and cortex)18, and another study focused on the synaptosome of APP mouse34. Brain is a highly heterogeneous organ and different portions exhibit various changes in AD. Using the entire homogenate of the brain may cause misrepresentation of the changes in specific regions or cells in AD. A total of 50 SNO-modified proteins identified by this work were also reported in localized brain region and synaptosome studies18, 34 (Supplemental Table S1). It would be interesting to study SNO-modified proteins at the level of different cells (e.g., microglia, neurons) or brain regions (e.g., cortex, striatum) and compare to entire homogenate.
Characterization of specific cysteine reversible modification (e.g., SNO) from complex samples is challenging due to its low abundance and labile nature. We believe a desirable redox proteomic strategy to study cysteine PTM should be site-specific, sensitive, versatile, unbiased and highly multiplexed. OxcyscPILOT is one such strategy. First, unlike gel-based approach, in which the site information of cysteine PTM is generally unavailable, OxcyscPILOT is able to localize cysteine PTM on the protein primary sequence, and link this information to protein structure and function for biological interpretation. This is a limitation however when multiple cysteinse are present on the same peptide and it is not possible to determine which site was initially modified. Because NEM blocking was employed prior to reduction and enrichment, peptides observed with multiple cysteines (e.g. ACNCLLLK, Supplemental Table S2) should have multiple SNO sites. Second, OxcyscPILOT has desirable sensitivity in terms of its proteome coverage and its ability for isolation and MS3 quantification of SNO-modified peptides with ~1% abundance. We attribute this to the efficient enriching ability of the thiol-affinity resin, and the integration of all chemical labeling steps on the resin. Although many sample preparation steps are involved in the OxcyscPILOT workflow, repeated sample extraction and cleanup steps are not needed. In Third, we used SNO here to demonstrate the application of OxcyscPILOT methodology. In fact this method is versatile to follow other SNO modifications. For example, by simply changing the selective reduction reagent, different types of cysteine reversible modifications, such as S-glutathionylation or sulfenic acid, can be characterized in the same method. Fourth, the number of multiplexing channels can also be expanded by utilizing triplex dimethylation or ten-plex TMT reagents. Fifth, OxcyscPILOT is an unbiased proteomic approach because protein ratios are simultaneously determined and used for SNO-peptide normalization. Sixth, the relative site occupancy of site-specific SNO can be calculated, which is helpful to screen the proteins that are susceptible to nitric oxide attack, e.g., 14-3-3 proteins in this study.
Conclusions
A novel quantitative proteomics approach to quantify endogenous S-nitrosylation from multiple complex samples, OxcyscPILOT, is presented in this work. Endogenous levels of SNO are very low abundant and require high sample starting amounts or very sensitive detection methods in combination with enrichment strategies. This enhanced multiplexing technique for cysteine PTM quantification enables enrichment and tagging of twelve samples for unbiased detection of SNO-modified proteins. This was extremely useful for measuring changes across multiple biological replicates and for measuring total protein abundance levels for data normalization. Because all chemical reactions are coupled with affinity purification on the solid phase resin, the entire workflow exhibits desirable efficiency in terms of cysteinyl proteome coverage and cysteine PTM isolation. We demonstrate this method to study S-nitrosylation using brain tissues from an Alzheimer’s disease mouse model, and much of the biological changes are consistent with previous findings in Alzheimer’s disease. In particular, SNO-modified proteins are heavily involved in normal cellular signaling processes and metabolism, amongst other functions such as axon guidance, vesicle-transport and immune system response. We believe this technique can be directly applied to investigate other types of cysteine oxidative modifications by simply changing the sample preparation conditions. Furthermore, the sensitivity can be improved by employing SPS MS3 acquisition, and the multiplexing capabilities can be enhanced to 20 or 24 samples using TMT10-plex or DiLeu isobaric tagging reagents.
Supplementary Material
Acknowledgments
The authors would like to acknowledge the National Institutes of Health, National Institute of General Medicine Sciences for financial support (1R01GM 117191-01, R.A.S.R.). The authors also acknowledge Xi Wang for assistance with statistical testing.
References
- 1.Baez NOD, Reisz JA, Furdui CM. Free Radical Bio Med. 2015;80:191–211. doi: 10.1016/j.freeradbiomed.2014.09.016. [DOI] [PMC free article] [PubMed] [Google Scholar]
- 2.Lennicke C, Rahn J, Heimer N, Lichtenfels R, Wessjohann LA, Seliger B. Proteomics. 2016;16:197–213. doi: 10.1002/pmic.201500268. [DOI] [PubMed] [Google Scholar]
- 3.Butterfield DA, Gu L, Di Domenico F, Robinson RA. Mass spectrometry reviews. 2014;33:277–301. doi: 10.1002/mas.21374. [DOI] [PubMed] [Google Scholar]
- 4.Foster MW, Hess DT, Stamler JS. Trends Mol Med. 2009;15:391–404. doi: 10.1016/j.molmed.2009.06.007. [DOI] [PMC free article] [PubMed] [Google Scholar]
- 5.Verrastro I, Pasha S, Jensen KT, Pitt AR, Spickett CM. Biomolecules. 2015;5:378–411. doi: 10.3390/biom5020378. [DOI] [PMC free article] [PubMed] [Google Scholar]
- 6.Couvertier SM, Zhou Y, Weerapana E. Bba-Proteins Proteom. 2014;1844:2315–2330. doi: 10.1016/j.bbapap.2014.09.024. [DOI] [PubMed] [Google Scholar]
- 7.Boronat S, Garcia-Santamarina S, Hidalgo E. Free radical research. 2015;49:494–510. doi: 10.3109/10715762.2015.1009053. [DOI] [PubMed] [Google Scholar]
- 8.Garcia-Santamarina S, Boronat S, Hidalgo E. Biochemistry. 2014;53:2560–2580. doi: 10.1021/bi401700f. [DOI] [PubMed] [Google Scholar]
- 9.Ruprecht B, Lemeer S. Expert review of proteomics. 2014;11:259–267. doi: 10.1586/14789450.2014.901156. [DOI] [PubMed] [Google Scholar]
- 10.Hunter T. Cold Spring Harbor perspectives in biology. 2014;6:a020644. doi: 10.1101/cshperspect.a020644. [DOI] [PMC free article] [PubMed] [Google Scholar]
- 11.Lopez-Sanchez LM, Lopez-Pedrera C, Rodriguez-Ariza A. Mass spectrometry reviews. 2014;33:7–20. doi: 10.1002/mas.21373. [DOI] [PubMed] [Google Scholar]
- 12.Akhtar MW, Sunico CR, Nakamura T, Lipton SA. International journal of cell biology. 2012;2012:463756. doi: 10.1155/2012/463756. [DOI] [PMC free article] [PubMed] [Google Scholar]
- 13.Zhao QF, Yu JT, Tan L. Molecular neurobiology. 2014 doi: 10.1007/s12035-014-8672-2. [DOI] [Google Scholar]
- 14.Nakamura T, Lipton SA. Cell calcium. 2010;47:190–197. doi: 10.1016/j.ceca.2009.12.009. [DOI] [PMC free article] [PubMed] [Google Scholar]
- 15.Torta F, Usuelli V, Malgaroli A, Bachi A. Proteomics. 2008;8:4484–4494. doi: 10.1002/pmic.200800089. [DOI] [PubMed] [Google Scholar]
- 16.Butterfield DA, Dalle-Donne I. Mass spectrometry reviews. 2014;33:1–6. doi: 10.1002/mas.21404. [DOI] [PubMed] [Google Scholar]
- 17.Gu L, Robinson RAS. Proteomics. Clinical applications. 2016 doi: 10.1002/prca.201600015. Manuscript in Preparation. [DOI] [PMC free article] [PubMed] [Google Scholar]
- 18.Zahid S, Khan R, Oellerich M, Ahmed N, Asif AR. Neuroscience. 2014;256:126–136. doi: 10.1016/j.neuroscience.2013.10.026. [DOI] [PubMed] [Google Scholar]
- 19.Forrester MT, Foster MW, Benhar M, Stamler JS. Free radical biology & medicine. 2009;46:119–126. doi: 10.1016/j.freeradbiomed.2008.09.034. [DOI] [PMC free article] [PubMed] [Google Scholar]
- 20.Chouchani ET, Hurd TR, Nadtochiy SM, Brookes PS, Fearnley IM, Lilley KS, Smith RA, Murphy MP. Biochem J. 2010;430:49–59. doi: 10.1042/BJ20100633. [DOI] [PMC free article] [PubMed] [Google Scholar]
- 21.Wu C, Parrott AM, Liu T, Jain MR, Yang Y, Sadoshima J, Li H. Journal of proteomics. 2011;74:2498–2509. doi: 10.1016/j.jprot.2011.06.001. [DOI] [PMC free article] [PubMed] [Google Scholar]
- 22.Forrester MT, Thompson JW, Foster MW, Nogueira L, Moseley MA, Stamler JS. Nature biotechnology. 2009;27:557–559. doi: 10.1038/nbt.1545. [DOI] [PMC free article] [PubMed] [Google Scholar]
- 23.Su D, Shukla AK, Chen B, Kim JS, Nakayasu E, Qu Y, Aryal U, Weitz K, Clauss TR, Monroe ME, Camp DG, 2nd, Bigelow DJ, Smith RD, Kulkarni RN, Qian WJ. Free radical biology & medicine. 2013;57:68–78. doi: 10.1016/j.freeradbiomed.2012.12.010. [DOI] [PMC free article] [PubMed] [Google Scholar]
- 24.Pan KT, Chen YY, Pu TH, Chao YS, Yang CY, Bomgarden RD, Rogers JC, Meng TC, Khoo KH. Antioxidants & redox signaling. 2014;20:1365–1381. doi: 10.1089/ars.2013.5326. [DOI] [PMC free article] [PubMed] [Google Scholar]
- 25.Qu Z, Meng F, Bomgarden RD, Viner RI, Li J, Rogers JC, Cheng J, Greenlief CM, Cui J, Lubahn DB, Sun GY, Gu Z. J Proteome Res. 2014;13:3200–3211. doi: 10.1021/pr401179v. [DOI] [PMC free article] [PubMed] [Google Scholar]
- 26.Wojdyla K, Williamson J, Roepstorff P, Rogowska-Wrzesinska A. Journal of proteomics. 2015;113:415–434. doi: 10.1016/j.jprot.2014.10.015. [DOI] [PubMed] [Google Scholar]
- 27.Gu L, Robinson RA. Analytical and bioanalytical chemistry. 2016;408:2993–3004. doi: 10.1007/s00216-016-9307-4. [DOI] [PubMed] [Google Scholar]
- 28.Garcia-Santamarina S, Boronat S, Domenech A, Ayte J, Molina H, Hidalgo E. Nature protocols. 2014;9:1131–1145. doi: 10.1038/nprot.2014.065. [DOI] [PubMed] [Google Scholar]
- 29.Evans AR, Gu L, Guerrero R, Jr, Robinson RA. Proteomics Clinical applications. 2015;9:872–884. doi: 10.1002/prca.201400149. [DOI] [PubMed] [Google Scholar]
- 30.Evans AR, Robinson RA. Proteomics. 2013;13:3267–3272. doi: 10.1002/pmic.201300198. [DOI] [PubMed] [Google Scholar]
- 31.Gu L, Evans AR, Robinson RA. Journal of the American Society for Mass Spectrometry. 2015;26:615–630. doi: 10.1007/s13361-014-1059-9. [DOI] [PubMed] [Google Scholar]
- 32.McAlister GC, Huttlin EL, Haas W, Ting L, Jedrychowski MP, Rogers JC, Kuhn K, Pike I, Grothe RA, Blethrow JD, Gygi SP. Analytical chemistry. 2012;84:7469–7478. doi: 10.1021/ac301572t. [DOI] [PMC free article] [PubMed] [Google Scholar]
- 33.Jankowsky JL, Fadale DJ, Anderson J, Xu GM, Gonzales V, Jenkins NA, Copeland NG, Lee MK, Younkin LH, Wagner SL, Younkin SG, Borchelt DR. Human molecular genetics. 2004;13:159–170. doi: 10.1093/hmg/ddh019. [DOI] [PubMed] [Google Scholar]
- 34.Zareba-Koziol M, Szwajda A, Dadlez M, Wyslouch-Cieszynska A, Lalowski M. Molecular & cellular proteomics : MCP. 2014;13:2288–2305. doi: 10.1074/mcp.M113.036079. [DOI] [PMC free article] [PubMed] [Google Scholar]
- 35.Riederer IM, Schiffrin M, Kovari E, Bouras C, Riederer BM. Brain research bulletin. 2009;80:233–241. doi: 10.1016/j.brainresbull.2009.04.018. [DOI] [PubMed] [Google Scholar]
- 36.Braakman I, Helenius J, Helenius A. The EMBO journal. 1992;11:1717–1722. doi: 10.1002/j.1460-2075.1992.tb05223.x. [DOI] [PMC free article] [PubMed] [Google Scholar]
- 37.Liu T, Qian WJ, Camp DG, 2nd, Smith RD. Methods in molecular biology. 2007;359:107–124. doi: 10.1007/978-1-59745-255-7_7. [DOI] [PMC free article] [PubMed] [Google Scholar]
- 38.Qian WJ, Liu T, Monroe ME, Strittmatter EF, Jacobs JM, Kangas LJ, Petritis K, Camp DG, 2nd, Smith RD. J Proteome Res. 2005;4:53–62. doi: 10.1021/pr0498638. [DOI] [PubMed] [Google Scholar]
- 39.Nakamura T, Tu S, Akhtar MW, Sunico CR, Okamoto S, Lipton SA. Neuron. 2013;78:596–614. doi: 10.1016/j.neuron.2013.05.005. [DOI] [PMC free article] [PubMed] [Google Scholar]
- 40.Nakamura T, Lipton SA. Antioxidants & redox signaling. 2011;14:1479–1492. doi: 10.1089/ars.2010.3570. [DOI] [PMC free article] [PubMed] [Google Scholar]
- 41.Murphy JP, Stepanova E, Everley RA, Paulo JA, Gygi SP. Molecular & Cellular Proteomics. 2015;14:2454–2465. doi: 10.1074/mcp.M114.045849. [DOI] [PMC free article] [PubMed] [Google Scholar]
- 42.Nelson KJ, Knutson ST, Soito L, Klomsiri C, Poole LB, Fetrow JS. Proteins. 2011;79:947–964. doi: 10.1002/prot.22936. [DOI] [PMC free article] [PubMed] [Google Scholar]
- 43.Gould N, Doulias PT, Tenopoulou M, Raju K, Ischiropoulos H. The Journal of biological chemistry. 2013;288:26473–26479. doi: 10.1074/jbc.R113.460261. [DOI] [PMC free article] [PubMed] [Google Scholar]
- 44.Cho DH, Nakamura T, Fang J, Cieplak P, Godzik A, Gu Z, Lipton SA. Science. 2009;324:102–105. doi: 10.1126/science.1171091. [DOI] [PMC free article] [PubMed] [Google Scholar]
- 45.Doulias PT, Tenopoulou M, Greene JL, Raju K, Ischiropoulos H. Science signaling. 2013;6 doi: 10.1126/scisignal.2003252. [DOI] [PMC free article] [PubMed] [Google Scholar]
- 46.Kohr MJ, Aponte AM, Sun JH, Wang GH, Murphy E, Gucek M, Steenbergen C. Am J Physiol-Heart C. 2011;300:H1327–H1335. doi: 10.1152/ajpheart.00997.2010. [DOI] [PMC free article] [PubMed] [Google Scholar]
- 47.Kuntzelmann A, Guenther T, Haberkorn U, Essig M, Giesel F, Henze R, Schroeter ML, Schroder J, Schonknecht P. Neurosci Lett. 2013;534:12–17. doi: 10.1016/j.neulet.2012.11.026. [DOI] [PubMed] [Google Scholar]
- 48.Garcia-Santamarina S, Boronat S, Espadas G, Ayte J, Molina H, Hidalgo E. Journal of proteomics. 2011;74:2476–2486. doi: 10.1016/j.jprot.2011.05.030. [DOI] [PubMed] [Google Scholar]
- 49.Giron P, Dayon L, Sanchez JC. Mass spectrometry reviews. 2011;30:366–395. doi: 10.1002/mas.20285. [DOI] [PubMed] [Google Scholar]
- 50.Chen D, Shah A, Nguyen H, Loo D, Inder KL, Hill MM. J Proteome Res. 2014;13:4184–4191. doi: 10.1021/pr500525e. [DOI] [PubMed] [Google Scholar]
- 51.Foote M, Zhou Y. International journal of biochemistry and molecular biology. 2012;3:152–164. [PMC free article] [PubMed] [Google Scholar]
- 52.Repalli J. Current aging science. 2014;7:168–175. doi: 10.2174/1874609808666141210103146. [DOI] [PMC free article] [PubMed] [Google Scholar]
- 53.Hooff GP, Wood WG, Muller WE, Eckert GP. Bba-Mol Cell Biol L. 2010;1801:896–905. doi: 10.1016/j.bbalip.2010.03.014. [DOI] [PMC free article] [PubMed] [Google Scholar]
Associated Data
This section collects any data citations, data availability statements, or supplementary materials included in this article.