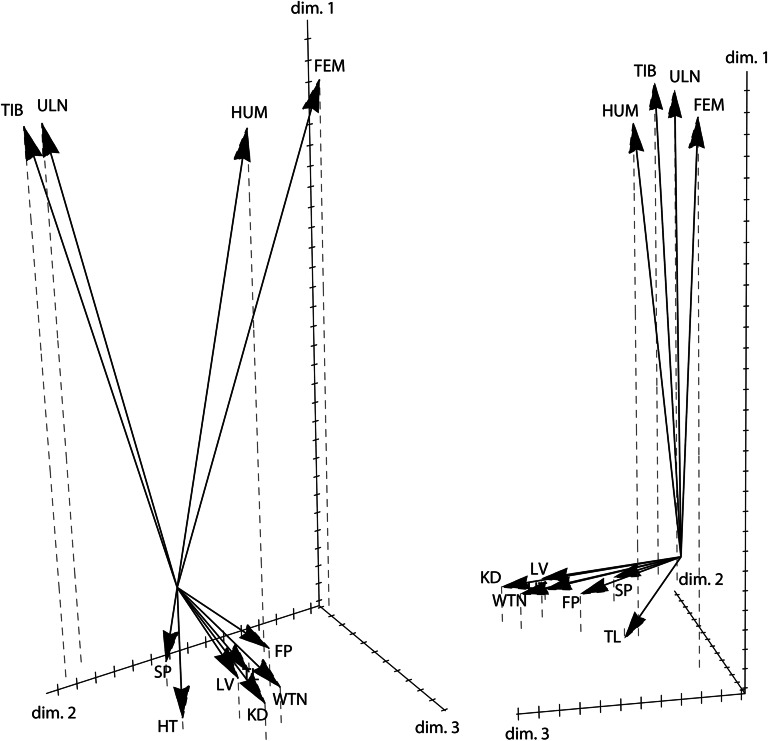
Figure 5.
Two different projections of the three-dimensional phenotype space resulting from the first three scaled phenotypic coefficient vectors (). For approach ii applied here—the maximization of genetic variance—the squared length of the vectors approximates the genetic variance of the corresponding phenotypic variable, and the cosine of the angle between the vectors approximates their genetic correlation. Clustering of phenotypic variables in this diagram thus indicates shared genetic control.

