Abstract
A detailed understanding of chemical and biological function and the mechanisms underlying the molecular activities ultimately requires atomic-resolution structural data. Diffraction-based techniques such as single-crystal X-ray crystallography, electron microscopy, and neutron diffraction are well established and they have paved the road to the stunning successes of modern-day structural biology. The major advances achieved in the last 20 years in all aspects of structural research, including sample preparation, crystallization, the construction of synchrotron and spallation sources, phasing approaches, and high-speed computing and visualization, now provide specialists and nonspecialists alike with a steady flow of molecular images of unprecedented detail. The present unit combines a general overview of diffraction methods with a detailed description of the process of a single-crystal X-ray structure determination experiment, from chemical synthesis or expression to phasing and refinement, analysis, and quality control. For novices it may serve as a stepping-stone to more in-depth treatises of the individual topics. Readers relying on structural information for interpreting functional data may find it a useful consumer guide.
Keywords: structural biology, diffraction, crystallization, electron microscopy, neutron scattering, X-ray crystallography
INTRODUCTION
There are numerous approaches that furnish insight into the conformational properties of biopolymers such as proteins and nucleic acids. Among these, diffraction-based techniques occupy a unique place due to the atomic-resolution picture that they can reveal. Thus, provided a single crystal of a receptor, virus, or RNA diffracts X-rays to very high resolution, conformation, molecular interactions, and water structure can be visualized in stunning detail. Selected examples of successes in the crystallographic structure determination of macromolecular assemblies, receptors, molecular machines, and viruses are depicted in Figure 7.13.1.
Figure 7.13.1.
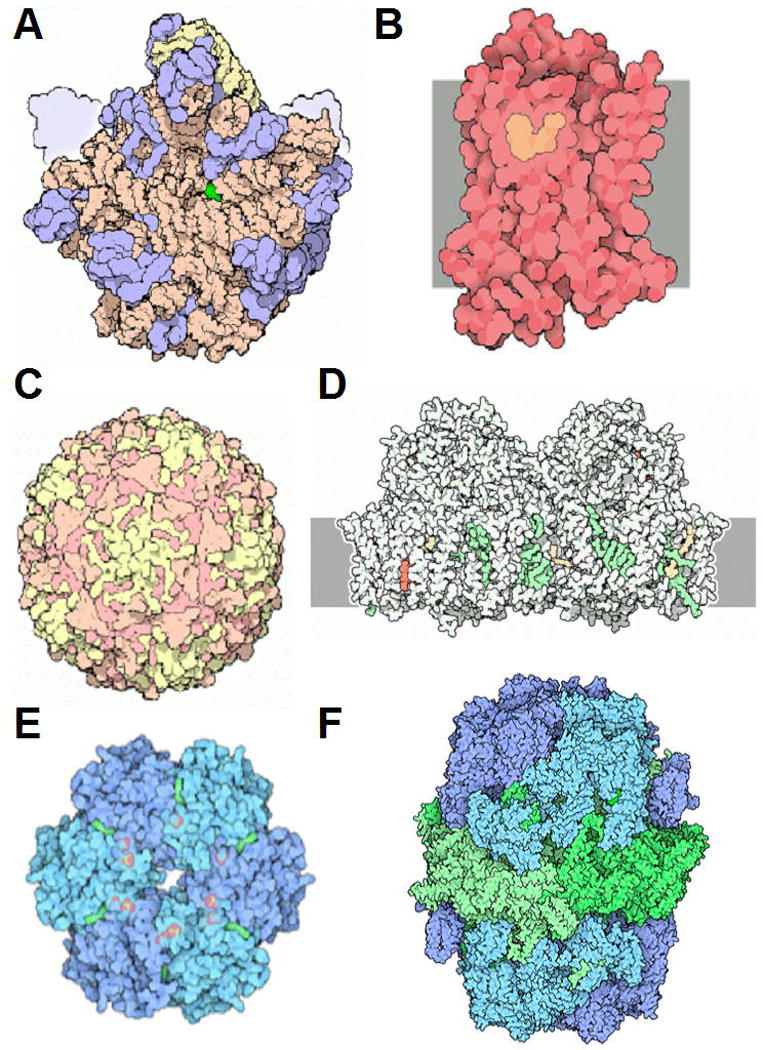
Recent triumphs of structural biology. (A) The ribosome (large subunit; PDB entry code 1ffk); (B) Adrenergic receptor (GPCR; PDB entry code 2rh1); (C) Poliovirus (PDB entry code 2plv); (D) Photosystem II (PDB entry code 1s5l); (E) Cyanobacterial master clock protein KaiC (PDB entry code 2gbl); (F) Fatty acid synthase (PDB entry codes 2uvb and 2uvc). Reproduced from Molecule of the Month Illustrations (info@rcsb.org; http://www.rcsb.org/pdb/static.do?p=education_discussion/molecule_of_the_month/index.html) by David S. Goodsell with permission from RCSB Protein Data Bank (PDB).
In the last 15 years, we have witnessed an unprecedented increase in the number of new crystal structures. Online databases such as the Research Collaboratory for Structural Biology/Protein Data Bank (RCSB/PDB; http://www.rcsb.org; 115,764 structures as of February, 9, 2016; Berman et al., 2000; Rose et al., 2015) and the Nucleic Acid Database (NDB; http://ndbserver.rutgers.edu; 7,977 structures deposited as of February 3, 2016; Berman et al., 1992; Narayanan et al., 2013) now boast large numbers of entries. The number of new PDB entries per year has reached almost 10,000 in the past three years. Indeed, with the advent of structural genomics, the old adage that structure determination is preceded by a thorough understanding of function has given way to structure-driven initiatives that promise insights into function from structure, i.e. the Protein Structure Initiative (PSI) funded by the U.S. National Institutes of Health https://www.nigms.nih.gov/Research/specificareas/PSI/Pages/default.aspx (Chandonia and Brenner, 2006; Terwilliger et al., 2009), and offshoots such as the PSI Structural Biology Knowledgebase (http://www.sbkb.org) (Gabanyi et al., 2011).
For some 100 hundred years (Wilkins, 2013), starting with the first diffraction image of zinc blende taken by Friedrich, Knipping and von Laue (Friedrich et al., 1912) and the interpretation of its structure by Bragg (Bragg, 1912), diffraction techniques have shaped our perception of the structure of condensed matter. An overview of the Nobel prizes awarded to scientists behind discoveries related to diffraction and their application to physics, chemistry, biology and medicine provides evidence for the wide-ranging scientific impact of diffraction phenomena (Fig. 7.13.2 and Table 7.13.1). The explosive growth in the number of crystal structures during the last years followed dramatic advances in practically all areas of X-ray crystallography, including crystallization (sparse matrix screens and robotics; Jancarik and Kim, 1991; Doudna et al., 1993; Scott et al., 1995; Berger et al., 1996; see CPNC UNIT 7.6), crystal handling (flash freezing; Garman and Owen, 2006), data collection and resolution (synchrotron sources and fast CCD detectors; Hendrickson, 2000), phasing (single- and multi-wavelength anomalous dispersion; Terwilliger and Berendzen, 1999; Weeks et al., 2003; Sheldrick, 2010), electron density map interpretation and model building (automatic chain tracing; CCP4, 1994; Abola et al., 2000; Emsley and Cowtan, 2004), and structure refinement (increased computer power, simulated annealing and maximum likelihood refinement; Murshudov et al., 1999; Brunger and Adams, 2002; Adams et al., 2010). It is now feasible to mount a protein crystal in the morning and end up with a preliminary, partially refined structure in the afternoon.
Figure 7.13.2.
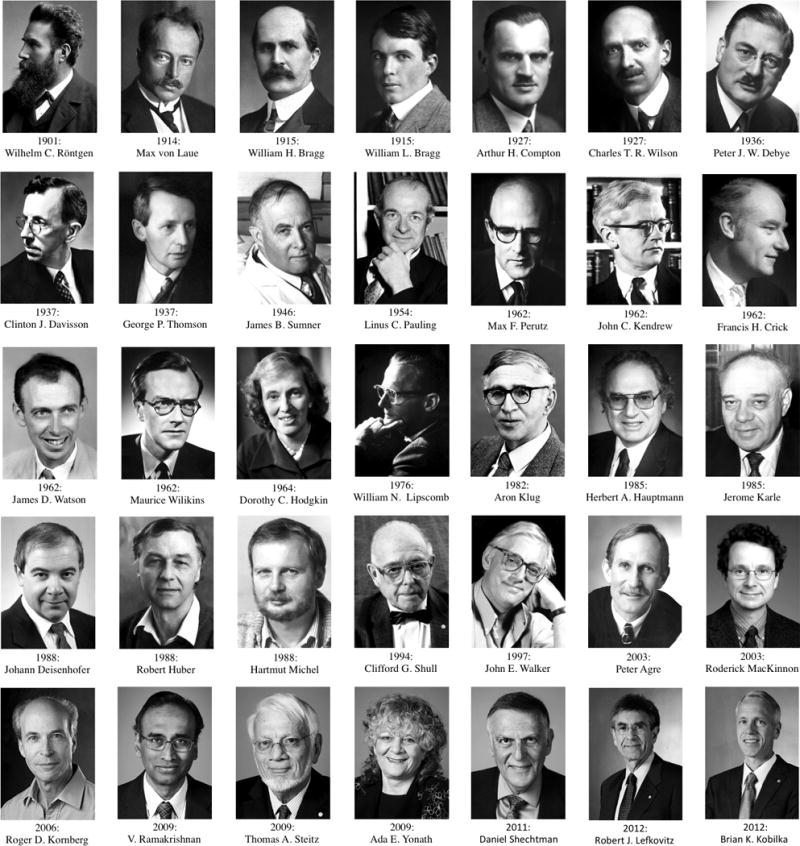
Nobel laureates in the fields of X-ray, neutron and electron diffraction, and diffraction-based structural chemistry and structural biology (http://www.nobelprize.org). Image courtesy of Prof. Angelo Vedani (University of Basel).
Table 7.13.1.
Nobel Prizes Related to Diffraction and Crystallography
| Year | Nobel laureate(s) | Field | Discovery |
|---|---|---|---|
| 1901 | Wilhelm C. Roentgen | Physics | Recognition of the extraordinary services he has rendered by the discovery of the remarkable rays subsequently named after him |
| 1914 | Max von Laue | Physics | Discovery of the diffraction of X-rays by crystals |
| 1915 | William H. Bragg and William L. Bragg | Physics | Their services in the analysis of crystal structure by means of X-rays |
| 1927 | Arthur H. Compton and Charles T. R. Wilson | Physics | Discovery of the effect named after him, method of making the paths of electrically charged particles visible by condensation of vapor |
| 1936 | Peter J. W. Debye | Chemistry | Contributions to our knowledge of molecular structure through his investigations on dipole moments and on the diffraction of X-rays and electrons in gases |
| 1937 | Clinton J. Davisson and George P. Thomson | Physics | Experimental discovery of the diffraction of electrons by crystals |
| 1946 | James B. Sumner | Chemistry | Discovery that enzymes can be crystallized |
| 1954 | Linus C. Pauling | Chemistry | Research into the nature of the chemical bond and its application to the elucidation of the structure of complex substances |
| 1962 | John Kendrew and Max Perutz | Chemistry | Studies of the structures of globular proteins |
| 1962 | James D. Watson, Francis H. C. Crick, and Maurice H. F. Wilkins | Medicine | Discoveries concerning the molecular structure of nucleic acids and its significance for information transfer in living material |
| 1964 | Dorothy Hodgkin | Chemistry | Determinations by X-ray techniques of the structures of important biochemical substances |
| 1976 | William N. Lipscomb | Chemistry | Studies on the structure of boranes illuminating problems of chemical bonding |
| 1982 | Aaron Klug | Chemistry | Development of crystallographic electron microscopy and his structural elucidation of biologically important nucleic acid-protein complexes |
| 1985 | Herbert A. Hauptman and Jerome Karle | Chemistry | Outstanding achievements in the development of direct methods for the determination of crystal structures |
| 1987 | Robert Huber, Johann Deisenhofer, and Hartmut Michel | Chemistry | Determination of the three-dimensional structure of a photosynthetic reaction center |
| 1994 | Clifford G. Shull | Physics | Development of the neutron diffraction technique |
| 1997 | John E. Walker | Chemistry | Three-dimensional structure of ATP synthase |
| 2003 | Peter Agre and Roderick MacKinnon | Chemistry | Discovery of water channels, structural and mechanistic studies of ion channels |
| 2006 | Roger D. Kornberg | Chemistry | Studies of the molecular basis of eukaryotic transcription |
| 2009 | Thomas A. Steitz, Venkatraman Ramakrishnan, and Ada E. Yonath | Chemistry | Studies of the structure and function of the ribosome |
| 2011 | Daniel Shechtman | Chemistry | Discovery of quasicrystals |
| 2012 | Robert J. Lefkowitz and Brian K. Kobilka | Chemistry | Studies of G-protein-coupled receptors |
The so-called X-ray free-electron laser (FEL) constitutes the most exciting development in recent years in macromolecular crystallography and for structural biology in general (Chapman et al., 2011). Short femtosecond (fs) X-ray pulses of extreme brilliance, in combination with showers of nano- or microcrystals that consist of just a few dozen unit cells in some cases, yield diffraction data essentially before vaporizing the samples. Thus, nanocrystallography using FELs enables structural characterization of protein crystals that are beyond the reach of conventional crystallography and can also afford time-resolved analyses (molecular movies).
However, all these breakthroughs do not change the fact that crystallography can be a tedious business. Crystallization and phasing represent common bottlenecks on the way to a structure, and what is many times a straightforward exercise can become a make-or-break effort that lasts months or years in some cases. Although it is impossible a priori to identify problem cases, empirical evidence exists supporting the notions that membrane proteins are hard to crystallize, that sampling proteins from various organisms increases the chances of obtaining diffraction-quality crystals, and that derivatization and phasing approaches ideally suited for proteins in the 15- to 50-kDa range are frequently inadequate to crack the structures of large macromolecular assemblies. Particularly as far as the latter are concerned, electron microscopy (EM) represents a powerful approach for structure and function studies at the intermediate 5- to 30-Å resolution range. In favorable cases and with averaging of ≥1 million subunits, near-atomic resolution can be achieved (Fig. 7.13.3) (Baumeister and Steven, 2000; Zhou, 2008). Improvements in sample preparation and the advent of so-called direct detection cameras (that count electrons) now result in increasing numbers of cryo-EM structures with resolutions of 5 Å or higher, thus bridging the gap between the medium and atomic-resolution range (Binshtein and Ohi, 2015). Moreover, hybrid structural approaches (Schneidman-Duhovny et al., 2012), marrying EM and X-ray crystallography (Fig. 7.13.4) (Liu et al., 2010; Reddy et al., 2010), crystallography and solution NMR (Carlon et al., 2016), small angle X-ray scattering (SAXS (Burke and Butcher, 2012); see CPNC Unit 7.18.), EM and X-ray crystallography (Pattanayek et al., 2011), or other combinations of biophysical and structural techniques, are becoming ever more popular.
Figure 7.13.3.
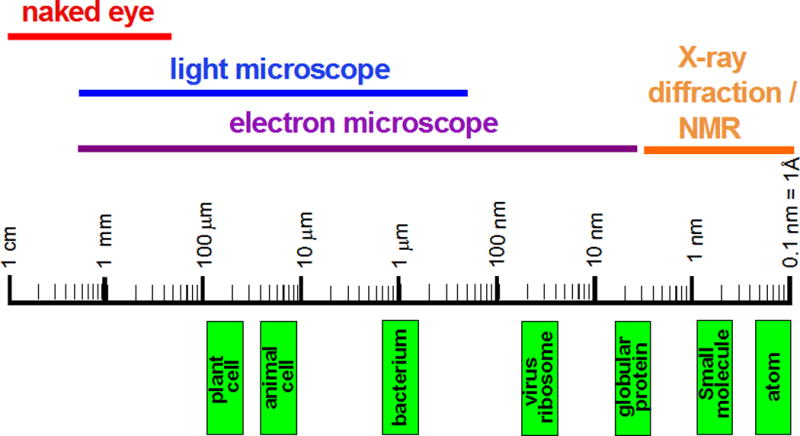
From the visible to the invisible. The diagram depicts the rough sizes of cells and their components on a logarithmic scale and illustrates the range of objects that can be visualized with different techniques.
Figure 7.13.4.
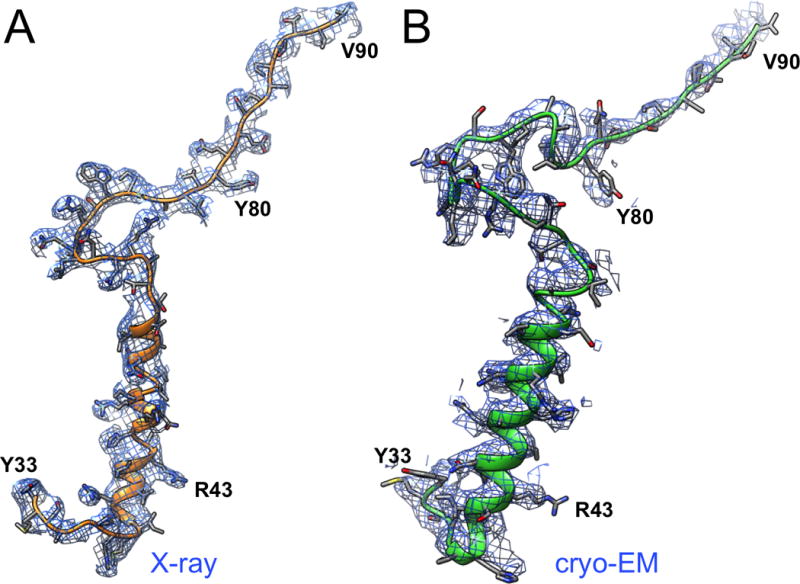
Comparison of adenovirus structures obtained by X-ray crystallography and cryo-EM at 3.5 Å resolution. (A) Structure and electron density of a segment of protein VIII obtained by X-ray crystallography (Reddy et al., 2010; Reddy and Nemerow, 2014). (B) The corresponding segment and electron density obtained by cryo-EM (Liu et al., 2010). Image courtesy of Prof. Vijay Reddy (The Scripps Research Institute).
This unit gives an overview of some of the major techniques in structural biology, particularly those that rely on diffraction, by briefly summarizing the benefits and limitations of individual methods and comparing them to each other. It will then describe in some detail the main stages of structure determinations by single-crystal X-ray crystallography, from crystallization to structure refinement, analysis, and quality control. It is by no means the intent of the author to provide an exhaustive account of the topic of X-ray diffraction and macromolecular structure determination (Rupp, 2010; Ennifar, 2015). The interested reader may turn to some of the additional reading material listed at the end of the unit for a more in-depth treatment of the individual topics touched upon in this brief review.
MAJOR TECHNIQUES IN STRUCTURAL BIOLOGY
The following methods are considered to be of primary importance for experimental, three-dimensional structure determination: X-ray crystallography, X-ray fiber diffraction, electron diffraction, electron microscopy, neutron diffraction, and nuclear magnetic resonance (NMR). There are additional techniques that can provide insight into the shape of macromolecules, such as, for example, SAXS (Putnam et al., 2007; Hura et al., 2013), fluorescence resonance energy transfer (FRET; Lilley and Wilson, 2000; Schuler and Eaton, 2008), electron paramagnetic resonance spectroscopy (EPR; Mchaourab et al., 2011; Romainczyk et al., 2012, see CPNC unit 7.17), and hydrogen-deuterium exchange in combination with mass spectrometry (HDX/MS; Konermann et al., 2011). Although these and others are very useful in combination with any of the above approaches and can also shed light on the dynamic behavior of molecular systems, they will not be considered further here.
A key difference between optical or electron microscopy and X-ray diffraction is that, unlike light or electron beams, X-rays cannot be focused (Fig. 7.13.5). The X-ray crystallographic visualization of a molecule requires a mathematical lens—Fourier transformation—that generates a 3D structure from the amplitudes of the scattered radiation (the structure factors) and the phases. The phase information is lost in the diffraction experiment, but several methods allow one to recover the phases and we will get back to the so-called phase problem in X-ray crystallography (see Phasing below).
Figure 7.13.5.
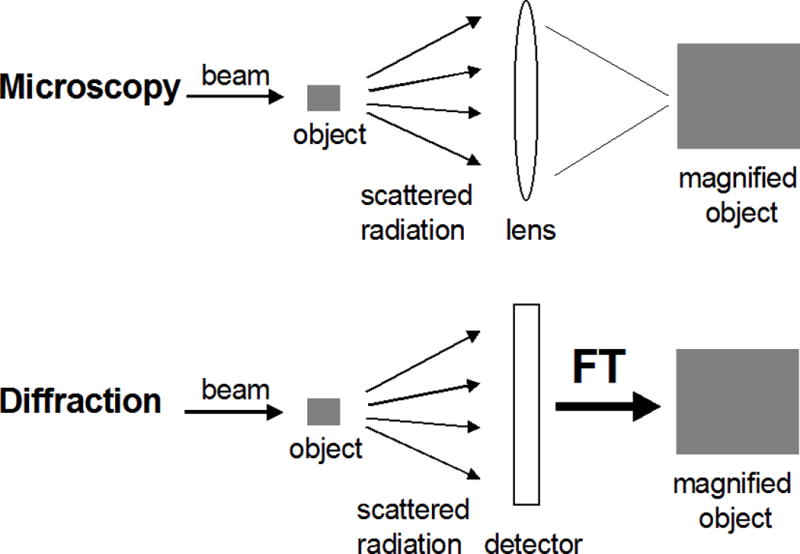
Light microscopy versus diffraction. Structure determination by X-ray diffraction entails the use of a mathematical lens, Fourier Transformation (FT), to “focus” the scattered radiation.
X-Ray Fiber Diffraction
Fiber diffraction can give key insights into the geometry of nucleic acids or fibrous proteins (i.e., collagen) and its golden era coincides with the discovery of the structure of DNA. Very long double-helical DNA molecules tend to be packed side by side in an ordered manner inside fibers. The helical structure gives rise to cross-shaped diffraction patterns with various separations between layer lines (Fig. 7.13.6). The spacing of layer lines is determined by the helical repeat, and as the repeat distance increases, the layer lines move closer together. The DNA diffraction pattern depicted in Figure 7.13.6 shows different numbers of spots, and the pattern from A-DNA indicates a higher degree of regularity in the packing arrangement of fibers (there are more spots). The B-form and A-form DNA duplexes differ in their helical repeats (34 and 28 Å, respectively). The larger separation of stacked bases along the helical direction in B-DNA compared with A-DNA can be deduced from the smaller separation of diffraction spots in the B-DNA fiber diffraction pattern. From the helical repeat and the inclination of the arms in the cross, it is possible to derive an approximate radius for the double helix. Moreover, the orientation of the dyad in the diffraction pattern allowed Watson and Crick to conclude that the two strands in the DNA duplex run in opposite directions. X-ray fiber diffraction is still used today but has gradually given way to single crystal studies (Tsuruta and Irving, 2008; Chandrasekaran and Stubbs, 2012; Potrzebowski and André, 2015). For further information and access to software for small-angle scattering and fiber-diffraction studies, please see these Web sites (http://www.ccp13.ac.uk or http://www.smallangle.org).
Figure 7.13.6.
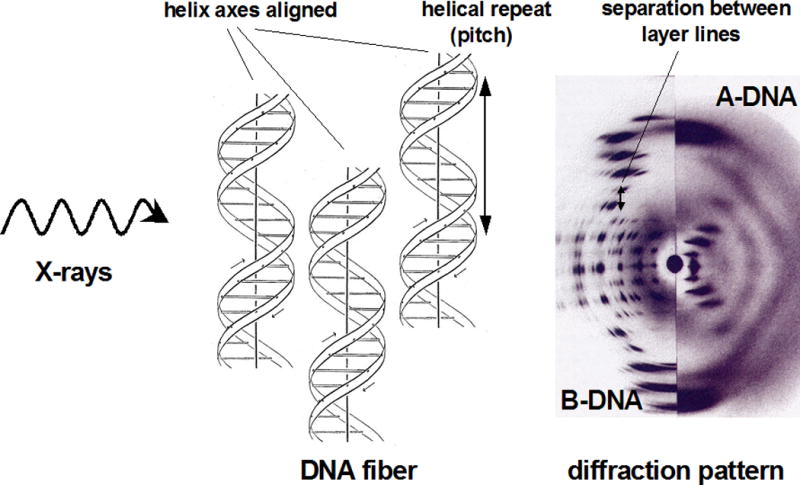
Principles of fiber diffraction. The diffraction pattern resulting from aligned helical structures in fibers exposed to X-rays exhibit characteristic cross-like shapes. The drawing of the DNA duplex was originally created by Odile Crick and is adapted from Kemp (2003) with permission from the Nature Publishing Group.
Electron Diffraction
In terms of the theoretical framework, electron diffraction is similar to X-ray diffraction. However, there are a number of differences that have a significant impact on the practical aspects. Electrons interact strongly with matter and cause serious radiation damage. Thus, the method is typically only applicable to thin layers (2D crystals). Therefore, electron diffraction is useful for certain membrane proteins that may easily form 2D but not 3D crystals. An electron’s wavelength decreases as its velocity increases; in a typical electron microscope the wavelength is around 0.04 Å and thus much lower than the X-ray wavelength used for single crystal diffraction experiments (1 to 2 Å). The damage to biological samples caused by the electron beam is such that the effective resolution is often reduced to 10 to 20 Å. For a recent successful application of micro-electron diffraction to visualize the structure of the 11-residue core fragment of α-synuclein protein that forms the key component of neuron-associated aggregates in neurodegenerative pathologies see (Rodriguez et al., 2015).
Electron Microscopy
Unlike with X-rays, electromagnetic lenses can be used with electrons to reconstruct the image as in a traditional light microscope. Hence, there is no phase problem. A comparison between a standard light microscope and transmission and scanning electron microscopes (TEM and SEM, respectively) is depicted in Figure 7.13.7. Samples for EM have to be carefully prepared: (i) they need to be exposed to high vacuum and therefore fixed with special chemicals or frozen; (ii) extremely thin sections are required, as electrons have limited penetrating power; and (iii) samples are often exposed to heavy metals (staining) because the contrast depends on the atomic number. In SEM, the specimen is dried and coated with a thin layer of heavy metal. The technique allows visualization of secondary electrons that are scattered or emitted from the specimen surface. SEM provides great depth of focus but only surface features can be examined and the resolution is not very high (around 100 Å). An example of an SEM image is shown in Figure 7.13.8.
Figure 7.13.7.
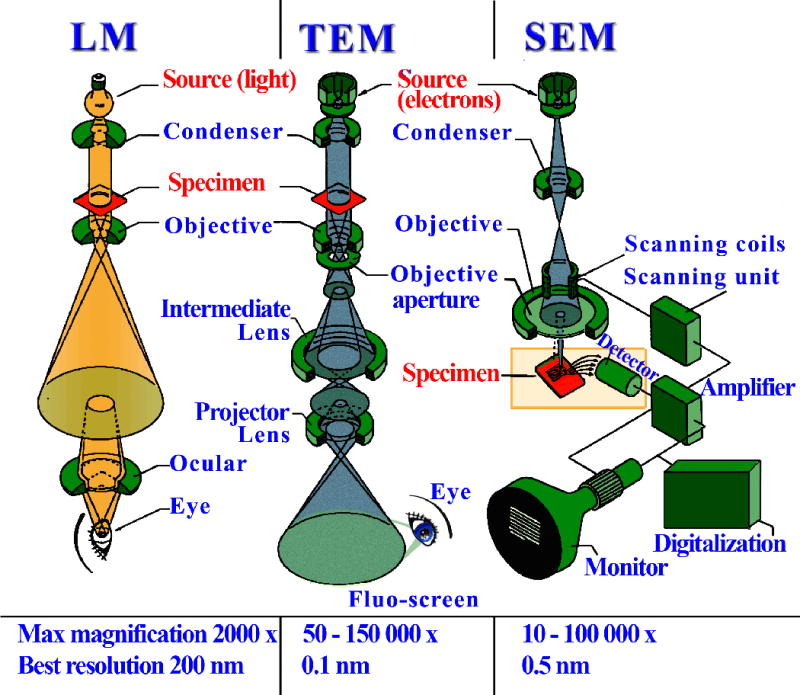
Light microscopy versus electron microscopy. Lenses allow reconstruction of the image in both techniques, but to focus electron beams electromagnetic lenses are required. Standard light microscope (LM, left), transmission electron microscope (TEM, center), and scanning electron microscope (SEM, right). Source: http://www.vcbio.science.ru.nl/images/fesem_beam_zoom.jpg. Original illustration: Jeol Instruments. Redrawn by vcbio.science.ru.nl, Radboud University Nijmegen. Used with permission.
Figure 7.13.8.
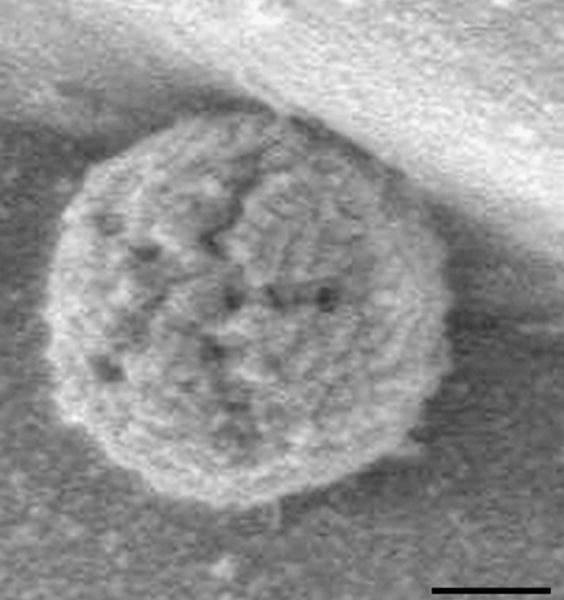
Example of an SEM image. The star-shaped structure in a mature extracellular Acanthamoeba polyphaga mimivirus, an icosahedral double-stranded DNA virus. The scale bar measures 200 nm. Reproduced from Zauberman et al. (2008).
TEM uses electrons that have passed through a specimen to form an image. Specimens are usually fixed, embedded, sectioned, and stained with an electron-dense material. Various techniques can be differentiated, one of them being metal shadowing that allows visualization of surface structures or cell components. Another technique is freeze fracture or freeze etch, used for studying membranes and the cell interior. Finally, negative staining and cryo-electron microscopy (Fig. 7.13.9) can be applied to unfixed biological samples. Thus, these techniques are useful to visualize large macromolecular assemblies such as viruses or ribosomes.
Figure 7.13.9.
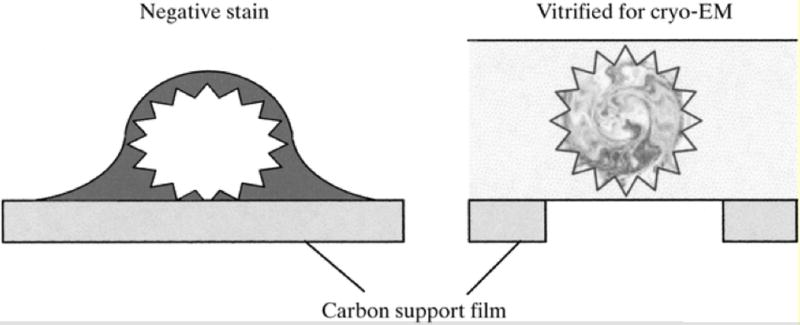
Negative-stain and cryo-EM. Left: A virus particle is outlined with good contrast by heavy-metal stain but is somewhat flattened due to dehydration. Right: By comparison, it is preserved in the native state in the cryo-EM sample, but the protein-ice contrast is very low. The particle is therefore imaged over holes in the carbon support to maximize the contrast. Reprinted from Saibil (2000) with permission from the International Union of Crystallography.
A single protein molecule gives only a weak and ill-defined image in the electron microscope. Increasing the signal by using higher intensity beams or longer exposure only increases the radiation damage. Therefore, it is necessary to combine the information from many molecules so as to average out random errors in the single images. This is more easily achieved when the molecule or particle features high symmetry, a key property of many viruses (Chiu et al., 1997). It is possible to apply averaging techniques and reconstruction analysis also to nonsymmetric molecules (Saibil, 2000). Images of randomly oriented molecules are collected and classes of similar particles are generated (Fig. 7.13.10). Angles are then assigned to each class and a 3D averaging procedure is carried out. The process can be further refined by projecting the image obtained, and using the projections to break the original classes into smaller ones and then assigning more precise angles (Fig. 7.13.11).
Figure 7.13.10.
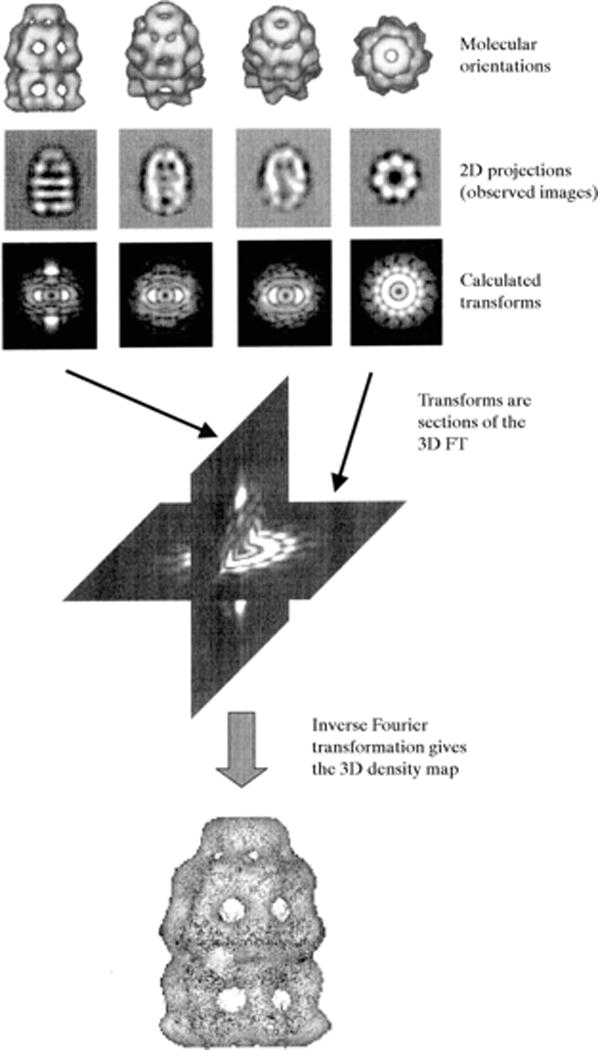
Single-particle EM 3D-reconstruction from 2D-projections. A set of 2D-projections (four in this case) is depicted along rendered iso-surfaces. The Fourier transform of a 2D-projection is equivalent to a central section in the 3D-FT of a molecule. Once a sufficient number of sections are available, the complete 3D-transform can be generated and inverse-transformed into a 3D-density map (bottom). Reprinted from Saibil (2000) with permission from the International Union of Crystallography.
Figure 7.13.11.
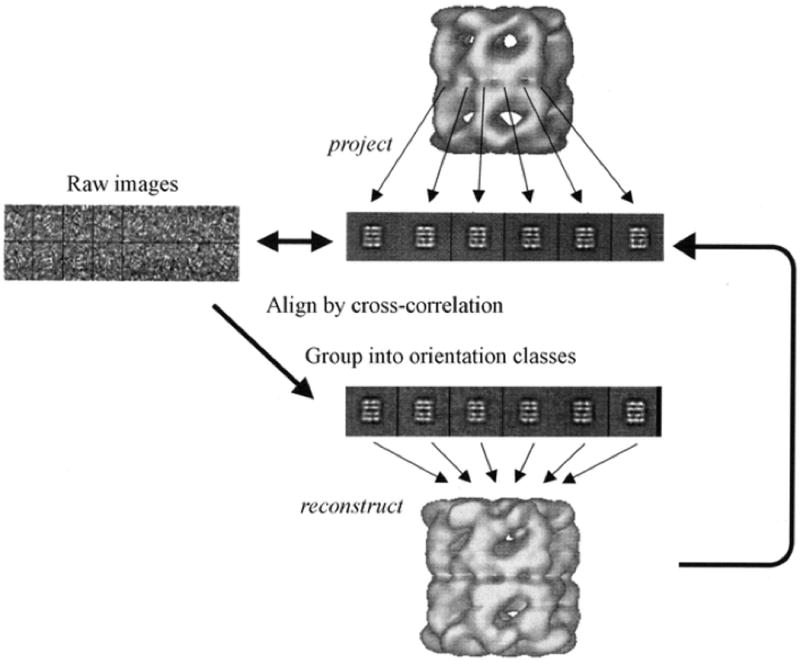
Refinement by projection matching. Reference images are created by projecting a 3D-map into a set of different orientations (center). Each raw image from the data set (left) is then rotationally and translationally aligned to individual reference images and given the orientation with the highest correlation coefficient. Images aligned in this fashion are grouped and averaged once again to create an improved 3D map (bottom). Reprinted with permission from Saibil (2000) with permission from the International Union of Crystallography.
In favorable cases and facilitated by improvements in preparation techniques, such as cross-linking (Southworth and Agard, 2011), and direct (electron) detection cameras (Binshtein and Ohi, 2015), cryo-EM can reach near-atomic resolution (Fig. 7.13.4), and if more detailed structures of components of a particle are available from X-ray crystallography or solution NMR, these can be built into the cryo-EM molecular envelope (Zhou, 2008; Fig. 7.13.12). Therefore, EM and X-ray crystallography are complementary techniques (Liu et al., 2010; Reddy et al., 2010). When considering the structures of typical single protein or enzyme-ligand complexes in the 20–150 kDa molecular weight range, crystallography still delivers far more detailed information. Nevertheless, EM is an extremely useful technique for studying macromolecule assemblies that are difficult to crystallize or in cases where the production of large amounts of materials is problematic. A more detailed comparison of the similarities and differences between EM and X-ray crystallography is provided in Table 7.13.2.
Figure 7.13.12.
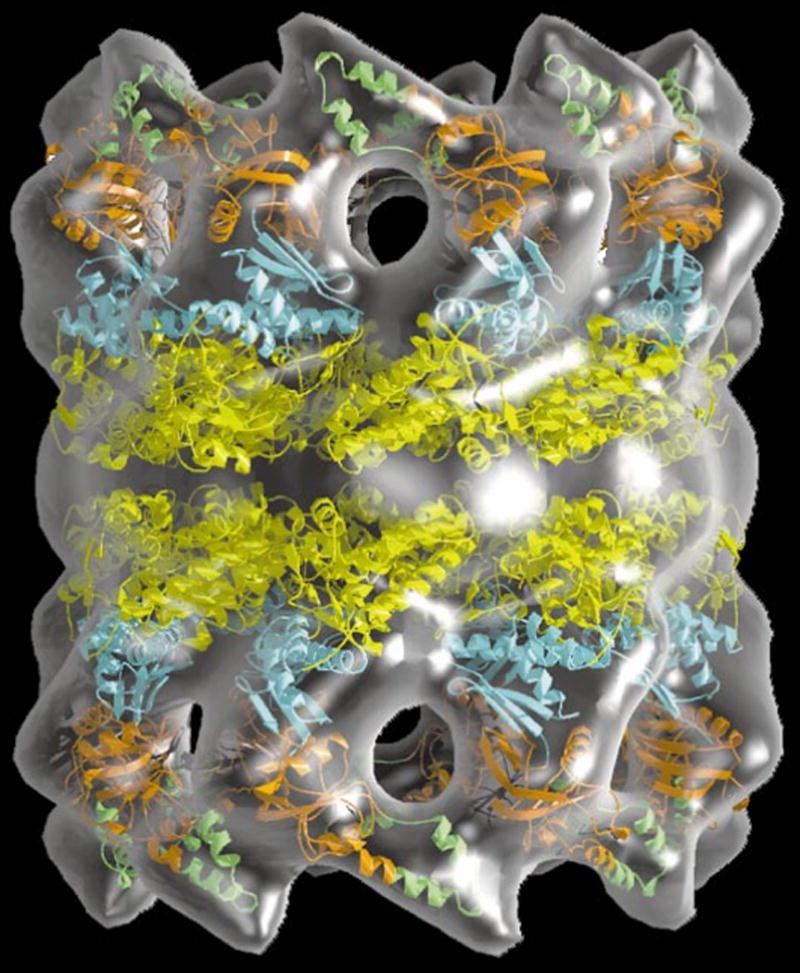
3D model of the archaeal thermosome holoenzyme. Crystal structures of the subunits (in color) are modeled into the EM-molecular envelope of the hexadecameric chaperone. Reprinted from Baumeister and Steven (2000) with permission from Elsevier.
Table 7.13.2.
Electron Microscopy versus X-Ray Crystallography
| Variable | EM | Crystallography |
|---|---|---|
| Sample size | Relatively low amounts of material needed | Milligram quantities required |
| Crystals | No need for single crystals | Crystallization constitutes a bottleneck on the way to structure determination |
| Molecular size | Typically applied to large-size macromolecules or assemblies, (>300 kDa), but the technique has been successfully applied to a 78-kDa DNA nanostructure (Kato et al., 2009) | No intrinsic size limitation (structures up to the MDa size range have been determined); however, large molecules can be difficult to crystallize |
| Resolution | Typically 10 Å or less; but near-atomic resolution is possible (Zhou, 2008; Liu et al., 2010, Binshtein and Ohi, 2015; Rodriguez et al., 2015), and the number of cryo-EM structures with resolutions of 5 Å and higher is steadily increasing | Near-atomic resolution can be achieved even with very large molecules, permitting detailed insights into recognition and mechanistic aspects |
Neutron Diffraction
A fundamental difference between diffraction of X-rays (photons) and neutrons is that the former are scattered by electrons and the latter by protons. Neutrons are highly penetrating and unlike X-rays they are nondestructive, and crystals of macromolecules do not decay in neutron beams even after lengthy exposure times. X-rays are typically blind to hydrogen atoms in crystals of macromolecules, unless diffraction data are available to extremely high resolution (≪1 Å). Even in those cases, the hydrogen atoms of water molecules in well-ordered solvent networks (first and second shell hydration) normally remain invisible.
The atomic form factor f in X-ray scattering (a measure of the scattering intensity of a wave by an isolated atom) is replaced by the scattering length b in neutron diffraction. The scattering length varies randomly across the periodic table and its magnitude can differ significantly even with isotopes of the same element, as in the case of hydrogen (1H) and deuterium (2H). The atomic form factors (f≡Z) and scattering lengths (unit 10−15 m, fm) for selected elements and isotopes are: hydrogen (f = 1; b = −3.8), deuterium (f = 1; b = 6.5), carbon (f = 6, b = 6.6), nitrogen (f = 7, b = 9.4), oxygen (f = 8, b = 5.8), sulfur (f = 16, b = 3.1), and iron (f = 26, b = 9.6). For a full list, please see http://www.ncnr.nist.gov/resources/n-lengths). Thus, deuterium and carbon exhibit very similar scattering lengths and the light element can be observed in the presence of the heavier carbon, oxygen, nitrogen, and sulfur atoms (Fig. 7.13.13). Deuterium also displays much weaker incoherent scattering than hydrogen. Therefore, visualization of the positions of hydrogen atoms in neutron crystallographic experiments requires perdeuteration of proteins.
Figure 7.13.13.
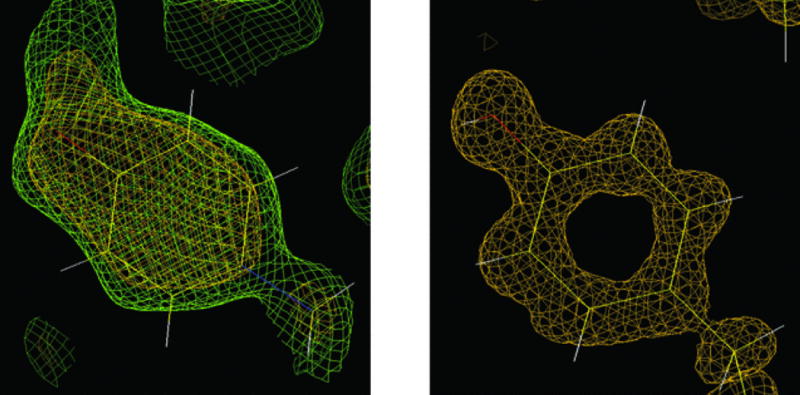
Neutron versus X-ray macromolecular crystallography. Left: The neutron density for Tyr137 in the structure of D-xylose isomerase contoured at 1.5σ (green) and 2.0σ (yellow) clearly reveals the orientation of the deuteron on the O atom of tyrosine. Right: The protonation state of Tyr254 remains unclear from electron density maps in the X-ray crystal structure of the same enzyme determined to 0.94-Å resolution at −170°C. Reprinted from Hanson et al. (2004) with permission from the International Union of Crystallography.
There are a number of advantages of neutron macromolecular crystallography (NMC) for structural biology (Blakeley et al., 2008). The positions of hydrogen atoms can be located even at resolutions of around 2 Å. Thus, NMC is complementary to ultrahigh resolution X-ray macromolecular crystallography (XMC) (Afonine et al., 2010; Fenn et al., 2011). The protonation and ionization states of atoms can be determined, thus yielding atomic charges and pKas (Leal et al., 2010; Casadei et al., 2014). Insights can be gained into hydrogen-bonding pattern because NMC allows one to determine the orientation of hydroxyl and amide groups (Hanson et al., 2004). Similarly, the conformations of methyl groups and side chains can be established in neutron density maps, thus providing details on packing arrangements. Because it is possible to observe hydrogen atoms in neutron structures, the orientations of water molecules can be determined, effectively revealing donor and acceptor patterns in water networks (Arai et al., 2005; Chatake et al., 2005). This will contribute to a better understanding of the role of water molecules at active sites and the effects on conformation and stability of solvation shells. Further advantages of NMC concern the monitoring of hydrogen/deuterium (H/D) exchange, permitting insight into solvent accessibility, dynamics, and folding patterns. Finally, NMC allows one to discriminate between metals at active sites due to unique neutron scattering cross-sections, i.e., Mn(25) = −3.6 fm, Fe(26) = 9.5 fm, and Zn(30) = 5.6 fm.
More widespread applications of NMC have traditionally suffered from the high cost of the instrumentation required (either a nuclear reactor or a spallation neutron source, SNS; the complexity and cost of neutron detectors also exceed by far those of state-of-the-art X-ray CCDs) and the need for large crystals (~1 mm3). However, the availability of SNSs in Europe, Japan, and the USA (Fig. 7.13.14) that produce high-intensity beams has sparked a renewed interest in applications of neutron scattering and promises a renaissance of NMC. The design criteria for the Macromolecular Neutron Diffractometer (MaNDi) on the SNS at Oak Ridge National Laboratory (ORNL, Oak Ridge, Tennessee, USA) anticipate resolution limits of between 1.5 and 2.0 Å for crystals with a lattice constant of up to 150 Å (2.5 to 3.0 Å for constants of 150 to 300 Å). Moreover, the time spent to collect data from a crystal with a volume of 0.125 mm3 and unit cell constants of maximum 100 Å is expected to be 24 hr for a resolution of ~2 Å (Coates et al., 2010).
Figure 7.13.14.
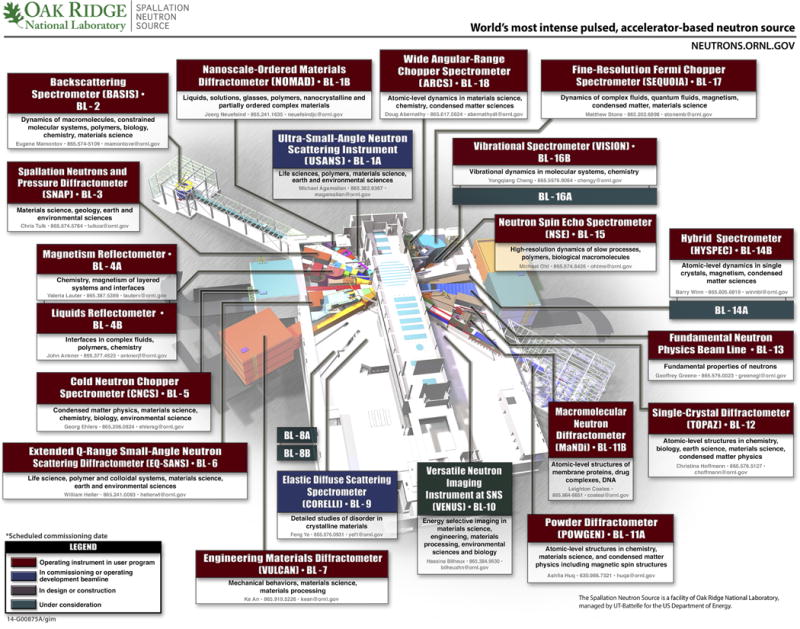
The Spallation Neutron Source (SNS) at Oak Ridge National Laboratory (ORNL, Oak Ridge, Tennessee, USA). The SNS instrument hall will eventually contain 24 instruments on 18 beam lines. The Macromolecular Neutron Diffractometer (MaNDi, BL-11B) and the Single-Crystal Diffractometer (TOPAZ, BL-12) are of particular interest for neutron macromolecular crystallography research. Source: http://neutrons.ornl.gov/instruments; please visit the original Web site and click on the individual boxes for details of the instrument layout and capabilities.
Nuclear Magnetic Resonance Spectroscopy
Certain nuclei, such as for example 1H, 13C, 15N, and 31P possess an angular momentum. The energy levels associated with nuclei of different spin angular momentums can be separated in high magnetic fields. The spin will align along the field and absorption of electromagnetic radiation of the appropriate frequency (radio waves) then induce a transition. When the nuclei revert to their equilibrium state, they emit radiation that can be measured. Most importantly, the precise frequency of the emitted radiation is dependent on the environment of the individual nuclei. These different frequencies are referred to as chemical shifts. NMR spectra are further complicated by scalar coupling between neighboring nuclei that is apparent from the splitting of individual signals (Fig. 7.13.15; Keeler, 2011).
Figure 7.13.15.
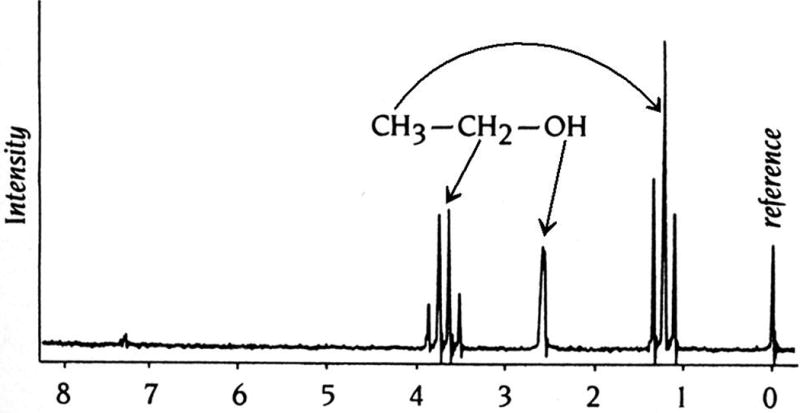
One-dimensional 1H-NMR spectrum of ethanol. The three groups of protons in this small molecule, (C)H3, (C)H2, and (O)H, all exhibit different chemical shifts relative to the protons in reference molecule, tetramethylsilane (TMS). The characteristic splitting of the signals arising from the methyl (1:2:1) and methylene (1:3:3:1) protons is the result of through-bond coupling between neighboring nuclei.
Protein NMR spectra contain a large number of overlapping peaks, and it is impossible to interpret a one-dimensional (1D) spectrum. However, it is possible to design 2D NMR experiments and to plot the results into a xy-diagram, i.e., a so-called 2D homonuclear COSY (correlation spectroscopy) experiment. In this 2D representation, the diagonal corresponds to the common 1D spectrum. Off-diagonal peaks arise from the interactions between hydrogen atoms that are relatively closely spaced. Another common type of NMR experiment with proteins concerns the heteronuclear single quantum correlation (HSQC), i.e., between the nitrogen atom of an NHx group with the attached proton. Therefore, each signal in a 15N-HSQC spectrum represents a signal from a single amino acid. In addition to the signals from the HN protons in the backbone, the HSQC spectrum also contains signals from the amino groups of the side chains of Asn and Gln and the aromatic N-H groups in the His and Trp side chains. However, unlike a 2D homonuclear spectrum, a heteronuclear 13C- or 15N-HSQC spectrum does not contain a diagonal (Fig. 7.13.16; Wüthrich, 1986).
Figure 7.13.16.
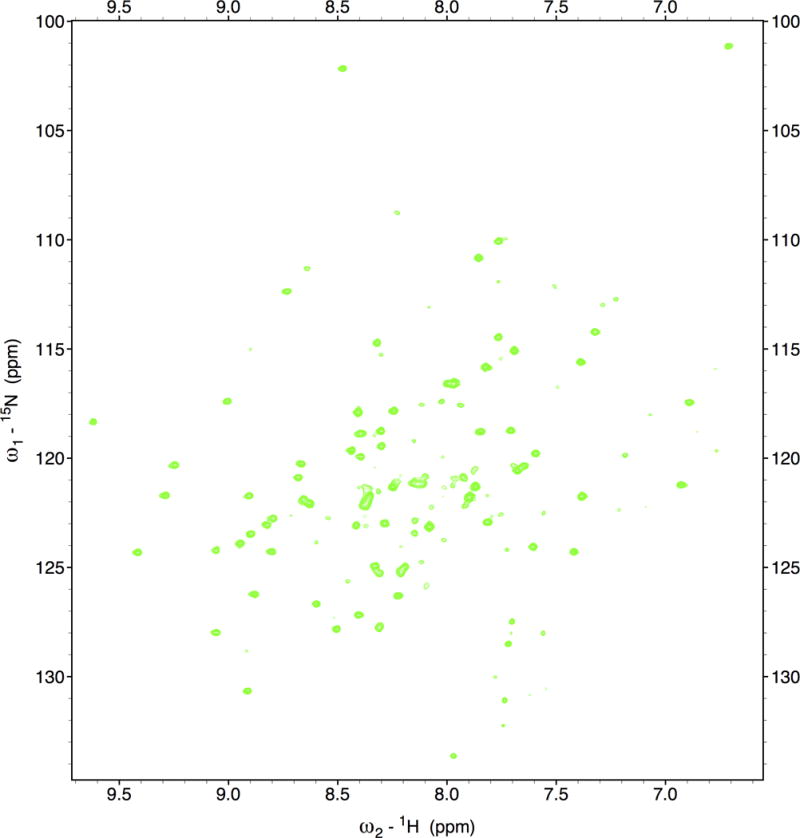
Two-dimensional heteronuclear NMR spectroscopy. 15N-HSQC spectrum of the circadian clock protein KaiB from the cyanobacterium Synechococcus elongatus recorded on an 800-MHz spectrometer.
Relaxation processes are very sensitive to both geometry and motion, but only interactions between atoms that are <5 Å apart can typically be detected. Therefore, NMR spectroscopy allows us to map the distances between pairs of atoms by specifying which pairs are close together in space, NMR spectra contain information about the 3D structure of protein molecules. In reality, it is far from trivial to assign the peaks in a spectrum to a specific H atom in the protein sequence. Kurt Wüthrich worked out a solution to the assignment problem in the 1980s and he was co-awarded the 2002 Nobel Prize in Chemistry for the development of NMR spectroscopy for determining the 3D structure of biological macromolecules in solution. Both solution NMR and X-ray crystallography provide insight into the 3D structures of macromolecules. In many ways, the two techniques are complementary, with the most significant limitation of NMR and crystallography being size (<40 kDa) and the need for single crystals, respectively, and a distinct advantage of NMR being the ability to gain insight into dynamic processes, e.g. base pair opening kinetics in DNA (Szulik et al. 2014; see CPNC UNIT 7.20). A more detailed comparison of these two key techniques in structural biology is provided in Table 7.13.3.
Table 7.13.3.
X-Ray Crystallography versus Solution NMR Spectroscopy
| Variable | X-ray crystallography | NMR spectroscopy |
|---|---|---|
| Amount and purity of material (30-kDa protein) | 10–50 mg, very pure, stable at room temperature | 10–20 mg, 95% pure, stable at room temperature; if >10 kDa must be labeled with 15N and/or 13C |
| Studied sample | Crystals with high content of non-crystalline solvent, (~50% protein) | ~1 mM protein in solution, (~1% protein) |
| Physiological relevance | Artifacts due to crystal packing forces | Artifacts due to use of isolated fragments or domains |
| Experimental variations of sample conditions | Very difficult, crystallization conditions have to be maintained | Straightforward, can change temperature, pH, and others |
| Size limitations | Virtually none (40-MDa structures determined) | ~50 kDa at present (40-kDa structures solved) |
| Meaning of the single data point | None: one spot has contributions from the whole unit cell | Single inter-atomic interactions interpreted as distance or angle constraint |
| Meaning of all data points | After FT with proper phases, direct definition of the electron density within one unit cell | All observable inter-atomic interactions interpreted as distances and torsion angles |
| Interpretation of experimental data | Relatively quantitative | Relatively qualitative |
| Most time consuming | Varies: crystallization, phase generation, model building | Resonance assignments |
| Final result | One model that minimizes R factor; model variations and uncertainties “hidden” in B values | Many models (ensemble) satisfying constraints; variations explicit in multiple models |
| Use of stereo-chemical constraints | Necessary (exception: ultra-high resolution data available) | Necessary |
| Classes of proteins amenable to study | Stable tertiary structure (fold) throughout most of the polypeptide; non-aggregating | Folded and unfolded regions can occur; non-aggregating |
| Observation of dynamic processes | Very difficult, but in principle enzyme reactions can be followed in crystals | Very straightforward |
| Measure of accuracy | Biochemical data, threading calculation, φ–ψ plots (potential energy) | Biochemical data, threading calculation, φ–ψ plots (potential energy) |
| Measure of precision | Resolution, R factors, rms deviations from standard bond lengths and angles | Average root-mean-square deviation (rmsd) among structures in calculated family |
| Comparable resolution | 2 Å resolution, R factor <25% | rmsd <1.0 Å for most of the polypeptide length |
SINGLE CRYSTAL X-RAY CRYSTALLOGRAPHY
Overview
The following sections are dedicated to arguably the most powerful “weapon” in the structural biology arsenal: X-ray crystallography. This technique can provide more detailed models than any of the other approaches available to study macromolecules. In principle, there is no limitation as far as size is concerned: the basic principles remain the same independently of whether one is working out the structure of an oligonucleotide with a molecular weight of a few kDa or that of a virus a thousand times larger. Individual steps of a structure determination are outlined in Figure 7.13.17. Among them, crystallization and phasing constitute the biggest hurdles. Despite the fact that impressive advances have been made in recent years to increase the chances of obtaining protein or nucleic acid crystals, crystallization has remained a trial-and-error approach that frequently fails when only a single construct is available. It can easily escalate into a potentially costly and time-consuming battle when various constructs and/or homologous proteins from different organisms are screened (McPherson, 1998; Ducruix and Giegé, 1999; Doublié, 2007a; Ennifar, 2015). However, the end—be it a detailed 3-dimensional model of an enzyme, receptor, RNA, or protein-DNA complex and the biological insights gained from it—generally justifies the means.
Figure 7.13.17.
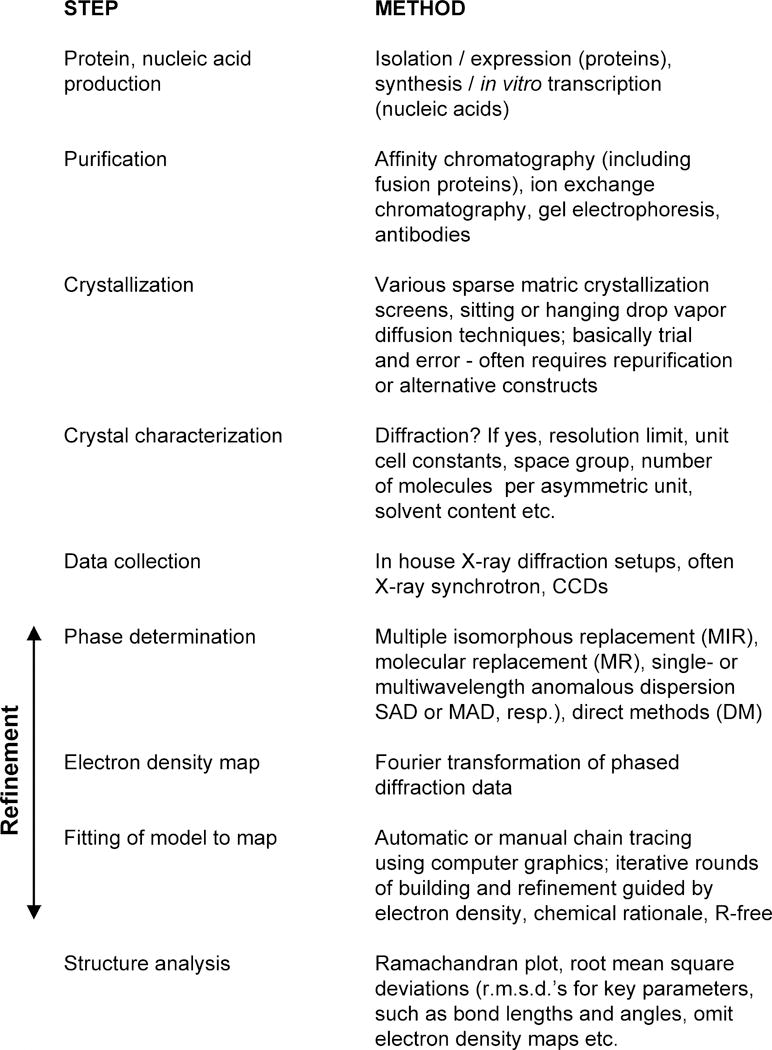
Individual stages of a macromolecular X-ray crystal structure determination. Selected methods are listed on the right. Approaches for refining structures include least squares fitting and simulated annealing. Adapted from Ringe and Petsko (1996).
Sample Preparation
Crystallography requires large, milligram, amounts of pure material, precluding in most cases isolation of enzymes or receptors for crystallization from tissues. Instead, proteins based on recombinant DNA technology are used for the structural studies. The DNA is subcloned from a cDNA library or, alternatively, the gene is synthesized. A battery of expression vectors is commercially available and, while E. coli still represents the most common organism for over-expression, insect cells, yeast, and human cell lines are becoming ever more popular for producing recombinant proteins. In addition, cell-free expression should also be considered as an alternative approach.
Molecules for crystallization need to be reasonably well structured and not floppy. Therefore, it is important to consider possibly unstructured or flexible regions, i.e., at the N- or C-terminus, in the design of the construct. Constructs amenable to crystallization can often be identified by limited proteolysis (Dong et al., 2007; Li and Egli, 2016). In many cases, only domains can be crystallized, or it is necessary to resort to the homologous proteins from a thermophilic organism for successful crystallization. Induced-fit binding of a ligand may render the protein with the ligand bound more likely to crystallize than protein alone. It is also worthwhile to consider whether there are many charged residues that are solvent exposed. This is because reduction of surface entropy by mutation of Lys to Ala or other strategies can dramatically increase the chances of obtaining crystals or of producing higher quality crystals (Czepas et al., 2004). Another important aspect concerns the size of the protein: Is the target a small protein (less than ~70 amino acids) or a polypeptide? In that case, crystallization of the small protein as a fusion with a larger and well-characterized protein, such as glutathione-S-transferase (GST) or others, should be tried (Smyth et al., 2003). This often improves solubility and allows for phasing by molecular replacement of the GST.
Fusion with a variety of tags or proteins also facilitates purification via affinity chromatography (Structural Genomics Consortia, 2008). Some popular ones include the (His)6 tag, GST, maltose-binding protein (MBP), and small ubiquitin-like modifier (SUMO) protein. Further purification steps may involve gel filtration and/or ion-exchange chromatography. Procedures that should be avoided are ammonium sulfate precipitation and lyophilization, and care should be applied when combining various fractions following column chromatography or different batches of protein. In general, the purification should be carried out quickly and proteins need to be handled gently and maintained at reduced temperature. Turbid samples need to be centrifugated and, for filtrations, cartridges with minimal dead volume should be used and one should check for adsorption (OD/activity) after filtering. As a rule of thumb, the purity of a protein should be 90% to 95% by SDS-polyacrylamide gel electrophoresis (PAGE) with Coomassie stain. The purified protein can be further characterized with native PAGE, light scattering (monodispersity does not necessarily improve the chances of obtaining crystals), isoelectric focusing (to determine the pI), mass spectrometry, circular dichroism (CD) spectroscopy, and other techniques. Proteins of low solubility (less than 1 mg/mL) are typically not suitable for crystallization experiments, and a search for other constructs or mutation via in vitro directed evolution may be advisable in such cases.
DNA is produced by solid-phase chemical synthesis using suitably protected phosphoramidite building blocks (Gait, 1984). Two basic methods exist for producing RNAs of sufficient quality suitable for crystallization and X-ray structure determination. Longer fragments (>50 nucleotides) can be generated by in vitro transcription using the DNA-dependent T7 RNA polymerase (Milligan and Uhlenbeck, 1989; Wyatt et al., 1991). For shorter RNA oligonucleotides, the method of choice is chemical synthesis, usually by the solid-phase phosphoramidite technique. Due to the presence of the 2´-hydroxyl group in the furanose sugar, chemical synthesis of RNA is more complicated compared with DNA. Common protection groups for the 2′-OH moiety are the tertiary butyl dimethyl silyl (TBDMS; Scaringe et al., 1990; Wincott et al., 1995) group, the 2´-acetoxy ethyl orthoester (2´-ACE; Scaringe et al., 1998), and the triisopropylsilyloxymethyl functionality (TOM; Pitsch et al., 2001). The latter approach has allowed production of RNAs as long as 100 residues, a size range that includes many biologically interesting RNA motifs. Once deprotected and cleaved from the solid support, DNA and RNA oligonucleotides are typically purified via trityl-on reverse phase HPLC or ion-exchange chromatography. However, column chromatography is not suitable for the purification of longer fragments. Instead, large RNAs need to be purified by denatured PAGE and desalted following elution from the gel (Wyatt et al., 1991).
Crystallization
There are a number of crystallization techniques commonly used with proteins or nucleic acids: Hanging-drop and sitting-drop vapor diffusion, batch/microbatch under oil, free interface diffusion employing either integrated fluidic circuits (i.e., the Topaz crystallization system) or the Zeppezauer tube, and dialysis (Ducruix and Giegé, 1992; Carter and Sweet, 1997a,b; McPherson, 1998; McRee, 1999; Carter, 2003a,b; Rhodes, 2006; Doublié, 2007a; Drenth, 2007; Rupp, 2010; Ennifar, 2015). The first two techniques are illustrated schematically in Figure 7.13.18. Both are fast and easy to set up and versatile for both screening and optimization. The droplets can be viewed through glass (hanging drop) or either a plastic lid or a transparent tape (sitting drop) under a microscope. The drop size can vary but the volume of hanging drops is usually limited to ~5 μL. In both cases, the concentration of the particular precipitant in the reservoir exceeds that in the drop. As a result, water will diffuse from the drop to the reservoir, thus increasing the concentration of the precipitant in the drop over time and slowly lowering the solubility of the protein. Ideally, the protein solution will change from the unsaturated region (in terms of a phase diagram) to a labile, supersaturated region, where stable nuclei spontaneously form and grow. The advantage of the sitting drop method is that it can be automated and used in combination with crystallization robots.
Figure 7.13.18.
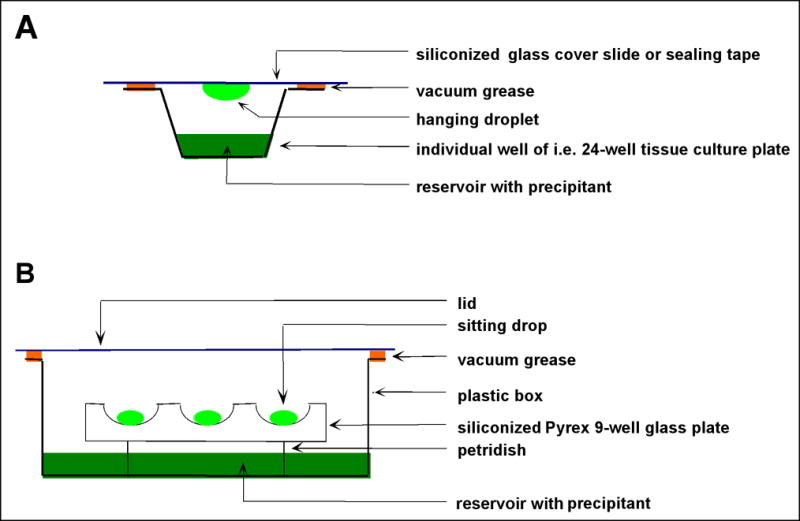
Two related methods for growing single crystals of biomacromolecules. Schematic depictions of the (A) hanging and (B) sitting drop vapor diffusion techniques. The volume of the droplets is in the nL (nanodrop setting robots) to μL range.
Microbatch crystallizations using petroleum oil or silicon oil are also easily set up and can be automated to some degree as well. By comparison, crystallizations using dialysis are somewhat more time consuming to set up, but the method allows for a greater control of the individual parameters that affect crystallization. Moreover, dialysis is ideal for replacing the crystallization buffer by a cryo solution, required for flash freezing crystals. Free interface diffusion in a Zeppezauer tube works better in microgravity, but crystallization experiments in space are expensive and not likely to be available in the foreseeable future.
Crystallization remains a trial and error—mostly error—approach and there is no general recipe for overcoming the nucleation barrier, i.e., a universal nucleant. There are many ways to achieve supersaturation in principle, including adding protein directly to precipitant, altering the temperature, increasing the salt concentration (salt out), decreasing the salt concentration (salt in), adding a ligand that changes the solubility of the protein, altering the dielectric constant of the medium, evaporating water, adding polymer (i.e., polyethylene glycols, PEGs) to produce volume exclusion, adding a cross-linking agent, concentrating the macromolecule, and removing a solubilizing agent. Success in crystallization is to a large degree dependent on crystal packing interactions and these remain unpredictable. Lattice contacts are noncovalent and entail various classes of hydrogen bonds (direct bonds between polar, uncharged groups such as OH, NH2, =O; direct bonds between one or more charged groups, so-called salt bridges; two polar or charged groups bridged by a water molecule; bridging of two moieties by a chain of two or more waters) and van der Waals interactions. Optimal packing requires electrostatic and shape complementarity.
It is now common to resort to so-called sparse matrix crystallization screens to increase the chances of obtaining crystals. Such screening kits are commercially available (see for example, http://www.hamptonresearch.com) and they come in a variety of flavors, suitable for proteins, protein-protein complexes, membrane proteins, DNA oligonucleotides, RNA, and so forth. The initial set of protein crystallization solutions compiled by Jancarik and Kim in the early 1990s is shown in Figure 7.13.19 (Jancarik and Kim, 1991). Individual solutions typically feature a salt, a particular precipitant, and a buffer. The pH of the buffers ranges from ~4 to 9 and ammonium sulfate figures prominently in the list of salts or precipitants. Similarly, various classes of PEGs are favorites among the precipitants. The recipes for many of these screens are largely based on empirical data that demonstrate, for example, that many proteins can be crystallized from ammonium sulfate solutions. However, not all salts are the same and in the Hofmeister series one can distinguish between stabilizing kosmotropes (weakly hydrated cations such as NH4+ or Cs+ and strongly hydrated anions such as citrate or sulfate) and destabilizing chaotropes (strongly hydrated cations such as Mg2+ or Al3+ and weakly hydrated anions such as nitrate or perchlorate; Collins, 2004). The use of PEGs in protein crystallization is based on the tendency of the random coil, water-soluble polymers to reduce protein solubility by volume exclusion (PEG and protein cannot occupy the same space at the same time). This mutual exclusion is mainly dependent on size and shape as well as on concentration.
Figure 7.13.19.
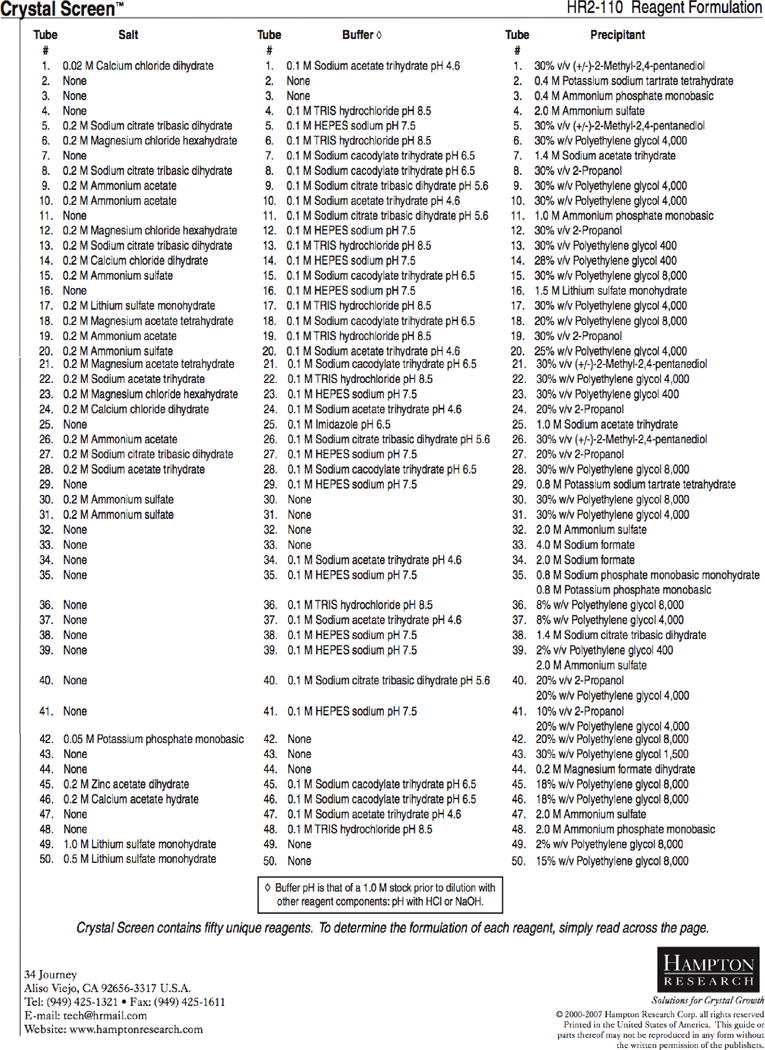
Example of a sparse matrix crystallization screen. Composition of the 50 solutions in the so-called Crystal Screen that is commercially available from Hampton Research. Reprinted with permission from Hampton Research (http://hamptonresearch.com/product_detail.aspx?cid=1&sid=17&pid=1).
Setting up hundreds or perhaps thousands of crystallization trials is a tedious task and the screening process is nowadays facilitated by crystallization robotics. An example of a crystallization robot is depicted in Figure 7.13.20. Robotics can be used to generate crystallization screens (so-called liquid handlers), to set up sitting-drop crystallization plates (the 96-well format is quite common), and to barcode, store, retrieve, and image at regular intervals of one’s choice the plates. Epifluorescence microscopy can be used to differentiate between crystals of salt and protein; phosphate buffer should be avoided as phosphate tends to crystallize readily and such crystals are then often mistaken for crystals of a macromolecule. Initial leads can be further optimized by manual crystallization setups and the size optimized by seeding. Micro-seeding uses seed beads from crushed crystals in a serial dilution to seed fresh drops in the hope that the introduction of a few seed nuclei into a metastable solution will produce larger crystals. Streak seeding is similar to micro-seeding but quicker in that a whisker is used to pull off seeds from a crystal in order to then streak it through a fresh drop. Finally, macro-seeding consists of partially dissolving the surface layers of a crystal and then placing it into a fresh metastable solution for growth (http://xray.bmc.uu.se/~terese/crystallization/tutorials/tutorial4.html).
Figure 7.13.20.
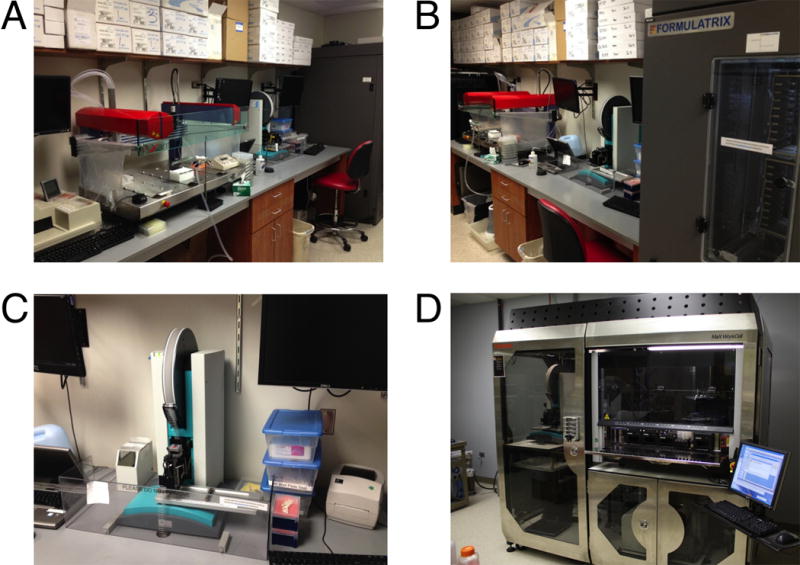
Automation of crystallization experiments. Crystallization robotics at Vanderbilt University include (A) a Xantus lipidic cubic phase robot, (B) a Formulatrix Rock Imager for storage and automatic imaging of crystallization plates, (C) a TPP LabTech Mosquito nanodrop setter robot, and (D) in the laboratory of the author, the MaX WorkCell by Thermo Fisher Scientific. The WorkCell integrates nanodrop setting (“Mosquito,” on the left), liquid handling, and screen preparation (“Starlet,” Hamilton Company; on the right), and sealing of crystallization plates (bottom right).
There are some differences between the crystallizations of proteins and nucleic acids, owing to the polyanionic nature of the latter. Thus, many DNA or RNA oligonucleotides can be crystallized in the presence of either magnesium chloride or polyamines (e.g., spermine tetrahydrochloride; Berger et al., 1996). Other alkaline earth metal ions such as Ca2+, Sr2+, and Ba2+ are also quite widespread, as are Na+, K+, and Rb +. Sodium cacodylate represents a very common buffer and 2-methyl-2,4-pentanediol (MPD), ammonium sulfate, and PEGs are probably the most commonly used precipitants (Baeyens et al., 1994). When all attempts to crystallize a protein fail, it is a good idea to resort to a different construct or to try a homologue from a different organism. Similarly, the key to success in nucleic acid crystallization is to try multiple sequences and to include overhanging bases at the 5´- or 3´-termini. Another option in RNA crystallography is helix engineering, for example by incorporating a tetraloop at the end of a stem (double helical) region and a tetraloop receptor elsewhere (Ferré-D’Amaré et al., 1998a). The pairing of such motifs often mediates stabilizing intermolecular contacts. A related approach to potentially generate a stable lattice is the use of mutagenized RNAs with a binding site for a particular protein. An example of this is constituted by a hepatitis delta virus ribozyme that contains the high-affinity binding site for the basic RNA binding domain of the U1A spliceosomal protein (Ferré-D’Amaré et al., 1998b).
A note of caution at the end of this section: although it is exciting to see crystals under a microscope, it turns out that many crystals do not diffract X-rays at all, or only very weakly. Before letting the excitement build up too much, it is therefore a good idea to test the crystals for diffraction on an in-house X-ray setup.
Data Collection and Processing
X-rays are high-energy photons and the wavelengths of those used in macromolecular crystallography experiments lie in the 0.5 to 1.8 Å range (Blundell and Johnson, 1976; Woolfson, 1997; Rhodes, 2006). X-rays can, for example, be generated in sealed high-voltage tubes where an anode (Cu, Mb, Fe, etc.) is bombarded with electrons from a heated cathode filament. An electron is hitting the anode material, and, as it passes within proximity of an atom, the electron is attracted to the nucleus by the Coulombic force. This alters the trajectory of the electron, and the closer the electron to the nucleus, the greater the change in its trajectory. To conserve momentum, a photon is created, whereby the photon’s energy depends on the degree to which the electron’s trajectory was changed. The energy released in the form of photons is referred to as Brems-Strahlung (“braking radiation” or “white radiation”). Every now and then, an electron that hits the anode target is of sufficiently high energy to displace an electron from an inner shell (i.e., the K shell) and an electron from a higher shell (L, M, etc.) then takes its place, with the energy difference between them being emitted as monochromatic X-ray radiation. Normally X-rays are polychromatic, but monochromatic radiation can be obtained by way of a monochromator, for example a graphite crystal.
However, most of the energy is generated as heat and not “light,” and X-rays from a sealed-tube setup (Fig. 7.13.21A) are typically not of high enough intensity for data collection with weakly diffracting macromolecular crystals. By comparison, so-called rotating anode units (Fig. 7.13.21B) feature an effective increase in the area of the anode target bombarded by accelerated electrons. However, the advantage in terms of higher intensity X-rays comes at a cost: rotating anode generators require more maintenance than sealed-tube setups as parts need to be replaced (cathode filament), cleaned (rotating anode), or rebuilt (ferrofluidic seal).
Figure 7.13.21.
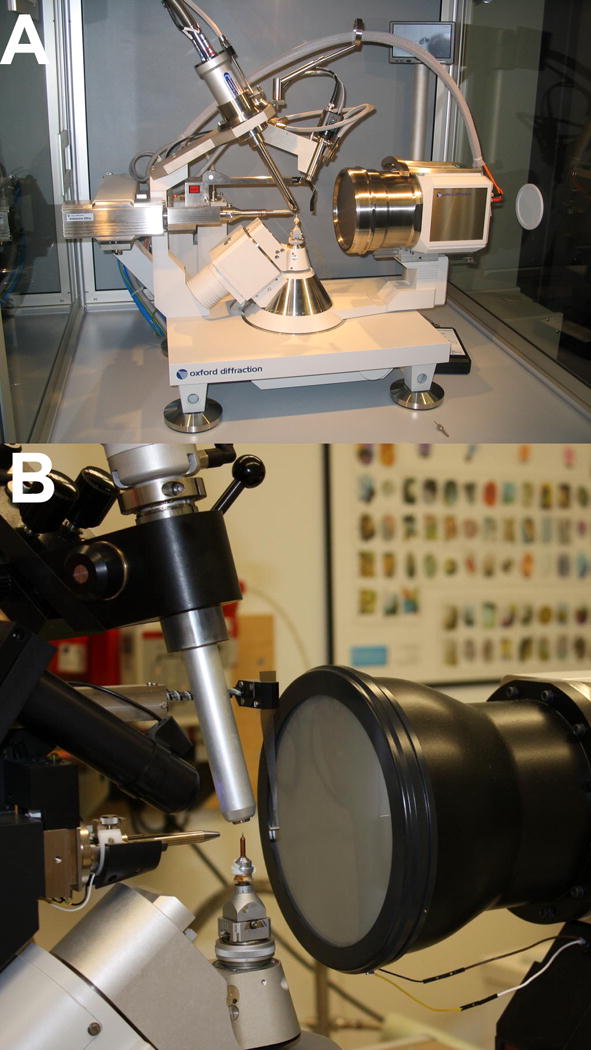
X-ray generators and detectors. Two 4-circle, kappa-geometry X-ray diffraction setups currently used by researchers at Vanderbilt University. (A) The sealed tube Oxford Xcalibur PX2 Ultra (Oxford Diffraction), and (B) the rotating anode Bruker Microstar (Bruker AXS). Tube housing (Xcalibur), beam collimator, beam stop, CCD detector, crystal cooler, goniostat, goniometer head, and telescope are clearly visible.
Today, most diffraction data collections are conducted at X-ray synchrotrons, where electron or positron beams are circling close to the speed of light in a storage ring (Fig. 7.13.22). X-rays are emitted in a tangential fashion when the beam is deflected by extremely strong electromagnets, so-called wigglers or undulators (Helliwell, 1992). Unlike the above sealed-tube or rotating anode generators that produce X-rays of a particular wavelength (i.e., CuKα = 1.5418 Å), the wavelength of the X-ray beam at synchrotrons is tunable. The availability of synchrotrons has had a major impact on structural biology and has impacted many other areas of research in a dramatic fashion (Table 7.13.4; Hendrickson, 2000). The higher intensity of X-rays at synchrotrons leads to significant improvements in the resolution of diffraction data (>0.5 Å and more), but also causes radiation damage of crystals. Damage inflicted over the long run on a rotating anode source can occur in minutes on an unattenuated undulator beamline. Primary radiation damage is due to the large absorption cross-section of heavier atoms such as sulfur or selenium and secondary damage is caused by free radicals and photoelectrons.
Figure 7.13.22.
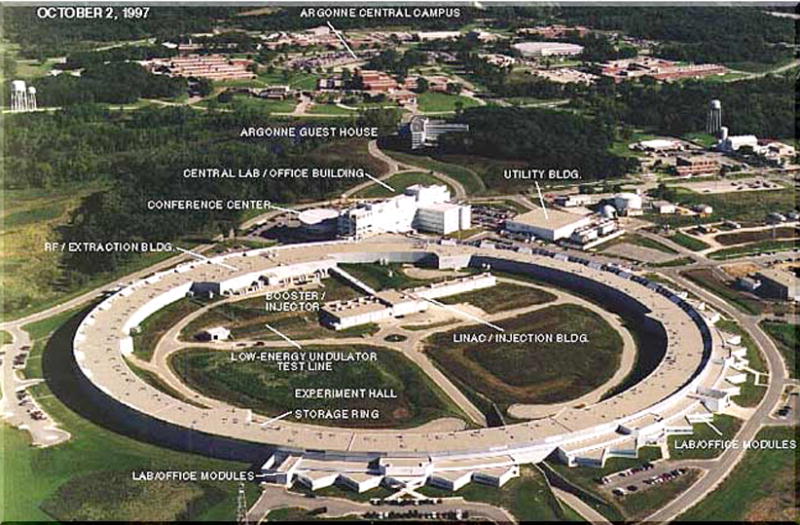
X-ray Synchrotron. Aerial view of the Advanced Photon Source (APS) at Argonne National Laboratory, a so-called 3rd generation X-ray synchrotron.
Table 7.13.4.
Impact of X-Ray Synchrotron Radiation
| Dramatic improvements in resolution (<1 Å in some cases) |
| High-throughput X-ray crystallography (structural genomics) |
| Structural analysis of multi-component macromolecular machines |
| Micro- and 2D-crystallography (small crystals and membranes) |
| New phasing strategies (MAD) |
| Ultrafast time-resolved crystallography (ns resolution) |
| X-ray absorption spectroscopy (XAS, EXAFS) |
| Non-crystalline diffraction and small angle scattering |
| X-ray microscopy of whole hydrated single cells |
| Material sciences |
To preserve crystals in the beam, they need to be flash-frozen and maintained near liquid nitrogen temperature in a cold stream during data collection (Fig. 7.13.23; Harp et al., 1998; Garman and Owen, 2006). Crystals mounted in capillaries (possible for neutron data collection; see http://www.mitegen.com/ for rapid room temperature mounting) will not last very long in the beam. For flash-freezing, crystals are scooped up from a droplet with a nylon loop and then swiped through a cryoprotectant before being plunged into liquid nitrogen. The choice of cryoprotectant is important, as ice inside the loop formed during freezing will lead to diffuse scattering and powder pattern rings in diffraction images. Popular protectants are glycerol, sucrose, ethylene glycol, propylene glycol, low-molecular weight PEGs, MPD, and 2,3-butanediol. Very high concentrations of salts such as sodium malonate have also been reported to be suitable for cryoprotection. Crystals are then shipped to the synchrotron source in the frozen state inside so-called dryshippers. Most macromolecular crystallography synchrotron beamlines are now equipped with automatic sample changers and most feature remote access, allowing users to collect data without leaving the office or the laboratory.
Figure 7.13.23.
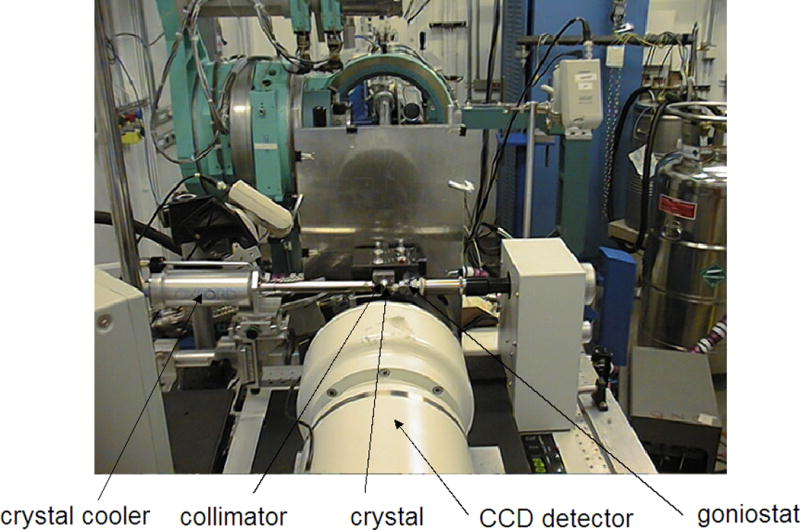
Inside a Synchrotron experimental station. The Marresearch charge-coupled device detector (MARCCD 225; foreground, http://www.rayonix.com) mounted on the MAR desktop beamline (DTB) at the insertion device beamline (5-ID-D hutch) of the DuPont-Northwestern-Dow collaborative access team (DND-CAT), located at sector 5 of the APS. The view is into the beam that is transported along the tube visible in the center of the upper half of the photograph. The instrumentation colored light blue in the background is not part of the macromolecular crystallography setup. Work conducted at the DND-CAT now focuses more on surface and interface science, nano-materials, catalysis, and environmental science. The macromolecular crystallography efforts have moved to the new Life Sciences (LS-CAT) at sector 21 of the APS that offers four ID lines and is jointly run by Michigan institutions, Northwestern University, the University of Illinois at Urbana-Champaign, the University of Wisconsin, and Vanderbilt University. Further consortia that operate ID and/or Bending Magnet (BM) beamlines for macromolecular crystallography at the APS include BioCARS-CAT (sector 14), IMCA-CAT (sector 17), SBC-CAT (sector 19), SER-CAT (sector 22), GM/CA-CAT (sector 23), NE-CAT (sector 24), and LRL-CAT (sector 31).
Prior to the actual data collection, a single or multiple test frames (Fig. 7.13.24) are recorded and indexed and the orientation matrix determined and refined. Once Bravais lattice type and Laue group are assigned, one needs to decide on the best data acquisition protocol. Important parameters are the angle of rotation (around the phi axis in most cases), exposure time, and the crystal-to-detector distance. In terms of the correct rotation angle, fine phi slicing guarantees a reduced background whereas coarse phi slicing is more suitable for rapid data collection. In cases where crystals diffract to very high resolution, it is necessary to collect separate low-, medium-, and high-resolution data sets, whereby proper acquisition of low-resolution reflections may require an attenuated beam. In general, data collection is now a matter of minutes, and as long as the crystal survives, it is better to collect too much data than too little. CCD detectors are used to record individual diffraction frames (Figs. 7.13.21, 7.13.23, and 7.13.24). These detectors offer several advantages over multi-wire proportional counters or image plate area detectors, i.e., a linear response and high dynamic range, rapid readout, and high spatial resolution. Unlike standard data collections that use X-rays with a discrete wavelength in the rotation mode, Laue diffraction experiments employ “white” or polychromatic radiation with exposures in as little as 50 psec for time-resolved structural studies. Such experiments are complicated by multiple intensities, variations in the absorption coefficient, an uneven detector response at varying wavelengths, and reflection spot overlaps, among others.
Figure 7.13.24.
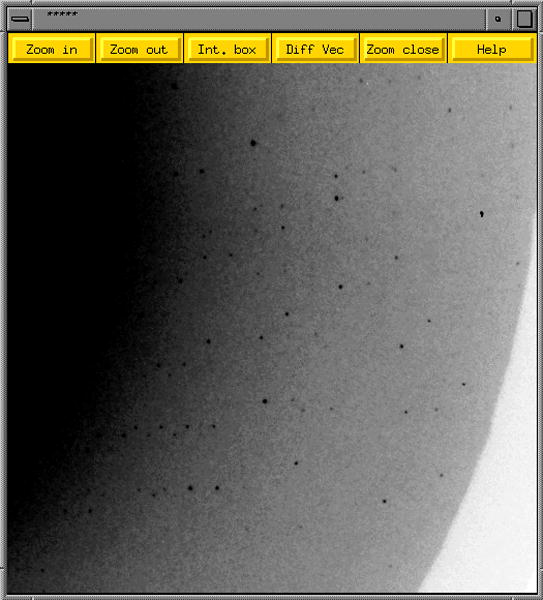
Diffraction data collection. Close-up of a 1° (ΔPhi) diffraction image obtained from a single crystal of the so-called Dickerson Drew Dodecamer (DDD; B-form DNA of sequence CGCGAATTCGCG). The dark spots represent individual reflections and the diffraction limit is around 1 Å. Data statistics for this particular crystal of the DDD are listed in Table 7.13.5.
While the data collection is ongoing, the experimenter starts the data reduction. The reflections (spots) in the individual images or frames are indexed and the crystal and detector parameters are refined before the diffraction peaks are integrated, i.e., their intensities extracted. After establishing the relative scale factors between measurements, these parameters are once more refined using the total data set. Finally, the frames are merged and a statistical analysis of reflections based on the space group symmetry is computed. An example of the completeness and quality of a diffraction data set broken down into resolution shells or bins is shown in Table 7.13.5. The final product of the diffraction experiment is a file with the amplitudes of individual reflections (the so-called structure factors, Fobs) and their standard deviations σ(Fobs). The Rsym represents the spread of equivalent reflections (the smaller the better) and the resolution limit can be estimated from the mean[I/σ(I)] ratio (the highest resolution shell included should have a mean[I/σ(I)] ≥2) and/or the completeness of the data in a higher shell (i.e., > 70% in the outermost shell).
Table 7.13.5.
Diffraction Data Quality: Breakdown into Resolution Bins
| Resolution [Å] | N (unique) | Mean [I/σ (I)] | Completeness [%] | Rsyma |
|---|---|---|---|---|
| 20.00–3.00 | 1436 | 22.4 | 98.8 | 0.067 |
| 3.00–2.50 | 997 | 26.1 | 99.8 | 0.059 |
| 2.50–2.00 | 2218 | 24.5 | 99.5 | 0.063 |
| 2.00–1.80 | 1626 | 18.5 | 97.4 | 0.049 |
| 1.80–1.60 | 2578 | 18.5 | 99.0 | 0.049 |
| 1.60–1.40 | 4282 | 16.0 | 100.0 | 0.064 |
| 1.40–1.20 | 7524 | 13.7 | 100.0 | 0.085 |
| 1.20–1.10 | 6060 | 8.5 | 99.7 | 0.154 |
| All data | 26,721 | 15.5 | 99.5 | 0.064 |
The Rsym is a measure for the similarity of the intensities of symmetry-equivalent reflections. It should be a small as possible, typically around 5% or below. Another parameter, Rmerge, is used to characterize the similarity of corresponding reflections in different data sets (i.e. low- and high-resolution data sets) or in data sets from different crystals.
Phasing Approaches
Unfortunately, the measured structure factor amplitudes alone are insufficient for building a structural model. The Fourier transformation of the diffraction pattern that is needed to generate the crystal structure (in the form of an electron density distribution) requires both the amplitudes and the phases of structure factors (Blundell and Johnson, 1976; McRee, 1999; Woolfson, 1997; Rhodes, 2006; Doublié, 2007b; Drenth, 2007; Rupp, 2010; Ennifar, 2015). However, the phase information is lost in the diffraction experiment. Contrary to data collections that are rapid and more or less automatic, the determination of a structure can therefore still be a time-consuming challenge. There are four basic techniques for solving the phase problem with crystals of macromolecules: multiple isomorphous replacement (MIR), single- and multi-wavelength anomalous dispersion (SAD and MAD, respectively) and a combination of the two (MIRAS), molecular replacement (MR), and direct methods (DM). Molecular replacement requires a good model structure and it is the method of choice for complexes of the same enzyme with different ligands (i.e., inhibitors) or multi-domain proteins for which the structure of a domain is available (i.e., fusion proteins). Particularly with crystals of oligonucleotide duplexes, one is often tempted to perform rotation and translation searches using A- or B-form models. However, the failure rate is quite high and relatively small deviations between the conformations of the model and the actual structure are sufficient to derail the search.
Direct methods are model-independent, but will only work in cases for which diffraction data to very high resolution are available (<1.0 Å). In addition, there is a size limit and the structure of a 100-kDa protein is unlikely to be phased by DM even with crystals diffracting to atomic resolution. Of the 104,000 or so structures currently deposited in the Protein Data Bank, <0.7% were determined at resolutions of 1 Å and higher. Unlike with crystal structures of small molecules that are mostly solved by DM, the approach is not likely to replace MAD or MIR as the standard phasing techniques for new macromolecular structures in the near future (Terwilliger and Berendzen, 1999; Weeks et al. 2003; Sheldrick, 2010).
Both MIR and MAD require derivatization of a macromolecule, which is the introduction of heavy atoms into the crystal lattice. Heavy atoms can be bound covalently or by coordination and can be incorporated synthetically (nucleic acids), covalently during protein expression (selenium), by co-crystallization, soaking of native crystals, or in a pressure cell (xenon). A key difference between MAD and MIR is the requirement with the latter that native crystal and derivative crystals (two but better more derivatives are needed for MIR) are closely isomorphous. In this context, it is noteworthy that highly similar unit cell constants are not necessarily an indication that the orientations of the protein or nucleic acid in two crystals are identical. The classic approach for introduction of heavy atoms is soaking, and a resource for heavy-atom derivatization can be found at http://www.sbg.bio.ic.ac.uk/had/heavyatom.html (Heavy Atom Databank). Among the favorites for proteins are mercurial compounds (binding to free cysteines or methionine) and platinum compounds [binding mainly to methionine, histidine, and cysteine; Pt(CN)2 binds to positively charged residues; Petsko, 1985; Rould, 1997; Garman and Murray, 2003]. The heavier the atom the better since the scattering amplitude is proportional to the number of electrons.
Several classes of heavy atoms can be differentiated: single metal ions are bound electrostatically, endogenous metal ions such as zinc in zinc fingers and iron in heme that can be used directly for phasing or substituted to obtain a larger signal (i.e., Sr2+ for Ca2+), compounds requiring a chemical reaction, multi-metal complexes for larger molecules (for example the tantalum bromide cluster; Egli, 2015), xenon and krypton, and anions such as halides or triiodide. For nucleic acids, Rb+, Sr2+, Ba2+ (Tereshko et al., 2001), and Tl+ (Conn et al., 2002) are particularly useful and helix engineering for generating a coordination site for Co (III) hexamine has been used for large RNAs (Keel et al., 2007), as have lanthanides (Holbrook and Kim, 1985; Kim et al., 1985). For soaking, it is important to establish a suitable stabilizing solution or artificial mother liquor. The crystal is then transferred to the stabilizing solution that contains the heavy atom at a concentration of typically <1 to 10 mM. Occasionally, cracks or ragged edges develop and crystals need to be tested for diffraction at various time intervals, whereby it is useful to have a diffraction image prior to soaking for comparison. There are various ways to determine whether the heavy atom is indeed bound. A color change or cracking may be taken as evidence for binding. Mass spectrometry or MicroPIXE (particle induced X-ray emission microprobe) can also be used to confirm successful derivatization. Ultimately, the experimental determination of difference Patterson peaks (there are various means to retrieve the locations of heavy atoms) is the best proof for a useful derivative that paves the way to an interpretable electron density map.
Contrary to MIR, MAD phasing can be accomplished with a single derivative and the technique has gained widespread popularity in the past 20 years and now accounts for the majority of newly determined structures (Hendrickson, 2000). However, since diffraction data need to be collected at the absorption peak of a particular anomalously scattering atom (Fig. 7.13.25), MAD or the related SAD (single-wavelength anomalous dispersion) experiments have to be performed at a synchrotron source.
Figure 7.13.25.
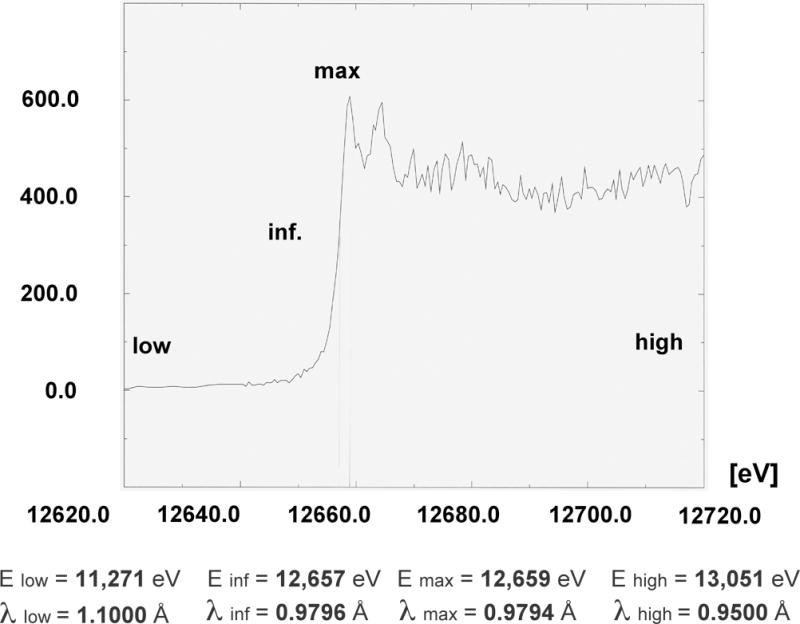
Multiwavelength anomalous dispersion (MAD) experiment. Example of an X-ray fluorescence spectrum from a protein crystal that contains Se-methionine (Se-Met) in place of Met (Maf protein from Bacillus subtilis; 189 amino acids and 6 Se atoms per protein molecule). The theoretical K absorption edge of selenium lies at 12.6578 keV or 0.9795 Å (an energy of 12.398 keV corresponds to 1.0 Å; http://skuld.bmsc.washington.edu/scatter/). In a typical MAD experiment, diffraction data of high redundancy from the same crystal are collected at three or four wavelengths (i.e., reference below the edge, low, inflection point, inf., peak, max, and reference above the edge, high).
The most common anomalous scatterer for proteins is selenium, which can be incorporated as Se-methionine in E. coli using an auxotrophic strain or metabolic inhibition (Hendrickson et al., 1990; Doublié, 1997). High concentrations of isoleucine, lysine, and threonine are known to block methionine synthesis in E. coli by inhibiting aspartokinases. In addition, phenylalanine and leucine act in synergy with lysine. Thus, growth in a medium lacking methionine but supplemented with Se-methionine and plenty of the methionine pathway inhibitors allows for efficient incorporation of the Met analog. Se-Met derivatization does not always work and a number of caveats need to be considered.
Selenium is toxic and so cells will not grow as fast. Se-Met derivatized proteins are often less soluble and the altered solubility can affect crystallization. Selenium is also easily oxidized and this may blur the absorption edge or render phasing more difficult. Moreover, it is crucial to precisely determine the peak of the anomalous absorption signal with a particular crystal on the beamline using a fluorescence detector (Fig. 7.13.25). Very tiny deviations from the maximum may subsequently lead to failure in locating the anomalous scatterers or adversely affect the quality of the MAD electron density map (for a successful example, see Fig. 7.13.26). Bromine is the most popular anomalous scatterer for derivatization of crystals of nucleic acids or protein-nucleic acid complexes, and can be covalently incorporated in the form of Br5U or Br5C. Naturally, many other heavy atoms are not only useful for MIR but can also serve as anomalous scatterers. For example, most crystals of oligonucleotides are grown in the presence of alkaline earth metal ions and it is advisable to always collect MAD or SAD data with crystals that contain Sr2+ or Ba2+. This is because the common assumption that structures of oligonucleotide fragments typically yield to phasing by MR is incorrect. Selenium has also been covalently incorporated into nucleic acids for structure determination via SAD or MAD (Wilds et al., 2002; Pallan and Egli, 2007a,b).
Figure 7.13.26.
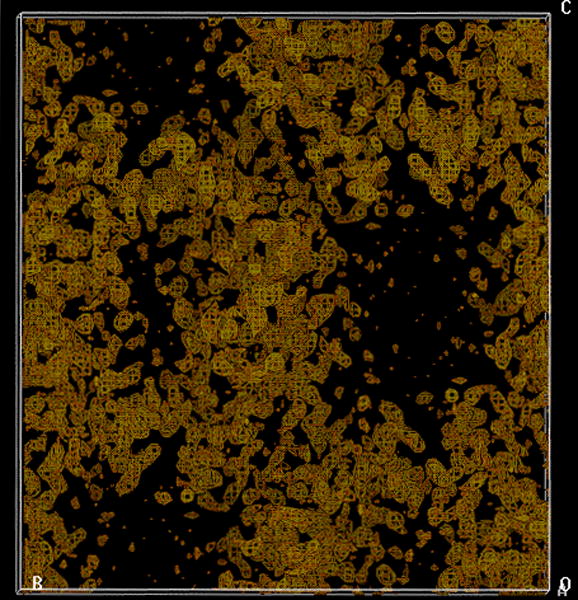
MAD phasing. Experimental electron density map based on five Se sites obtained from a Se-Met crystal of the Maf protein (2.7 Å resolution, no solvent flattening), calculated with the program SOLVE (Terwilliger and Berendzen, 1999). The map displays clear boundaries and reveals large solvent-filled channels (black regions).
Accurate phases are very important, as they influence the quality of the experimental electron density and without accurate density, it is impossible to build a model. SAD and MAD phasing have the advantage that the derivative does not have to be isomorphous with the native crystal. Once the model based on the, say, Se-Met protein structure is built and refined, it can be used to solve the native crystal structure via MR if the two are not isomorphous. However, that is not always necessary, and one may decide to just use the structure of the Se-Met protein unless the native dataset is of higher resolution. Experimental electron density maps based on SAD or MAD are often of excellent quality, making it possible to automatically trace the protein and build an initial model.
Thus, it is not uncommon to end up with a preliminary model of a protein within hours of completing data collection; however, in most cases the initial electron density needs to be improved. This is achieved by improving the phases, since they are the terms with the largest amount of error in the Fourier transformation. Inaccuracies in the phases dominate those in the amplitudes with regard to the quality of the electron density. The general approach to improving the phase information is to apply constraints in real space; this is referred to as density modification. Density modification methods commonly used are solvent flattening (and flipping), noncrystallographic symmetry averaging (multiple molecules per asymmetric unit that are not related by crystallographic symmetry, e.g., in viruses), histogram matching, phase combination and extension, and the maximum likelihood approach (Carter and Sweet, 1997a,b; Murshudov et al., 1999; Carter, 2003a,b; Adams et al., 2010).
Refinement and Analysis
The model built into the experimental density typically represents just a rough approximation, and to arrive at a final structure it is necessary to refine it. Each atom in the model is represented by coordinates x, y and z, an occupancy parameter (q ≤ 1), and a temperature factor (B-factor). The atomic coordinates are stored in a file of a particular format, i.e., the so-called PDB format. The objective of crystallographic refinement is to apply changes to the atomic model such that the difference between model (represented by calculated structure factors Fcalc) and the observed structure factors Fobs are minimized. The R-factor is a measure for the deviations between the calculated and observed amplitudes:
where by h, k, and l represent the Miller indices, the coordinates of reflections in reciprocal space.
Refinement is an iterative process that entails the following basic steps: manual building and (re)fitting, automatic constrained least squares optimization taking into account both X-ray data and geometric constraints of the physical model, and electron density map calculation from the improved model (so-called Fourier sum and difference electron density maps), followed by additional building and so forth. The model will profit from a large excess of reflection data over the number of parameters (x, y, z, q, B) that define the model. A ratio of, say, 10 would be considered excellent, and a ratio of 2 represents a poorly over-determined structure. To reduce the total number of parameters that need to be refined, stereochemical restraints are applied (i.e., bond length, bond angle, torsion angle, planarity, chirality, van der Waals distances). The restraints are entered as terms in the refinement target and are weighted so that the deviations from ideal values match those found in databases of high-resolution structures. Thus, the target function is an energy that consists of an X-ray (Fobs, Fcalc) and an empirical term (bonds, angles, van der Waals contacts etc.), and optimization algorithms such as steepest descent or conjugate gradient are used to find the nearest minimum in the target function.
To escape local energy minima in the target function and to improve the radius of convergence, simulated annealing (molecular dynamics, MD) is used (Brunger and Adams, 2002; Adams et al, 2010). Atoms are given random starting velocities and their motion is modeled according to Newton’s laws of motion (bond stretching and angle bending). The temperature of the system is increased (to 2000°C or more) with periodic cooling (annealing), followed by energy minimization. The MD equations are modified through addition of crystallographic residual to the empirical potential energy. Overall, the random element and the thermal motion help to overcome local minima in the target function. Another variant of the least squares optimization is maximum likelihood (Murshudov et al., 1999). Its basic premise is that refinement is not just a matter of making Fcalc equal to Fobs, but also needs to consider the phases. To decide how to move an atom we need to take into account the overall accuracy of the model and the best model is consistent with all observations. Consistency is measured statistically by the probability that these observations would be made given the current model. The probabilities include all sources of error (including the model) and as the model gets better, errors get smaller and probabilities become sharper, which in turn increases the likelihood.
The R-factor serves as one guide for the status of the refinement. An R-factor of ~60% is consistent with a random relation between the observed and calculated amplitudes. A good starting model will have an R-factor of 40% to 45% and a final model of a macromolecular structure may exhibit an R-factor of ~20%. During the refinement (2Fobs-Fcalc), sum electron density maps should look like the corrected model, although they can be biased by incorrect phases/models. On the other hand (Fobs-Fcalc), difference electron density maps will indicate missing or incorrectly placed atoms. So-called omit maps can be used to remove phase bias that results from least-squares refinement using wrong coordinates. These are difference electron density maps calculated after removing a part of the model from the calculation of Fcalc amplitudes. Because nearby atoms have been influenced by the incorrect portions, the “memory” associated with the omitted atoms needs to be removed. This is achieved by annealed omit maps that are calculated after removal of specific portions of the structure and additional MD. A composite omit map can be generated by placing a 3D grid over the entire unit cell and removing one grid box at the time, calculating the Fcalc, and then repeating this for all grid boxes and summing over all grid points.
An independent measure of the quality of the fit is provided by the R-free, an R-factor that is based on a test data set, reflections (typically amounting to 5% of the total diffraction data) that are set aside and are not included in the refinement (Brunger, 1992). The R-free will be higher than the R-factor (i.e., by up to 5%) and an R-free of 30% with an R-factor (also called R-work) of 20% may indicate errors or over-refinement. Obviously, model building and refinement are easier with high-resolution data. Figure 7.13.27 depicts sum electron densities around an aromatic moiety at different resolutions and it is obvious that a map at 3 Å offers some challenges to the model builder. Other parameters beyond R-factors and resolution that need to be considered for judging quality and correctness of a structure are the root mean square deviations (r.m.s.d.s) of bond lengths and angles from standard values (should be <0.02 Å and 3°, respectively) and the B-factors (portions of a structure with atoms displaying B-factors >50 Å2 indicate weak electron density). With crystal structures of proteins, the so-called Ramachandran plot (Fig. 7.13.28) can be used to pinpoint problematic areas in a structure based on deviations of the backbone torsion angles from commonly encountered values. In the case of nucleic acid structures, correlating torsion angles is more complicated because DNA and RNA feature six backbone torsion angles and a glycosidic torsion angle. However, a correlation for individual nucleosides, for example, of the glycosidic torsion angle χ between nucleobase and sugar with the the δ torsion angle that reflects the sugar pucker, reveals patterns that are characteristic for particular duplex forms and indicative of the structural diversity among natural and artificial pairing systems (Anosova et al., 2016).
Figure 7.13.27.
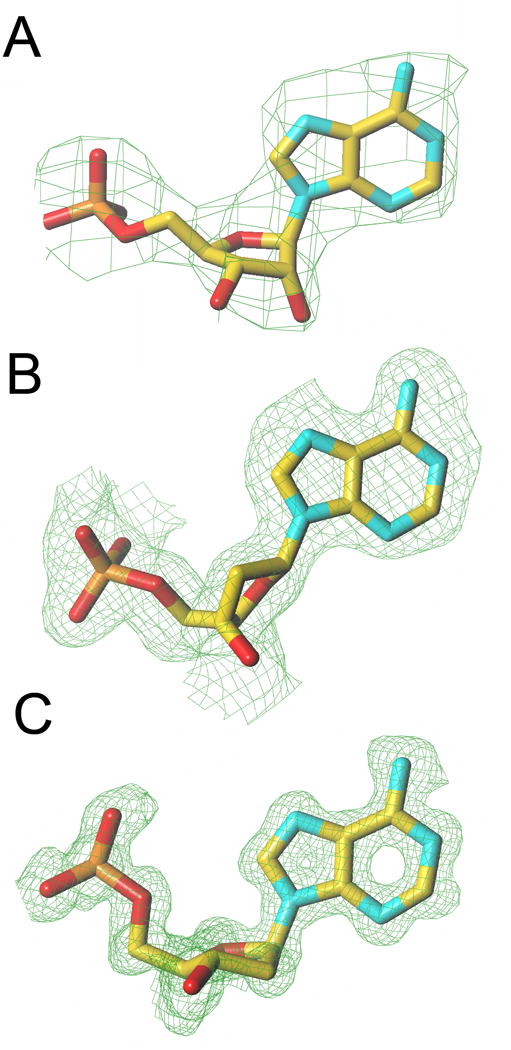
Resolution and quality of the electron density. Comparison of the quality of the Fourier (2Fo-Fc) sum electron density around adenosine monophosphate in crystal structures obtained at various resolutions (1σ threshold). (A) 2.85 Å, ATP in the crystal structure of the KaiC protein from Synechococcus elongatus; (B) 1.80 Å, A residue in the crystal structure of a B-form DNA; (C) 1.10 Å, atomic resolution, A residue in the crystal structure of an A-form DNA.
Figure 7.13.28.
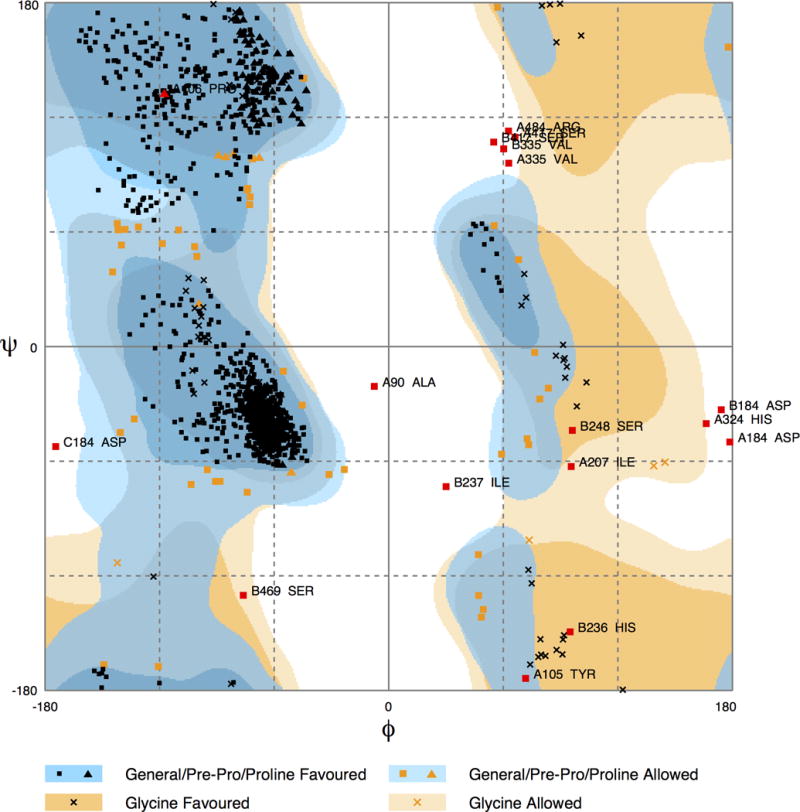
Structure refinement and quality control. Conformations of the Φ and Ψ backbone torsion angle pairs (Ramachandran plot) for amino acids in the crystal structure of human cytochrome P450 21A2 in complex with progesterone (PDB ID code 4Y8W) (Pallan et al., 2015). Individual angles fall either into the preferred regions (1230 residues [94.5%]) or allowed regions (44 residues [3.4%]), and the rest are outliers (red squares). The plot was generated with RAMPAGE (http://mordred.bioc.cam.ac.uk/~rapper/rampage.php) (Lovell et al., 2002).
It is important to realize that crystallographic models often lack parts of a protein or nucleic acid sequence. The N- and C-terminal portions of a protein are normally more flexible than the core as are the terminal nucleotides in DNA duplexes or single-stranded regions in RNAs. In the crystal structure of E. coli DNA polymerase I (Klenow fragment), ~10% of the amino acids are missing because they could not be seen in the electron density map at ~2.5 Å. This indicates that proteins packed into a crystal lattice can still retain considerable flexibility. Indeed, some enzymes are active in the crystalline state and enzymatic reactions have been studied using Laue crystallography. Along with protein or nucleic acid, crystals contain a lot of water (in some cases crystals consist of 70% to 80% water), and the final model consists not just of the coordinates of protein atoms but many first and second shell water molecules, ions, and other cosolutes.
Crystal packing forces obviously have an effect on the structure of a macromolecule and need to be considered in the conformational analysis of a protein. Rather than cursing them, lattice forces should be considered a blessing, as they can provide valuable information on the deformability of a loop region or particular features of the interface between a protein and its interacting partner. Apart from anisotropic B-factors from data at very high resolution, crystal structures typically provide mostly static information. Occasionally, two or more crystal forms are available, however, allowing one to sample multiple conformations of the same molecule. In such cases, it is possible to determine how packing forces affect the structure of a protein or nucleic acid and to identify flexible regions and relative motions of domains.
Websites with Information on Crystallographic Concepts and Resources
A list of selected websites with tutorials on symmetry, space groups, diffraction, Fourier transformation and other concepts, resources, or free software is provided in Table 7.13.6.
Table 7.13.6.
On-line Crystallography Resources and Tutorials
| URL | Information |
|---|---|
| http://crystal.chem.upenn.edu/course/index.html | Course on structure determination by X-ray crystallography |
| http://xray.tamu.edu/xscd_course.php | Single-crystal diffraction course |
| http://www.bioc.rice.edu/~georgep/xrayviewform.html | XRayView, a virtual X-Ray crystallography laboratory program |
| http://img.chem.ucl.ac.uk/sgp/large/sgp.htm | Space group diagrams and tables |
| http://people.brandeis.edu/~foxman1/teaching/indexpr.html | Symmetry and space group tutorial |
| http://escher.epfl.ch/escher | Escher web sketch |
| http://www.ysbl.york.ac.uk/~cowtan/fourier/duck1.html | Kevin Cowtan’s picture book of Fourier transforms and interactive structure factor tutorial |
| http://www-structmed.cimr.cam.ac.uk/course.html | Randy Read’s protein crystallography course |
| http://www.lks.physik.uni-erlangen.de/diffraction/ | Interactive tutorial on diffraction |
| http://www.ruppweb.org/Xray/101index.html | Bernhard Rupp’s crystallography 101 |
| http://cns-alumni.bu.edu/~slehar/fourier/fourier.html | An intuitive explanation of Fourier theory |
| http://www.iucr.org/education/pamphlets | International Union of Crystallography teaching pamphlets |
SUMMARY AND OUTLOOK
Progress in structural biology over the last quarter of a century has been dramatic on all fronts, including instrumentation, mechanistic insights into ever-larger molecules and multiprotein complexes, and the automation of individual steps on the way to a structure determination, (for those involved in a crystal structure analysis, see Fig. 7.13.16). The increasing complexity of the problems being tackled has led to the recognition that one technique alone often cannot provide all the answers and has motivated researchers to apply hybrid structural approaches, e.g., combinations of single crystal X-ray crystallography and cryo-EM, crystallography and SAXS, or NMR and computational simulations (computational biology has not been discussed beyond applications in crystallography in this unit).
Looking into the crystal ball, one can see further significant developments in the area of X-ray synchrotron sources in the future, with fourth-generation synchrotrons currently being under construction. One benefit of these will be the increased flux densities that are expected to be 103 to 106 times higher than those of current state-of-the-art light sources (McSweeney et al., 2014). Moreover, microfocus beamlines are enabling crystal structure determinations with ever-smaller crystals. The parallel emergence of the free-electron laser (FEL) opens a new era of X-ray crystallography and gives a further boost to structural biology. In an FEL, electrons traveling at nearly the speed of light make their way through an undulator magnet where they are accelerated, resulting in the release of photons. Electrons continue to move in phase with the field of the light emitted and the fields add together in a coherent fashion. The wavelength of the resulting X-ray beam of high brilliance can be tuned by changes in the magnetic field strength of the undulators or the energy of the electron beam. This setup precludes the need for a large storage ring (Fig. 7.13.22). Instead of exposing a crystal for seconds per collected diffraction frame, an FEL produces brief pulses of 10 femtoseconds (fs) duration (repeated 120 times per second), whereby each X-ray flash contains as many photons as the beam at a synchrotron source over about a second (Spence, 2014). Beyond crystallography, including time-resolved studies (Moffat, 2014), applications could include material science, imaging, surgery, and others.
Instead of relatively large single crystals, FEL crystallography is performed with nanocrystals that often contain just a few dozens unit cells and are delivered into the beam as a gas focused liquid jet with a diameter of ca. 5 μm (Chapman et al., 2011). But the need to collect thousands of frames still means that the amounts of protein required are substantial. Moreover, not all proteins will yield suitable nanocrystals, some will not diffract and testing them requires an FEL. The amounts of data collected are huge and terabite-size data sets are common. However, thanks to the extremely short X-ray pulses, radiation damage is not an issue anymore, as the data are essentially acquired before the crystals are destroyed. Hence there is no need to flash-freeze crystals, enabling observation of protein structures at ambient temperature and potentially allowing the experimenter to change the sample environment relatively rapidly. Of interest in this regard is the discovery that crystals suitable for FEL experiments can be grown inside cells (Gallat et al., 2014). In the distant future and, provided the flux of X-ray photons at FELs can be increased significantly and the pulses shortened further, the dream of single-molecule X-ray diffraction may come true (Hajdu, 2000; Fromme, 2014).
Automation of protein expression and purification, crystallization, data collection and structure determination, and model building will continue, initiated and driven by the need for high-throughput crystallography as part of structural genomics projects and drug discovery. A decade and a half of large-scale structure determination of proteins has had a major impact on technological advances that have clearly benefited traditional structural biology projects. However, the expectation that one may have had regarding potential outcomes of the PSI, namely that function could be gleaned from structure alone, has not been fulfilled in most cases (Chandonia and Brenner, 2006; Terwilliger et al., 2009; for all PSI publications, see http://olenka.med.virginia.edu/psi/). A more likely scenario is that structural information deposited in publicly accessible databases and improved data sharing in combination with biochemical, mutational, and genetic studies (that are perhaps initiated by the structural data) will allow the classification of proteins of unknown function at an increased pace.
The achievements made in terms of the structural characterization of soluble proteins, RNA, molecular machines, multisubunit complexes, and others cannot detract from the fact that there are areas where progress has been slower and significant challenges remain. An example that comes to mind is the membrane protein field. Many structures have been determined, including those for photo systems and ion channels as well as an increasing number of G-protein-coupled receptors (GPCRs, e.g. Kang et al., 2015), starting with the crystal structure of β-adrenergic receptor in 2007 (Rasmussen et al., 2007). However, expression of stable constructs of membrane proteins in amounts suitable for structural characterization, solubilization, and crystallization still constitute formidable obstacles on the way to a more routine generation of structural data. Capturing dynamic systems involving formation of relatively labile protein-protein complexes represents another frontier of structural biology (Radaev and Sun, 2002; Dafforn, 2007; Schneidman-Duhovny et al., 2012). One such system studied in the laboratory of the author is the minimal circadian clock from the cyanobacterium Synechococcus elongatus that can be reconstituted in vitro from three proteins in the presence of ATP. The KaiA, KaiB, and KaiC proteins interact to form complexes of different compositions throughout the 24-hour cycle, whereby the concentrations of the free proteins and the respective complexes oscillate (Johnson et al., 2008; Egli and Johnson, 2015; Pattanayek and Egli, 2015). Clearly, only by using hybrid structural approaches such as those outlined above can one expect to make headway with regard to a structural dissection of dynamic protein-protein complexes and a better understanding of mechanistic aspects.
Acknowledgments
The author would like to thank the U.S. National Institutes of Health (R01 GM103937 and P01 CA160032), the Defense Advanced Research Project Agency (DARPA) and Vanderbilt University for financial support.
LITERATURE CITED
- Abola E, Kuhn P, Earnest T, Stevens RC. Automation of X-ray crystallography. Nat Struct Biol. 2000;7:973–977. doi: 10.1038/80754. [DOI] [PubMed] [Google Scholar]
- Adams PD, Afonine PV, Bunkóczi G, Chen VB, Davis IW, Echols N, Headd JJ, Hung LW, Kapral GJ, Grosse-Kunstleve RW, McCoy AJ, Moriarty NW, Oeffner R, Read RJ, Richardson DC, Richardson JS, Terwilliger TC, Zwart PH. PHENIX: a comprehensive Python-based system for macromolecular structure solution. Acta Cryst D. 2010;66:213–221. doi: 10.1107/S0907444909052925. [DOI] [PMC free article] [PubMed] [Google Scholar]
- Afonine PV, Mustyakimov M, Grosse-Kunstleve RW, Moriarty NW, Langan P, Adams PD. Joint X-ray and neutron refinement with phenix.refine. Acta Cryst D. 2010;66:1153–1163. doi: 10.1107/S0907444910026582. [DOI] [PMC free article] [PubMed] [Google Scholar]
- Anosova I, Kowal EA, Dunn MR, Chaput JC, Van Horn WD, Egli M. The structural diversity of artificial genetic polymers. Nucleic Acids Res. 2016 doi: 10.1093/nar/gkv1472. in press. [DOI] [PMC free article] [PubMed] [Google Scholar]
- Arai S, Chatake T, Ohhara T, Kurihara K, Tanaka I, Suzuki N, Fujimoto Z, Mizuno H, Niimura N. Complicated water orientations in the minor groove of the B-DNA decamer d(CCATTAATGG)2 observed by neutron diffraction measurements. Nucleic Acids Res. 2005;33:3017–3024. doi: 10.1093/nar/gki616. [DOI] [PMC free article] [PubMed] [Google Scholar]
- Baeyens KJ, Jancarik J, Holbrook SR. Use of low-molecular-weight polyethylene glycol in the crystallization of RNA oligomers. Acta Cryst D. 1994;50:764–767. doi: 10.1107/S0907444994003458. [DOI] [PubMed] [Google Scholar]
- Baumeister W, Steven AC. Macromolecular electron microscopy in the era of structural genomics. Trends Biochem Sci. 2000;25:624–631. doi: 10.1016/s0968-0004(00)01720-5. [DOI] [PubMed] [Google Scholar]
- Berger I, Kang CH, Sinha N, Wolters M, Rich A. A highly efficient 24-condition matrix for the crystallization of nucleic acid fragments. Acta Cryst D. 1996;52:465–468. doi: 10.1107/s0907444995013564. [DOI] [PubMed] [Google Scholar]
- Berman HM, Olson WK, Beveridge DL, Westbrook J, Gelbin A, Demeny T, Hsieh SH, Srinivasan AR, Schneider B. The nucleic acid database: A comprehensive relational database of three-dimensional structures of nucleic acids. Biophys J. 1992;63:751–759. doi: 10.1016/S0006-3495(92)81649-1. [DOI] [PMC free article] [PubMed] [Google Scholar]
- Berman HM, Westbrook J, Feng Z, Gilliland G, Bhat TN, Weissig H, Shindyalov IN, Bourne PE. The protein data bank. Nucleic Acids Res. 2000;28:235–242. doi: 10.1093/nar/28.1.235. [DOI] [PMC free article] [PubMed] [Google Scholar]
- Binshtein E, Ohi MD. Cryo-electron microscopy and the amazing race to atomic resolution. 2015 doi: 10.1021/acs.biochem.5b00114. [DOI] [PubMed] [Google Scholar]
- Blakeley MP, Langan P, Niimura N, Podjarny A. Neutron crystallography: Opportunities, challenges and limitations. Curr Opin Struct Biol. 2008;18:593–600. doi: 10.1016/j.sbi.2008.06.009. [DOI] [PMC free article] [PubMed] [Google Scholar]
- Blundell TL, Johnson LN. Protein Crystallography. Academic Press Inc; New York: 1976. [Google Scholar]
- Bragg WL. The diffraction of short electromagnetic waves by a crystal. Proc Cambridge Philos Soc. 1913;17:43–57. [Google Scholar]
- Brunger AT. The free R value: A novel statistical quantity for assessing the accuracy of crystal structures. Nature. 1992;355:472–474. doi: 10.1038/355472a0. [DOI] [PubMed] [Google Scholar]
- Brunger AT, Adams PD. Molecular dynamics applied to X-ray structure refinement. Acc Chem Res. 2002;35:404–412. doi: 10.1021/ar010034r. [DOI] [PubMed] [Google Scholar]
- Burke JE, Butcher SE. Nucleic acid structure characterization by small angle X-ray scattering (SAXS) Curr Protoc Nucleic Acid Chem. 2012;51:7.18.1–7.18.18. doi: 10.1002/0471142700.nc0718s51. [DOI] [PMC free article] [PubMed] [Google Scholar]
- Carlon A, Ravera E, Hennig J, Parigi G, Sattler M. Improved accuracy from joint X-ray and NMR refinement of a protein-RNA complex structure. J Am Chem Soc. 2016 doi: 10.1021/jacs.5b11598. in press. [DOI] [PubMed] [Google Scholar]
- Carter CW Jr, editor. Macromolecular Crystallography, Part C Methods Enzymology. Vol. 368. Academic Press Inc; New York, NY: 2003a. [Google Scholar]
- Carter CW Jr, editor. Macromolecular Crystallography, Part D Methods Enzymology. Vol. 374. Academic Press Inc; New York, NY: 2003b. [Google Scholar]
- Carter CW Jr, Sweet RM, editors. Macromolecular Crystallography, Part A Methods Enzymology. Vol. 276. Academic Press Inc; New York, NY: 1997a. [Google Scholar]
- Carter CW, Jr, Sweet RM. Macromolecular crystallography, part B Methods Enzymology. Vol. 277. Academic Press Inc; New York, NY: 1997b. [Google Scholar]
- Casadei CM, Gumiero A, Metcalfe CL, Murphy EJ, Basran J, Concilio MG, Teixeira SC, Schrader TE, Fielding AJ, Ostermann A, Blakeley MP, Raven EL, Moody PC. Heme enzymes. Neutron cryo-crystallography captures the protonation state of ferryl heme in peroxidase. Science. 345:193–197. doi: 10.1126/science.1254398. [DOI] [PubMed] [Google Scholar]
- CCP4. The CCP4 suite: Programs for protein crystallography. Acta Cryst D. 1994;50:760–763. doi: 10.1107/S0907444994003112. [DOI] [PubMed] [Google Scholar]
- Chandonia JM, Brenner SE. The impact of structural genomics: Expectations and outcomes. Science. 2006;311:347–351. doi: 10.1126/science.1121018. [DOI] [PubMed] [Google Scholar]
- Chandrasekaran R, Stubbs G. In: International Tables for Crystallography. 2nd. Arnold E, Himmel DM, Rossmann MG, editors. F. International Union of Crystallography; 2012. pp. 583–592. Ch. 19.5. [Google Scholar]
- Chapman HN, Fromme P, Barty A, White TA, Kirian RA, Aquila A, Hunter MS, Schulz J, DePonte DP, Weierstall U, Doak RB, Maia FRNC, Martin AV, Schlichting I, Lomb L, Coppola N, Shoeman RL, Epp SW, Hartmann R, Rolles D, Rudenko A, Foucar L, Kimmel N, Weidenspointner G, Holl P, Liang M, Barthelmess M, Caleman C, Boutet S, Bogan MJ, Krzywinski J, Bostedt C, Bajt S, Gumprecht L, Rudek B, Erk B, Schmidt C, Hömke A, Reich C, Pietschner D, Strüder L, Hauser G, Gorke H, Ullrich J, Herrmann S, Schaller G, Schopper F, Soltau H, Kühnel KU, Messerschmidt M, Bozek JD, Hau-Riege SP, Frank M, Hampton CY, Sierra RG, Starodub D, Williams GJ, Hajdu J, Timneanu N, Seibert MM, Andreasson J, Rocker A, Jönsson O, Svenda M, Stern S, Nass K, Andritschke R, Schröter CD, Krasniqi F, Bott M, Schmidt KE, Wang X, Grotjohann I, Holton JM, Barends TRM, Neutze R, Marchesini S, Fromme R, Schorb S, Rupp D, Adolph M, Gorkhover T, Andersson I, Hirsemann H, Potdevin G, Graafsma H, Nilsson B, Spence JCH. Femtosecond X-ray protein nanocrystallography. Nature. 2011;470:73–77. doi: 10.1038/nature09750. [DOI] [PMC free article] [PubMed] [Google Scholar]
- Chatake T, Tanaka I, Umino H, Arai S, Niimura N. The hydration structure of a Z-DNA hexameric duplex determined by a neutron diffraction technique. Acta Cryst D. 2005;61:1088–1098. doi: 10.1107/S0907444905015581. [DOI] [PubMed] [Google Scholar]
- Chiu W, Burnett RM, Garcea RL, editors. Structural Biology of Viruses. Oxford University Press; Oxford, UK: 1997. [Google Scholar]
- Coates L, Stoica AD, Hoffmann C, Richards J, Cooper R. The macromolecular neutron diffractometer (MaNDi) at the Spallation Neutron Source, Oak Ridge: enhanced optics, high-resolution neutron detectors and simulated diffraction. J Appl Cryst. 2010;43:570–577. [Google Scholar]
- Collins KD. Ions from the Hofmeister series and osmolytes: effects on proteins in solution and in the crystallization process. Methods. 2004;34:300–311. doi: 10.1016/j.ymeth.2004.03.021. [DOI] [PubMed] [Google Scholar]
- Conn GL, Gittis AG, Lattman EE, Misra VK, Draper DE. A compact RNA tertiary structure contains a buried backbone – K+ complex. J Mol Biol. 2002;318:963–973. doi: 10.1016/S0022-2836(02)00147-X. [DOI] [PubMed] [Google Scholar]
- Czepas J, Devedjiev Y, Krowarsch D, Derewenda U, Otlewski J, Derewenda ZS. The impact of Lys→Arg surface mutations on the crystallization of the globular domain of RhoGDI. Acta Cryst D. 2004;60:275–280. doi: 10.1107/S0907444903026271. [DOI] [PubMed] [Google Scholar]
- Dafforn TR. So how do you know you have a macromolecular complex? Acta Cryst D. 2007;63:17–25. doi: 10.1107/S0907444906047044. [DOI] [PMC free article] [PubMed] [Google Scholar]
- Dong A, Xu X, Edwards AM, Midwest Center for Structural Genomics; Structural Genomics Consortium. Chang C, Chruszcz M, Cuff M, Cymborowski M, Di Leo R, Egorova O, Evdokimova E, Filippova E, Gu J, Guthrie J, Ignatchenko A, Joachimiak A, Klostermann N, Kim Y, Korniyenko Y, Minor W, Que Q, Savchenko A, Skarina T, Tan K, Yakunin A, Yee A, Yim V, Zhang R, Zheng H, Akutsu M, Arrowsmith C, Avvakumov GV, Bochkarev A, Dahlgren LG, Dhe-Paganon S, Dimov S, Dombrovski L, Finerty P, Jr, Flodin S, Flores A, Gräslund S, Hammerström M, Herman MD, Hong BS, Hui R, Johansson I, Liu Y, Nilsson M, Nedyalkova L, Nordlund P, Nyman T, Min J, Ouyang H, Park HW, Qi C, Rabeh W, Shen L, Shen Y, Sukumard D, Tempel W, Tong Y, Tresagues L, Vedadi M, Walker JR, Weigelt J, Welin M, Wu H, Xiao T, Zeng H, Zhu H. In situ proteolysis for protein crystallization and structure determination. Nat Methods. 2007;4:1019–1021. doi: 10.1038/nmeth1118. [DOI] [PMC free article] [PubMed] [Google Scholar]
- Doublié S. Preparation of selenomethionyl proteins for phase determination. Methods Enzymol. 1997;276:523–530. [PubMed] [Google Scholar]
- Doublié S, editor. Methods in Molecular Biology. Vol. 363. Humana Press Inc; Totowa, NJ: 2007a. Macromolecular Crystallography Protocols. Vol. 1: Preparation and Crystallization of Macromolecules. [Google Scholar]
- Doublié S. Methods in Molecular Biology. Vol. 363. Humana Press Inc; Totowa, NJ: 2007b. Macromolecular Crystallography Protocols. Vol. 2: Structure Determination. [Google Scholar]
- Doudna JA, Grosshans C, Gooding A, Kundrot CE. Crystallization of ribozymes and small RNA motifs by a sparse matrix approach. Proc Natl Acad Sci USA. 1993;90:7829–7833. doi: 10.1073/pnas.90.16.7829. [DOI] [PMC free article] [PubMed] [Google Scholar]
- Drenth J, editor. Principles of Protein X-Ray Crystallography. 3rd. Springer Science and Business Media LLC; New York: 2007. [Google Scholar]
- Ducruix A, Giegé R, editors. Crystallization of Nucleic Acids and Proteins: A Practical Approach. 2nd. Oxford University Press; Oxford, UK: 1999. [Google Scholar]
- Egli M. Structural and biophysical methods to analyze clock function and mechanism. In: Seghal A, editor. Meth Enzymol. Vol. 551. Elsevier; Kidlington, Oxford, UK: 2015. pp. 223–266. [DOI] [PubMed] [Google Scholar]
- Egli M, Johnson CH. Biochemistry that times the day. Perspective to the current topic collection of circadian clock papers. Biochemistry. 2015;54:104–109. doi: 10.1021/bi5014968. [DOI] [PMC free article] [PubMed] [Google Scholar]
- Emsley P, Cowtan K. Coot: model-building tools for molecular graphics. Acta Cryst D. 2004;60:2126–2132. doi: 10.1107/S0907444904019158. [DOI] [PubMed] [Google Scholar]
- Ennifar E, editor. Nucleic Acid Crystallography: Methods and Protocols Methods in Molecular Biology. Vol. 1320. Humana Press, Springer Science and Business Media; New York, NY: 2015. [Google Scholar]
- Fenn TD, Schnieders MJ, Mustyakimov M, Wu C, Langan P, Pande VS, Brunger AT. Reintroducing electrostatics into macromolecular crystallographic refinement: application to neutron crystallography and DNA hydration. Structure. 2011;19:523–533. doi: 10.1016/j.str.2011.01.015. [DOI] [PMC free article] [PubMed] [Google Scholar]
- Ferré-D’Amaré AR, Zhou K, Doudna JM. A general module for RNA crystallization. J Mol Biol. 1998a;279:621–631. doi: 10.1006/jmbi.1998.1789. [DOI] [PubMed] [Google Scholar]
- Ferré-D’Amaré AR, Zhou K, Doudna JM. Crystal structure of a hepatitis delta virus ribozyme. Nature. 1998b;395:567–574. doi: 10.1038/26912. [DOI] [PubMed] [Google Scholar]
- Friedrich W, Knipping P, von Laue M. Interferenz-Erscheinungen bei Röntgenstrahlen. Sitzungsber Kgl Bayer Akad Wiss. 1912:303–322. [Google Scholar]
- Fromme P. Leading-edge lasers. Nature. 2014;505:620–621. doi: 10.1038/505620a. [DOI] [PMC free article] [PubMed] [Google Scholar]
- Gabanyi MJ, Adams PD, Arnold K, Bordoli L, Carter LG, Flippen-Andersen J, Gifford L, Haas J, Kouranov A, McLaughlin WA, Micallef DI, Minor W, Shah R, Schwede T, Tao YP, Westbrook JD, Zimmerman M, Berman HM. The Structural Biology Knowledgebase: a portal to protein structures, sequences, functions, and methods. J Struct Funct Genomics. 2011;12:45–54. doi: 10.1007/s10969-011-9106-2. [DOI] [PMC free article] [PubMed] [Google Scholar]
- Gait MJ, editor. Oligonucleotide synthesis: A practical approach. IRL Press Ltd; Oxford, UK: 1984. [Google Scholar]
- Gallat FX, Matsugaki N, Coussens NP, Yagi KJ, Boudes M, Higashi T, Tsuji D, Tatano Y, Suzuki M, Mizohata E, Tono K, Joti Y, Kameshima T, Park J, Song C, Hatsui T, Yabashi M, Nango E, Itoh K, Coulibaly F, Tobe S, Ramaswamy S, Stay B, Iwata S, Chavas LMG. In vivo crystallography at X-ray free-electron lasers: the next generation of structural biology. Phil Trans R Soc B. 2014;369:20130497. doi: 10.1098/rstb.2013.0497. [DOI] [PMC free article] [PubMed] [Google Scholar]
- Garman EF, Murray JW. Heavy-atom derivatization. Acta Cryst D. 2003;59:1903–1913. doi: 10.1107/s0907444903012794. [DOI] [PubMed] [Google Scholar]
- Garman EF, Owen RL. Cryocooling and radiation damage in macromolecular crystallography. Acta Cryst D. 2006;62:32–47. doi: 10.1107/S0907444905034207. [DOI] [PubMed] [Google Scholar]
- Hajdu J. Single-molecule X-ray diffraction. Curr Opin Struct Biol. 2000;10:569–573. doi: 10.1016/s0959-440x(00)00133-0. [DOI] [PubMed] [Google Scholar]
- Hanson BL, Langan P, Katz A, Li X, Harp JM, Glusker JP, Schoenborn BP, Bunick GJ. A preliminary time-of-flight neutron diffraction study of S. rubiginosus D-xylose isomerase. Acta Cryst D. 2004;60:241–249. doi: 10.1107/S0907444903025873. [DOI] [PubMed] [Google Scholar]
- Harp JM, Timm DE, Bunick GJ. Macromolecular crystal annealing: overcoming increased mosaicity associated with cryocrystallography. Acta Cryst D. 1998;54:622–628. doi: 10.1107/s0907444997019008. [DOI] [PubMed] [Google Scholar]
- Helliwell JR. Macromolecular crystallography with synchrotron radiation. Cambridge University Press; Cambridge, UK: 1992. [Google Scholar]
- Hendrickson WA. Synchrotron crystallography. Trends Biochem Sci. 2000;25:637–643. doi: 10.1016/s0968-0004(00)01721-7. [DOI] [PubMed] [Google Scholar]
- Hendrickson WA, Horton JR, LeMaster DM. Selenomethionyl proteins produced for analysis by multiwavelength anomalous diffraction (MAD): A vehicle for direct determination of three-dimensional structure. EMBO J. 1990;9:1665–1672. doi: 10.1002/j.1460-2075.1990.tb08287.x. [DOI] [PMC free article] [PubMed] [Google Scholar]
- Holbrook SR, Kim SH. Crystallization and heavy-atom derivatives of polynucleotides. Methods Enzymol. 1985;114:167–176. doi: 10.1016/0076-6879(85)14017-6. [DOI] [PubMed] [Google Scholar]
- Hura GL, Budworth H, Dyer KN, Rambo RP, Hammel M, McMurray CT, Tainer JA. Comprehensive macromolecular conformations mapped by quantitative SAXS analyses. Nat Methods. 2013;10:453–454. doi: 10.1038/nmeth.2453. [DOI] [PMC free article] [PubMed] [Google Scholar]
- Jancarik J, Kim SH. Sparse matrix sampling: A screening method for crystallization of proteins. J Appl Cryst. 1991;24:409–411. [Google Scholar]
- Johnson CH, Egli M, Stewart PL. Structural insights into a circadian oscillator. Science. 2008;322:697–701. doi: 10.1126/science.1150451. [DOI] [PMC free article] [PubMed] [Google Scholar]
- Kang Y, Zhou XE, Gao X, He Y, Liu W, Ishchenko A, Barty A, White TA, Yefanov O, Han GW, Xu Q, de Waal PW, Ke J, Tan MH, Zhang C, Moeller A, West GM, Pascal BD, Van Eps N, Caro LN, Vishnivetskiy SA, Lee RJ, Suino-Powell KM, Gu X, Pal K, Ma J, Zhi X, Boutet S, Williams GJ, Messerschmidt M, Gati C, Zatsepin NA, Wang D, James D, Basu S, Roy-Chowdhury S, Conrad CE, Coe J, Liu H, Lisova S, Kupitz C, Grotjohann I, Fromme R, Jiang Y, Tan M, Yang H, Li J, Wang M, Zheng Z, Li D, Howe N, Zhao Y, Standfuss J, Diederichs K, Dong Y, Potter CS, Carragher B, Caffrey M, Jiang H, Chapman HN, Spence JC, Fromme P, Weierstall U, Ernst OP, Katritch V, Gurevich VV, Griffin PR, Hubbell WL, Stevens RC, Cherezov V, Melcher K, Xu HE. Crystal structure of rhodopsin bound to arrestin by femtosecond X-ray laser. Nature. 2015;523:561–567. doi: 10.1038/nature14656. [DOI] [PMC free article] [PubMed] [Google Scholar]
- Kato T, Goodman RP, Erben CM, Turberfield AJ, Namba K. High-resolution structural analysis of a DNA nanostructure by cryoEM. Nano Lett. 2009;9:2747–2750. doi: 10.1021/nl901265n. [DOI] [PubMed] [Google Scholar]
- Keel AY, Rambo RP, Batey RT, Kieft JS. A general strategy to solve the phase problem in RNA crystallography. Structure. 2007;15:761–772. doi: 10.1016/j.str.2007.06.003. [DOI] [PMC free article] [PubMed] [Google Scholar]
- Keeler J. Understanding NMR spectroscopy. 2nd. John Wiley & Sons; Hoboken, N.J.: 2011. [Google Scholar]
- Kemp M. The Mona Lisa of modern science. Nature. 2003;421:416–420. doi: 10.1038/nature01403. [DOI] [PubMed] [Google Scholar]
- Kim SH, Shin WC, Warrant RW. Heavy metal ion-nucleic acid interaction. Methods Enzymol. 1985;114:156–167. doi: 10.1016/0076-6879(85)14016-4. [DOI] [PubMed] [Google Scholar]
- Konermann L, Pan J, Liu YH. Hydrogen exchange mass spectrometry for studying protein structure and dynamics. Chem Soc Rev. 2011;40:1224–1234. doi: 10.1039/c0cs00113a. [DOI] [PubMed] [Google Scholar]
- Leal RMF, Callow S, Callow P, Blakeley MP, Cardin CJ, Denny WA, Teixeira SCM, Mitchell EP, Forsyth VT. Combined neutron and X-ray diffraction studies of DNA in crystals and solution. Acta Cryst D. 2010;66:1244–1248. doi: 10.1107/S0907444910017713. [DOI] [PubMed] [Google Scholar]
- Lei L, Egli M. In situ proteolysis for crystallization of membrane-bound cytochrome P450 17A1 and 17A2 proteins from zebrafish. Curr Protoc Protein Sci. 2016 doi: 10.1002/0471140864.ps2916s84. in press. [DOI] [PMC free article] [PubMed] [Google Scholar]
- Lilley DMJ, Wilson TJ. Fluorescence resonance energy transfer as a structural tool for nucleic acids. Curr Opin Chem Biol. 2000;4:507–517. doi: 10.1016/s1367-5931(00)00124-1. [DOI] [PubMed] [Google Scholar]
- Liu H, Jin L, Koh SB, Atanasov I, Schein S, Zhou ZH. Atomic structure of human adenovirus by cryo-EM reveals interactions among protein networks. Science. 2010;329:1038–1043. doi: 10.1126/science.1187433. [DOI] [PMC free article] [PubMed] [Google Scholar]
- Lovell SC, Davis IW, Arendall WB, III, de Bakker PIW, Word JM, Prisant MG, Richardson JS, Richardson DC. Structure validation by Calpha geometry: phi,psi and Cbeta deviation. Proteins Struct Funct Genet. 2003;50:437–450. doi: 10.1002/prot.10286. [DOI] [PubMed] [Google Scholar]
- Mchaourab HS, Steed PR, Kazmier K. Protein structure: insight into dynamics from spin-labeling EPR spectroscopy. Stucture. 2012;19:1549–1561. doi: 10.1016/j.str.2011.10.009. [DOI] [PMC free article] [PubMed] [Google Scholar]
- McPherson A. Crystallization of Biological Macromolecules. Cold Spring Harbor Laboratory Press; Cold Spring Harbor N.Y.: 1998. [Google Scholar]
- McRee DE. Practical Protein Crystallography. 2nd. Academic Press Inc; San Diego, Calif: 1999. [Google Scholar]
- McSweeney S. Sophisticated synchrotrons. Nature. 2014;505:620. doi: 10.1038/505620a. [DOI] [PMC free article] [PubMed] [Google Scholar]
- Milligan JF, Uhlenbeck OC. Synthesis of small RNAs using T7 RNA-polymerase. Methods Enzymol. 1989;180:51–62. doi: 10.1016/0076-6879(89)80091-6. [DOI] [PubMed] [Google Scholar]
- Moffat K. Time-resolved crystallography and protein design: signalling photoreceptors and optogenetics. Phil Trans R Soc B. 2014;369:20130568. doi: 10.1098/rstb.2013.0568. [DOI] [PMC free article] [PubMed] [Google Scholar]
- Murshudov GN, Vagin AA, Dodson EJ. Refinement of macromolecular structures by the maximum-likelihood method. Acta Cryst D. 1999;53:240–255. doi: 10.1107/S0907444996012255. [DOI] [PubMed] [Google Scholar]
- Narayanan BC, Westbrook J, Ghosh S, Petrov AI, Sweeney B, Zirbel CL, Leontis NB, Berman HM. The Nucleic Acid Database: new features and capabilities. Nucleic Acids Res. 2013;42:D114–122. doi: 10.1093/nar/gkt980. [DOI] [PMC free article] [PubMed] [Google Scholar]
- Pallan PS, Egli M. Selenium modification of nucleic acids. Preparation of phosphoroselenoate derivatives for crystallographic phasing of nucleic acid structures. Nat Protocols. 2007a;2:640–646. doi: 10.1038/nprot.2007.74. [DOI] [PubMed] [Google Scholar]
- Pallan PS, Egli M. Selenium modification of nucleic acids. Preparation of oligonucleotides with incorporated 2´-SeMe-uridine for crystallographic phasing of nucleic acid structures. Nat Protocols. 2007b;2:647–651. doi: 10.1038/nprot.2007.75. [DOI] [PubMed] [Google Scholar]
- Pallan PS, Wang X, Lei L, Yoshimoto FK, Auchus RJ, Waterman MR, Guengerich FP, Egli M. Human cytochrome P450 21A2, the major steroid 21-hydroxylase. Structure of the enzyme•progesterone substrate complex and rate-limiting C-H bond cleavage. J Biol Chem. 2015;290:13128–13143. doi: 10.1074/jbc.M115.646307. [DOI] [PMC free article] [PubMed] [Google Scholar]
- Pattanayek R, Williams DR, Rossi G, Weigand S, Mori T, Johnson CH, Stewart PL, Egli M. Combined SAXS/EM based models of the S. elongatus post-translational circadian oscillator and its interactions with the output His-kinase SasA. PLoS One. 2011;6:e23697. doi: 10.1371/journal.pone.0023697. [DOI] [PMC free article] [PubMed] [Google Scholar]
- Pattanayek R, Egli M. Protein-protein interactions in the cyanobacterial circadian clock: structure of KaiA dimer in complex with C-terminal KaiC peptides at 2.8 Å resolution. Biochemistry. 2015;54:4575–4578. doi: 10.1021/acs.biochem.5b00694. [DOI] [PubMed] [Google Scholar]
- Petsko GA. Preparation of isomporphous heavy-atom derivatives. Methods Enzymol. 1985;114:147–156. doi: 10.1016/0076-6879(85)14015-2. [DOI] [PubMed] [Google Scholar]
- Pitsch S, Weiss PA, Jenny L, Stutz A, Wu X. Reliable chemical synthesis of oligoribonucleotides (RNA) with 2´-O-[(triisopropylsilyl)oxy]methyl (2´-O-tom) protected phosphoramidites. Helv Chim Acta. 2001;84:3773–3795. [Google Scholar]
- Potrzebowski W, André I. Automated determination of fibrillar structures by simultaneous model building and fiber diffraction refinement. Nat Methods. 2015;12:697–684. doi: 10.1038/nmeth.3399. [DOI] [PubMed] [Google Scholar]
- Putnam CD, Hammel M, Hura GL, Tainer JA. X-ray solution scattering (SAXS) combined with crystallography and computation: defining accurate macromolecular structures, conformations and assemblies in solution. Q Rev Biophys. 2007;40:191–285. doi: 10.1017/S0033583507004635. [DOI] [PubMed] [Google Scholar]
- Radaev S, Sun PD. Crystallization of protein-protein complexes. J Appl Cryst. 2002;35:674–676. [Google Scholar]
- Rasmussen SG, Choi HJ, Rosenbaum DM, Kobilka TS, Thian FS, Edwards PC, Burghammer M, Ratnala VR, Sanishvili R, Fischetti RF, Schertler GF, Weis WI, Kobilka BK. Crystal structure of the human beta2 adrenergic G-protein-coupled receptor. Nature. 2007;450:383–387. doi: 10.1038/nature06325. [DOI] [PubMed] [Google Scholar]
- Reddy VS, Natchiar SK, Stewart PL, Nemerov GR. Crystal structure of human adenovirus at 3.5 Å resolution. Science. 2010;329:1071–1075. doi: 10.1126/science.1187292. [DOI] [PMC free article] [PubMed] [Google Scholar]
- Reddy VS, Nemerow GR. Structures and organization of adenovirus cement proteins provide insights into the role of capsid maturation in virus entry and infection. Proc Natl Acad Sci USA. 2014;111:11715–11720. doi: 10.1073/pnas.1408462111. [DOI] [PMC free article] [PubMed] [Google Scholar]
- Rhodes G. Crystallography Made Crystal Clear: A Guide for Users of Macromolecular Models. 3rd. Academic Press Inc; San Diego: 2006. [Google Scholar]
- Ringe D, Petsko GA. A consumer’s guide to protein crystallography. In: Carey PR, editor. Protein Engineering and Design. Academic Press Inc; San Diego: 1996. pp. 205–229. [Google Scholar]
- Rodriguez JA, Ivanova M, Sawaya MR, Cascio D, Reyes F, Shi D, Johnson L, Guenther E, Sangwan S, Hattne J, Nannenga B, Brewster AS, Messerschmidt M, Boutet S, Sauter NK, Gonen T, Eisenberg DS. Structure of the amyloid forming segment, GAVVTGVTAVA, from the NAC domain of Parkinson’s disease protein alpha-synuclein, residues 68–78, determined by electron diffraction. Nature. 2015;525:486–490. doi: 10.1038/nature15368. [DOI] [PMC free article] [PubMed] [Google Scholar]
- Romainczyk O, Elduque X, Engels JW. Attachment of nitroxide spin labels to nucleic acids for EPR. Curr Protoc Nucleic Acid Chem. 2012;49:7.17.1–7.17.40. doi: 10.1002/0471142700.nc0717s49. [DOI] [PubMed] [Google Scholar]
- Rose PW, Prlic A, Bi C, Bluhm WF, Christie CH, Dutta S, Green RK, Goodsell DS, Westbrook JD, Woo J, Young J, Zardecki C, Berman HM, Bourne PE, Burley SK. The RCSB Protein Data Bank: views of structural biology for basic and applied research and education. Nucleic Acids Res. 2015;43:D345–356. doi: 10.1093/nar/gku1214. [DOI] [PMC free article] [PubMed] [Google Scholar]
- Rould MA. Screening for heavy-atom derivatives and obtaining accurate isomorphous differences. Methods Enzymol. 1997;276:461–472. doi: 10.1016/S0076-6879(97)76072-5. [DOI] [PubMed] [Google Scholar]
- Rupp B. Biomolecular Crystallography. 1st. Garland Science; New York, NY: 2010. [Google Scholar]
- Saibil HR. Macromolecular structure determination by cryo-electron microscopy. Acta Cryst D. 2000;56:1215–1222. doi: 10.1107/s0907444900010787. [DOI] [PubMed] [Google Scholar]
- Scaringe SA, Francklyn C, Usman N. Chemical synthesis of biologically active oligoribonucleotides using β-cyanoethyl protected ribonucleoside phosphoramidites. Nucleic Acids Res. 1990;18:5433–5441. doi: 10.1093/nar/18.18.5433. [DOI] [PMC free article] [PubMed] [Google Scholar]
- Scaringe SA, Wincott FE, Caruthers MH. Novel RNA synthesis method using 5´-silyl-2´-orthoester protecting groups. J Am Chem Soc. 1998;120:11820–11821. [Google Scholar]
- Schneidman-Duhovny D, Rossi A, Avila-Sakar A, Kim SJ, Velazquez-Muriel J, Strop P, Liang H, Krukenberg KA, Liao M, Kim HM, Sobhanifar S, Dötsch V, Rajpal A, Pons J, Agard DA, Cheng Y, Sali A. A method for integrative structure determination of protein-protein complexes. Bioinformatics. 2012;28:3282–3289. doi: 10.1093/bioinformatics/bts628. [DOI] [PMC free article] [PubMed] [Google Scholar]
- Schuler B, Eaton WA. Protein folding studied by single-molecule FRET. Curr Opin Struct Biol. 2008;18:16–26. doi: 10.1016/j.sbi.2007.12.003. [DOI] [PMC free article] [PubMed] [Google Scholar]
- Scott WG, Finch JT, Grenfell R, Fogg J, Smith T, Gait MJ, Klug A. Rapid crystallization of chemically synthesized hammerhead RNAs using a double screening procedure. J Mol Biol. 1995;250:327–332. doi: 10.1006/jmbi.1995.0380. [DOI] [PubMed] [Google Scholar]
- Sheldrick GM. Experimental phasing with SHELXC/D/E: combining chain tracing with density modification. Acta Cryst D. 2010;66:479–485. doi: 10.1107/S0907444909038360. [DOI] [PMC free article] [PubMed] [Google Scholar]
- Smyth DR, Mrozkiewicz MK, McGrath WJ, Listwan P, Kobe B. Crystal structures of fusion proteins with large-affinity tags. Protein Sci. 2003;12:1313–1322. doi: 10.1110/ps.0243403. [DOI] [PMC free article] [PubMed] [Google Scholar]
- Southworth DR, Agard DA. Client-loading conformation of the Hsp90 molecular chaperone revealed in the cryo-EM structure of the human Hsp90:Hop complex. Mol Cell. 2011;42:771–781. doi: 10.1016/j.molcel.2011.04.023. [DOI] [PMC free article] [PubMed] [Google Scholar]
- Spence JCH. X-ray lasers and crystallography. IUCrJ. 2014;1:151–152. doi: 10.1107/S2052252514009567. [DOI] [PMC free article] [PubMed] [Google Scholar]
- Szulik MW, Voehler M, Stone MP. NMR analysis of base-pair opening kinetics in DNA. Curr Protoc Nucleic Acid Chem. 2014;59:7.20.1–7.20.18. doi: 10.1002/0471142700.nc0720s59. [DOI] [PMC free article] [PubMed] [Google Scholar]
- Structural Genomics Consortia. Protein production and purification. Nat Methods. 2008;5:135–146. doi: 10.1038/nmeth.f.202. [DOI] [PMC free article] [PubMed] [Google Scholar]
- Tereshko V, Wilds CJ, Minasov G, Prakash TP, Maier MA, Howard A, Wawrzak Z, Manoharan M, Egli M. Detection of alkali metal ions in DNA crystals using state-of-the-art X-ray diffraction experiments. Nucleic Acids Res. 2001;29:1208–1215. doi: 10.1093/nar/29.5.1208. [DOI] [PMC free article] [PubMed] [Google Scholar]
- Terwilliger TC, Berendzen J. Automated MAD and MIR structure solution. Acta Cryst D. 1999;55:849–861. doi: 10.1107/S0907444999000839. [DOI] [PMC free article] [PubMed] [Google Scholar]
- Terwilliger TC, Stuart D, Yokoyama S. Lessons from structural genomics. Annu Rev Biophys. 2009;38:371–383. doi: 10.1146/annurev.biophys.050708.133740. [DOI] [PMC free article] [PubMed] [Google Scholar]
- Tsuruta H, Irving TC. Experimental approaches for solution X-ray scattering and fiber diffraction. Curr Opin Struct Biol. 2008;18:601–608. doi: 10.1016/j.sbi.2008.08.002. [DOI] [PMC free article] [PubMed] [Google Scholar]
- Weeks CM, Adams PD, Berendzen J, Brunger AT, Dodson EJ, Grosse-Kunstleve RW, Schneider TR, Sheldrick GM, Terwilliger TC, Turkenburg MG, Uson I. Automatic solution of heavy-atom substructures. Methods Enzymol. 2003;374:37–83. doi: 10.1016/S0076-6879(03)74003-8. [DOI] [PubMed] [Google Scholar]
- Wilds CJ, Pattanayek R, Pan C, Wawrzak Z, Egli M. Selenium-assisted nucleic acid crystallography: Use of DNA phosphoroselenoates for MAD phasing. J Am Chem Soc. 2002;124:14910–14916. doi: 10.1021/ja021058b. [DOI] [PubMed] [Google Scholar]
- Wilkins SW. Celebrating 100 years of X-ray crystallography. Acta Cryst A. 2013;69:1–4. [Google Scholar]
- Wincott F, DiRenzo A, Shaffer C, Grimm S, Tracz D, Workman C, Sweedler D, Gonzalez C, Scaringe S, Usman N. Synthesis, deprotection, analysis and purification of RNA and ribozymes. Nucleic Acids Res. 1995;23:2677–2684. doi: 10.1093/nar/23.14.2677. [DOI] [PMC free article] [PubMed] [Google Scholar]
- Woolfson MM. An Introduction to X-ray Crystallography. 2nd. Cambridge University Press; Cambridge: 1997. [Google Scholar]
- Wüthrich K. NMR of Proteins and Nucleic Acids. 1st. John Wiley & Sons; New York: 1986. [Google Scholar]
- Wyatt JR, Chastain M, Puglisi JD. Synthesis and purification of large amounts of RNA oligonucleotides. Bio Techniques. 1991;11:764–769. [PubMed] [Google Scholar]
- Zauberman N, Mutsafi Y, Ben Halevy D, Shimoni E, Klein E, Xiao C, Sun S, Minsky A. Distinct DNA exit and packaging portals in the virus Acanthamoeba polyphaga mimivirus. PLoS Biol. 2008;6:e114. doi: 10.1371/journal.pbio.0060114. [DOI] [PMC free article] [PubMed] [Google Scholar]
- Zhou ZH. Towards atomic resolution structural determination by single-particle cryo-electron microscopy. Curr Opin Struct Biol. 2008;18:218–228. doi: 10.1016/j.sbi.2008.03.004. [DOI] [PMC free article] [PubMed] [Google Scholar]


