

Abstract
Diurnal oscillations in the expression of antioxidant genes imply that protection against oxidative stress is circadian-gated. We hypothesized that stabilization of the core circadian gene Rev-erbα (Nr1d1) improves cellular bioenergetics and protects against nutrient deprivation and oxidative stress. Compared to WT, mouse lung fibroblasts (MLG) stably transfected with a degradation resistant Rev-erbα (Ser55/59 to Asp; hence referred to as SD) had 40% higher protein content, 1.5-fold higher mitochondrial area (confocal microscopy), doubled oxidative phosphorylation by high-resolution respirometry (Oroboros) and were resistant to glucose deprivation for 24h. This resulted from a 4-fold reduction in mitophagy (L3CB co-localized with MitoTracker Red) vs WT. Although PGC1α protein expression was comparable between SD and WT MLG cells, the role of mitochondrial biogenesis in explaining increased mitochondrial mass in SD cells was less clear. Embryonic fibroblasts (MEF) from C57Bl/6-SD transgenic mice, had a 9-fold induction of FoxO1 mRNA and increased mRNA of downstream antioxidant targets heme oxygenase-1 (HO-1), Mn superoxide dismutase and catalase (1.5, 2 fold and 2 fold respectively) vs WT. This allowed the SD cells to survive 1h incubation with 500 μM H2O2 as well as 24hrs of exposure to 95% O2 and remain attached whereas most WT cells did not. These observations establish a mechanistic link between the metabolic functions of Rev-erbα with mitochondrial homeostasis and protection against oxidative stress.
Keywords: Peroxisome proliferator- activated receptor gamma coactivator 1- alpha (PGC- 1α)(PPARGC1A), NR1D1, mitochondria, oxidative stress, circadian, energy metabolism, bioenergetics, preconditioning
Graphical abstract

Introduction
Circadian rhythmicity developed early in evolution as a means for organisms to adapt to their environment(1–3). This anticipatory system predicts fluctuations in nutrient availability and oscillations in oxidative stress, evoking rhythms in physiology that improves overall survival. Disruption of this rhythm is associated with many diseases such as metabolic syndrome, obesity, depression, cardiovascular diseases and cancers (4–7). These diseases affect multiple organs and are characterized by chronic dysregulation that culminates in heightened susceptibility to stressors and maladaptation to environmental insults.
At the cellular level, the circadian machinery is organized into transcriptional-translational interconnected feedback loops involving core circadian genes (8, 9). These genes control many vital cellular functions such as the redox state (10–13), metabolism and proliferation (14, 15), with approximately 10–20% of the transcriptome thought to be under circadian control (16, 17). The circadian rhythm, through both transcriptional and post-translational mechanisms (18), also controls mitochondrial respiration and thus synchronizes oxidative metabolic pathways with the 24-hour feeding and fasting cycle (19).
Rev-erbα (Nr1d1) is a core circadian gene that exerts its effect by repressing transcription (20, 21). In addition to regulation of the clock, Rev-erbα also targets a large number of genes involved in metabolism and cell survival (15, 21–23). We have previously shown that Rev-erbα is regulated by oxidative stress and inflammation (24). However, the role of Rev-erbα in responding to the environmental insults, such as oxidative stress is not known. Rev-erbα deficiency in skeletal muscle, but not in hepatic cells, is associated with poor mitochondrial function (25). Mitochondrial dysfunction is the convergence point of injury in many diseases (26, 27). For example, exposure to hyperoxia and mechanical ventilation leads to mitochondrial dysfunction in the neonatal lung (28, 29). We hypothesized that Rev-erbα controls cellular homeostasis through preservation of mitochondrial function and cell metabolism, thereby enabling the organism to withstand oxidative and environmental stress.
Here, using mouse lung fibroblasts in which Rev-erbα is stabilized by preventing ubiquitin-mediated proteasomal degradation (referred to as SD cells), we show that Rev-erbα enhances mitochondrial function and preconditions cells to better handle nutrient deprivation and oxidative stress. Although circadian gene regulation is organ/tissue specific (30, 31), fibroblasts are ubiquitously present and allow us to study the effect of Rev-erbα on mitochondrial function in most tissues.
Material and Methods
Cell lines and Culture
Cell Lines
MLG cells
Neonatal mouse lung fibroblasts (MLG) were obtained from American Type Culture Collection (Manassas, VA, USA) and maintained as described(24).
SD cells
Mouse lung fibroblasts cells were stably transfected with a Tet-Off system expressing ectopic wild-type (WT) or degradation resistant 55/59SD mutant Rev-erbα (referred to as SD; Kind gift of MA Lazar, University of Pennsylvania) as described (32, 33). In short, Tet-off vectors were transiently transfected into the MLG cells using lipofectamine 2000 (Invitrogen, Carisbad, CA, USA) and selected with 500 μg/ml G418 (Invitrogen) for a week. Positive clones were subsequently transfected with pTRE (Tertracycline Responsive Element) Rev-erbα and selected with 200 μg/ml hygromycin (Roche Applied Science; Indianapolis, IN) for 2 weeks. Induction of Rev-erbα was verified by immunoblot (Figure 1A). Cells were maintained in 10% FBS, 1%AA, 100 μg/ml hygromycin, and 200 μg/ml G418 and were discarded after 10 passages.
Figure 1. Rev-erbα stabilized (SD) cells overexpress Rev-erbα protein and downregulate the key target gene Bmal1.
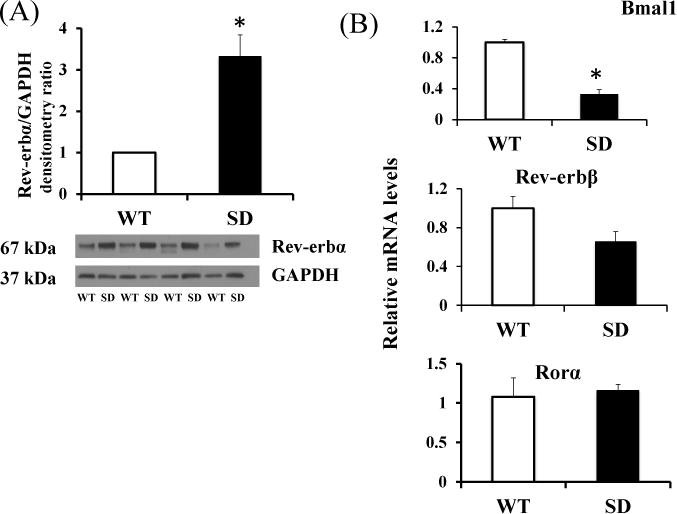
(A) Densitometric analysis of Rev-erbα protein expression of SD or WT mouse lung fibroblasts (MLG) [normalized to GAPDH as loading control] (n=4 independent experiments)
(B) mRNA levels (n=3 independent experiments) of core circadian genes Bmal1 (primary target of Rev-erbα), Rev-erbβ and Rorα in WT and SD MLG cells. *p<0.05 by t-test.
Data expressed as mean ± SEM.
Stabilized Rev-erbα (SD) and WT MEF cells
Primary embryonic fibroblasts were prepared from E13.5 wild type and Rev-erbα stabilized (SD) [kind gift of MA Lazar, University of Pennsylvania] embryos using standard protocols and maintained in Dulbecco’s modified Eagle’s medium (DMEM)-F12 with 10% fetal bovine serum (FBS; Life technologies, Grand Island, NY, USA) at 37°C in 5% CO2. They were immortalized using SV40 vector. All experiments were done using cells in passages earlier than p10.
Nutrient deprivation
Cells were grown to 60–70% confluence and then cultured in either standard DMEM [Gibco, Life technologies # 10569-010 Grand Island, NY, USA] or in glucose free media or glucose, pyruvate and glutamine free media with 10% FBS and 1% antibiotics (Pen/Strep). For glucose free media only, glucose and pyruvate free media [Gibco, Life technologies #11966-025, Grand Island, NY, USA] was used and sodium pyruvate added back to make a final concentration of 110mg/L. For glucose, pyruvate and glutamine deprivation, DMEM devoid of glucose, pyruvate and glutamine was used (Gibco, Life technologies #A14430-01, Grand Island, NY, USA). All images were processed and analyzed using freely available FIJI/ImageJ software (34). Both cell types were cultured in standard media to comparable confluence and washed with PBS prior to be initiating the deprivation experiments.
Determination of cellular respiration
High-resolution respirometry was performed with WT and SD intact MLG cells using Oxygraph-2K (Oroboros Instruments Corp, Innsbruck, Austria, USA) as described(35). WT and SD MLG cells were harvested with trypsin. Basal respiration was measured at 37°C in culture medium (DMEM). Thereafter, inhibitors for the different mitochondrial respiratory complexes were added to the cells in the following order: (1) oligomycin (2 μg/ml) (Sigma) to inhibit complex V (ATP synthase) and to measure mitochondrial oxygen consumption that is not associated with ATP synthesis (referred to as Oligo); (2) carbonyl cyanide-p-trifluoromethoxyphenylhydrazone (FCCP) (Sigma-Aldrich, Miamisburg, OH, USA) uncoupler with step-wise titration in 1 μM increments (to assess maximal electron transport system respiratory capacity rate referred to as Maximal respiratory Capacity or MRC), and finally (3) rotenone (Sigma-Aldrich, Miamisburg, OH, USA) in 0.5 μM final concentration and antimycin A (Sigma-Aldrich, Miamisburg, OH, USA) in 2.5 μM final concentration to inhibit complex I and III respectively (this will shut down the entire ETC. The residual oxygen consumption flux thus determined is a reflection of the non-mitochondrial respiration and was subtracted from all other respiratory measurements. All experiments were done using the same concentration of cells (~1.1 million cells/ml). Calibration with air-saturated medium was performed prior to the experiments. Oxygen flux per million cells was calculated and analyzed using DatLab4 (Oroboros Instruments Corp, Innsbruck, Austria, USA) software(35). This was normalized to citrate synthase activity (CS activity) as described below. Further some derived parameters were calculated from the above measurements. These are defined below:
Coupling efficiency was calculated as (Basal OCR-Oligo or leak OCR)/Basal OCR.
Oligomycin sensitive OCR (also referred to as Respiration driving ATP synthesis) was calculated as Basal OCR – Oligo OCR.
Spare Respiratory Capacity was derived as FCCP/MRC OCR-Basal OCR.
Citrate Synthase
Citrate synthase activity was determined by measuring the rate of oxaloacetate-dependent production of free HS-CoA; HS-CoA thus produced was coupled to DTNB [5,5′-dithiobis-(2-nitrobenzoic acid)] reduction, and converted to TNB (5-thio-2-nitrobenzoic acid). Cell suspensions (containing 0.01–0.025 × 10⁶ cells) in triplicate were incubated with reaction mixture (containing 50 mM triethanolamine-HCl at pH 8.0, 0.1 mM DTNB, 0.25% Triton-X and 0.3 mM acetyl CoA) for 1 min. Endogenous levels of thiol or deacetylase activity was checked. Thereafter oxaloacetate (0.5 mM) was added and the reaction product (TNB) was monitored at 412 nm (εM = 13.6 mM–1 cm–1) by Infinite M200 PRO Microplate Reader (Tecan Systems, Inc. San Jose, CA, USA). All assays were carried out at room temperature of 25°C. The molar extinction coefficient of TNB used was 13,600·M−1·cm−1 at 412 nm.
Mitochondrial membrane potential and mitochondrial oxidative stress burden
This was measured by fluorescence-activated cell sorting (FACS). Triplicate samples were labeled with each of three mitochondria targeted dyes: Mitotracker Green FM (0.2μM), TMRE (13.3nM; Invitrogen, Life Technologies, Grand Island, NY, USA) and MitoSox (6μM) to evaluate mitochondrial mass, mitochondrial membrane potential and oxidant burden. Cells were incubated with these dyes 10–20 minutes each, washed and 10,000 cells or events captured by FACS (C6 Accuri) using previously standardized protocols (36). The MitoTracker Green FM dye appears to preferentially accumulate in mitochondria regardless of mitochondrial membrane potential in certain cell types, making it a useful tool for determining mitochondrial mass probe. Furthermore, it has the added advantage that it is essentially non-fluorescent in aqueous solutions and only becomes fluorescent once it accumulates in the lipid environment of mitochondria. Hence, background fluorescence is negligible, enabling better visualization of mitochondria in live cells immediately after addition of the stain, without a wash step. Median fluorescence in gated cell populations was compared for the different cell types.
Cell size and Mitochondrial area analysis
Fibroblasts were cultured on glass coverslips and mitochondria stained with 100nM MitoTracker Deep Red FM (Invitrogen, Life Technologies, Grand Island, NY, USA) in DMEM for 45 minutes in an incubator maintaining 37°C and 5% CO2. Cells were rinsed with DMEM and fixed in 4% PFA in DMEM and PBS. They were permeabilized in PBT (0.1% Triton X-100 in PBS) and blocked in 5% goat serum in PBT for 1 hour at room temperature. Thereafter cells were stained with rabbit anti-actin (#A2066, Sigma-Aldrich, St Louis, MO, USA) antibody followed by secondary antibody AlexaFluor 488 goat anti-rabbit (5μg/ml in PBT). Coverslips were mounted on slides with Vectashield containing DAPI. The first experiment involved two coverslips for both the WT and SD MLG cells. This experiment was repeated on a separate day using three coverslips for both the WT and SD cells.
Olympus Fluoview 1000 laser scanning confocal microscope (Olympus Imaging America, Inc., Center Valley, PA, USA) with a 60× PlanApo oil objective (numerical aperture 1.4) was used to image DAPI, actin, and mitochondria using 405, 488 and 633 nm laser lines, respectively. For each coverslip, several non-overlapping fields of identical size were imaged at 60× magnification. All images were processed and analyzed for both total area covered by the cells and for cellular area covered by mitochondria/cell using freely available FIJI/ImageJ software (34).
Immunoblotting
Cell lysates were electrophoresed on a 4–12% polyacylamide gel (Invitrogen, Life Technologies, Grand Island, NY, USA) and proteins were transferred to a HyBond PVDF membrane (Amersham, GE Healthcare Bio-Sciences, Pittsburgh, PA, USA). Membranes were blotted with antibodies against the following proteins: Rev-erbα (#2124, Cell Signaling Technologies, Boston, MA, USA, 1:1000 with anti-rabbit antibody), uncoupling protein-2 (Abcam # ab97931; 1:500 with anti-rabbit antibody; confirmed with uncoupling protein binding peptide ab107701), FoxO1 and phosphor-FoxO1 (ser256) [# 9946 Forkhead Signaling Antibody sampler Kit, Cell Signaling Technologies, Boston, MA, USA; 1:1000 for both antibodies with anti-rabbit secondary], Parkin (# 4211, Cell Signaling Technologies, Boston, MA, USA; 1:300 primary antibody), Beclin-1 (# 3738, Cell Signaling Technologies, Boston, MA, USA; 1:500 primary antibody).
Quantitative PCR
Relative mRNA levels were evaluated by quantitative real-time PCR using the TaqMan gene expression system (Applied Biosystems, Life Technologies, Grand Island, NY, USA). Total lung RNA was extracted with TRIzol Plus RNA Purification System (Ambion, Life Technologies, Grand Island, NY, USA). RNA was assessed for purity and concentration using the NanoDrop (Thermo Fisher Scientific Inc., Waltham, MA, USA), and cDNA synthesized using the Verso cDNA Synthesis Kit (Thermo Fisher Scientific Inc., Waltham, MA, USA). The following primers were used (Life Sciences, Life Technologies, Grand Island, NY, USA)
Hyperoxia exposure
Cells were seeded, grown and exposed to hyperoxia (O2, 95% O2/5%CO2) or normoxia (air, 95% air/5% CO2) at comparable 60–70% confluency for 0–24 hours using a sensor controlled C-Chamber (Biospherix; Redfield, NY). Cell death was quantified by Trypan Blue exclusion assay as previously described(24).
Assessment of oxidative DNA damage (8-hydroxy-2-deoxyguanosine or 8-oxo-dG staining)
8-oxo-dG immune-reactive signal was evaluated in cells grown on slides using a mouse monoclonal antibody at a dilution of 1:250 (Trevigen, Gaithersburg, MD, USA). The fluorescent signals were visualized with a fluorescence microscope as described previously (37).
Mitophagy imaging analysis
Measuring the co-localization of mitochondria and autophagosome marker LC3B with confocal microscopy provides a method for specifically measuring changes in mitophagy. Fibroblasts were cultured on glass coverslips and stained with MitoTracker Deep Red FM. Two of the three coverslips for each phenotype were treated with 50 nM Bafilomycin A1 (inhibits the vacuolar type H+-ATPase preventing lysosomal maturation resulting in accumulation of autophagosomes) during the 45 minute MitoTracker staining period. Cells were rinsed with DMEM and fixed/permeabilized in ice cold 100% methanol at −20°C for 15 minutes, incubated overnight with monoclonal rabbit anti-LC3B antibody (#2775 Cell Signaling Technologies, Boston, MA, USA; 1:200 and secondary AlexaFluor 488 goat anti-rabbit antibody at 5μg/ml; co-stained with DAPI). Slides were imaged with the 488 nm laser line being used for LC3B. Different channels were scanned in sequence to prevent signals from bleeding through. FIJI/ImageJ software was used to process and analyze all images. Analyze Particles was then used to measure the surface area of co-localization in each plane of the new z-stack. Total mitophagy in the z-stack was then normalized to the number of cells in the field to calculate mitophagy area per cell. The mean areas of mitophagy per cell from all four conditions (WT or SD, each + or − Bafilomycin A1) were then compared.
RNA interference
Commercially available TRC mouse lentiviral Ppargc1a short hairpin RNA (shRNA) (# RMM4534-EG19107, Dharmacon, GE, Pittsburgh, PA, USA) were purchased. We tested 5 Ppargc1a shRNAs containing the following target sequences: shRNA#1: 5′-AAACCGTTGTTCTTGTTCTGG, shRNA#2: 5′-TTTACCAACGTAAATCACACG, shRNA#2: 5′-ATTCTCGGTCTTAACAATGGC, shRNA#4: 5′-ATTGTTCATTACTGAAGTCGC and shRNA#5 ATAGTCTTGTTCTCAAATGGG. The last shRNA (#5) was selected based on Ppargc1a knockdown in mRNA and protein levels and used for further experiments. Lentiviruses were produced by transiently co-transfecting 293T cells with the shRNA-expressing lentivirus vector, hairpin-pLKO.1 vector, packaging plasmid (pCMV-dR8.74psPAX2), envelope plasmid (pMD2.G) using Lipofectamine2000 (#11668-027, Life Technologies, Grand Island, NY, USA) as transfection reagent according to the manufacturers’ instructions. Cells were infected with lentiviruses in the presence of 5μg/mL polybrene (Sigma-Aldrich, St Louis, MO, USA). Two days after infection, cells were selected in puromycin (Sigma-Aldrich, St Louis, MO, USA) and maintained thereafter in medium containing puromycin.
Mitochondrial DNA determination
Mitochondrial DNA to nuclear DNA ratio has been used to determine mitochondrial biogenesis. While not optimal as a solitary method, this was used in conjunction with other assays – mitochondrial function, direct visualization (immunochemistry) and flowcytometry. The primers/probe sets used included 1) mitochondrial DNA encoded gene MT-CO1 (GenBank accession no. NC_001807): forward primer: 5′-TGCTAGCCGCAGGCATTAC-3′; reverse primer: 5′-GGGTGCCCAAAGAATCAGAAC-3′ and probe set FAM-AACCTAAACACAACTTTCTTTGATCCCGCTGG-TAMRA 2) Nuclear coded gene Ndufv1 (GenBank accession no. NC_133666): forward primer: 5′-CTTCCCCACTGGCCTCAAG-3′; reverse primer: 5′-CCAAAACCCAGTGATCCAGC-3′ and probe VIC-AGCCCTCAGATGGCAGGTTTGTTGHG-TAMRA.
Statistical analyses
Statistical analyses were done using Graph Pad Prism 6 or STATA 11 (Stata Corp, TX, USA). Most results were reported as mean ± SEM or mean ± SD as applicable. Unpaired student’s t-test was used in most cases. In cases, where the variances were different for the comparison groups, non-parametric tests were used to confirm the results of students t-test. For more than two group comparisons using normally distributed data, one-way ANOVA with Bonferroni correction for multiple comparisons was performed.
Results
Rev-erbα stabilization changes cellular morphology and protein content
Mutation of serine 55 and 59 within the N terminus of Rev-erbα protein stabilizes it against ubiquitin mediated proteosomal degradation and increases its half-life (33). Immunoblotting was used to confirm that Rev-erbα SD mouse lung fibroblasts (MLG) had more than three-fold higher levels of Rev-erbα protein (Figure 1A). Circadian regulation is organized into transcription translation feedback loops (TTFL). Rev-erbα binds to the promoter of core circadian gene, Bmal1 and represses its expression (38). As expected, Rev-erbα stabilization in SD cells led to its constitutive overexpression and subsequent repression of Bmal1 mRNA levels (Figure 1B). In mammals, the heterodimer formed by the proteins encoded by core clock genes Bmal1 and CLOCK bind to regulatory elements and activate the transcription of Rev-erbα (38). Another nuclear receptor and clock component, RORα competes with Rev-erbα for binding to the Bmal1 promoter ROR element (RORE)/RevRE site and activates Bmal1 transcription(23). Thus together with Bmal1, RORα and Rev-erbα constitute a regulatory loop that strengthens circadian rhythms and regulates circadian-controlled genes. Further, the other member of the Rev-erb family, Rev-erbβ also represses transcription. A genome wide cistromic analyses, revealed that Rev-erbα and Rev-erbβ shared 50% of their total DNA binding sites (21). While Bmal1 mRNA was repressed, as seen in Figure 1B, Rev-erbβ and RORα mRNA levels were unchanged (Figure 1B).
Interestingly, SD cells were almost twice as large as WT cells (Figure 2A) and had 60% higher protein content (Figure 2B), suggesting that stabilization of Rev-erbα results in either higher protein synthesis and/or reduced protein degradation, thus larger cellular mass.
Figure 2. Size and protein content of Rev-erbα stabilized (SD) MLG cells.
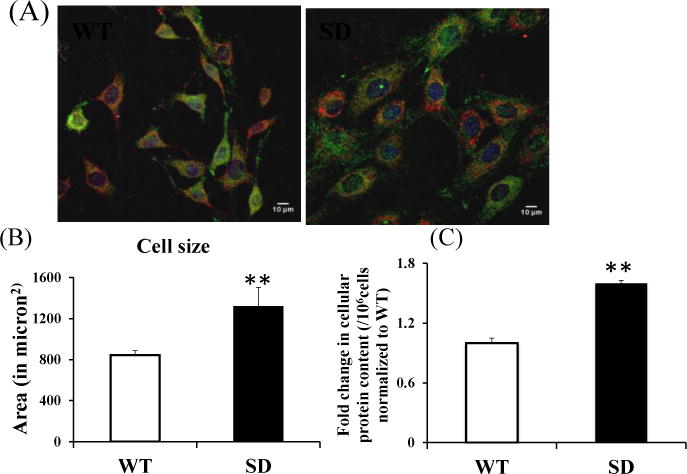
(A) Representative images depicting the fluorescence intensity of Mito Tracker Deep Red, actin (in green) and nuclear staining with DAPI (blue) of WT and SD MLG cells. Scale bar at 10μm.
(B) Quantification of cell area. (n=5 independent experiments; 3 images/experiment for each genotype)
(C) Relative amount of total protein content per cell determined by Bradford assay (n=3 independent experiments); Equal number of cells were processed for each cell type and normalized to WT cells.
Data are mean ± SEM. **p<0.001 by t-test.
Stabilization of Rev-erbα protects against nutrient deprivation
At similar cell densities/confluence, SD MLG incubated in glucose, pyruvate or glutamine deprived media for 8–24 hrs showed significantly higher survival than WT cells (Figure 3A). (Similarly even under conditions of fatty acid deprivation, using charcoal stripped FBS, SD cells survived better than WT cells. Data not shown) The expression of the rate-limiting enzymes involved in glycolysis namely hexokinase-2 and phosphofructokinase (Figure 3B), were upregulated in SD cells. However, given the role of mitochondrial respiration in maintaining energy homeostasis in cells in culture, we hypothesized that SD cells also have increased mitochondrial activity.
Figure 3. Survival of Rev-erbα stabilized (SD) and WT MLG cells under nutrient deprivation.
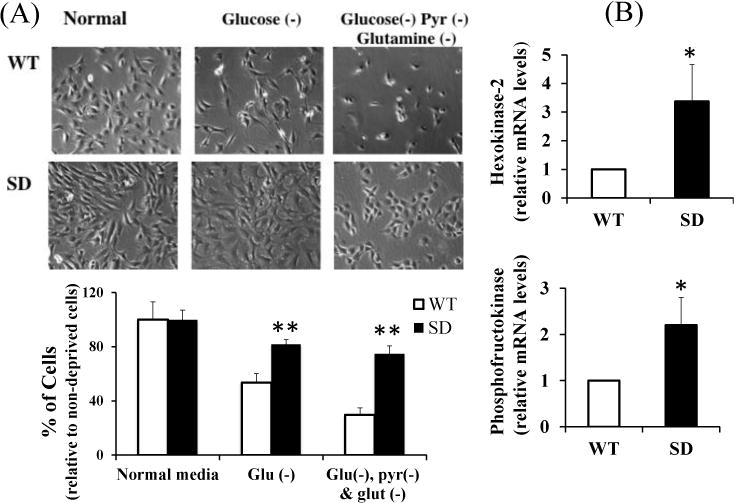
(A) (Upper panel) Representative phase microscopy images depicting cell growth and confluence of SD and WT MLG. Cells were grown in standard media overnight to 50–70% confluence, media removed, washed with PBS and then incubated in glucose free media (middle panel), or glucose, pyruvate and glutamine free media (Right panel) for 8–24 hrs. Control cells (Left panel; n=4). Images were taken at 200× magnification. Lower Panel: Bar graph represents number of healthy/live cells under nutrient deprivation normalized to cells that were not exposed to nutrient deprivation. The cell densities were comparable at the beginning of the nutrient deprivation conditions between the two genotypes.
(B) Relative mRNA levels of hexokinase-2(HK-2) and phosphofructokinase (PF3Kb), the rate limiting enzymes of glycolysis, in WT and SD MLG cells.
All data are mean ± SEM. *p<0.05 by t-test; **p<0.001 by t-test.
Rev-erbα stabilization enhances mitochondrial respiration
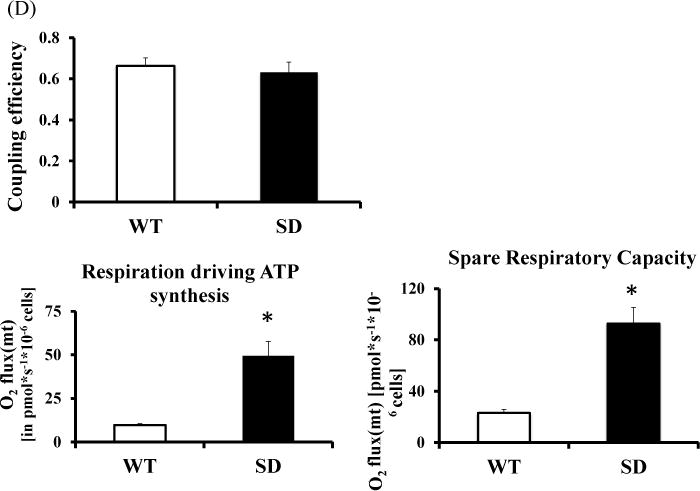
Fibroblasts with stabilized Rev-erbα survive better under nutrient deprivation, suggesting that Rev-erbα modulates cellular bioenergetics and substrate utilization. Since mitochondria are responsible for most of the cellular energy generation under normal cell culture conditions, mitochondrial oxidative phosphorylation capacity (oxygen flux or oxygen consumption rate as referred to as OCR) was evaluated using high-resolution respirometry (Figure 4A). First basal OCR was recorded and thereafter oligomycin was administered and the non-phosphorylating respiration or oligomycin resistant respiration rate (referred to as oligo OCR) was determined. Maximal Respiratory Capacity (MRC) refers to the maximum stimulated respiration of the electron transport chain (ETC; integrated activity of complex I–V) and was measured after administration of carbonyl cyanide-p-trifluoromethoxyphenylhydrazone, (FCCP), which uncouples oxidation from phosphorylation. SD cells had higher basal OCR than WT cells. Since SD and WT intact cells that differ in size and protein content the OCR data was normalized to citrate synthase activity and protein content. Even after this adjustment, the SD cells had nearly three times the basal respiration of WT cells (Figure 4B and 4C). We also calculated a few other derived parameters from these determinations (Figure 4D). The oligomycin-resistant respiration rate is most often secondary to proton leak while the basal OCR is influenced by ATP synthesis, proton leak as well as substrate oxidation.(39) The Oligo OCR was also higher in SD cells which could be a combination of proton leak, uncoupling of ETC or due to membrane damage or metabolite transport at the expense of the electrochemical gradient. However, the coupling efficiency and the levels of UCP2 protein were similar in SD and WT cell, arguing that uncoupling of the ETC was not a major contributor to the proton leak and that the mitochondrial efficiency appears to be preserved. We also found that the oligomycin sensitive OCR (also referred to as Respiration driving ATP synthesis) was significantly higher for SD cells suggesting there was an increase in ATP synthesis by Complex V in these cells. As further evidence of increased mitochondrial reserve SD cells also had higher Spare Respiratory Capacity than WT cells suggesting that the WT cells function closer to their bioenergetics potential at baseline and are not able to further augment energy production when faced with increased needs. Overall, these data prove that the SD cells have enhanced mitochondrial and oxidative capacity.
Figure 4. Mitochondrial respiration in MLG with Rev-erbα stabilized (SD MLG) and WT MLG.
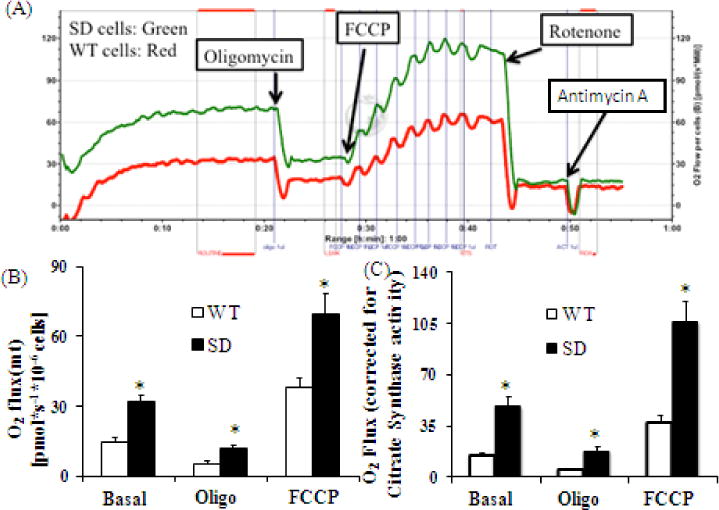
(A) Mitochondrial respiration of intact WT and SD MLG cells was determined using high-resolution respirometry. The graph depicts the plot comparing the oxygen consumption rate (OCR or Flux) per 106 cells from a representative experiment.
(B) Averaged values of basal respiratory capacity, Oligo/leak and FCCP/maximal respiratory capacity (MRC) results of mitochondrial respiration from above experiments (n=4 independent determinations) for WT and SD MLG (mouse lung fibroblasts) cells.
(C) Averaged values of basal respiratory capacity, Oligo/leak and FCCP/MRC results of mitochondrial respiration from above experiments (n=4 independent determinations) for WT and SD MLG (mouse lung fibroblasts) cells after normalization to Citrate Synthase specific activity.
(D)Averaged values of Coupling efficiency [defined as the (Basal-Oligo/leak)/Basal], respiration driving ATP synthesis/Oligomycin sensitive OCR [defined as Basal-Oligo/Leak OCR] and Spare respiratory capacity [Defined as FCCP/MRC-Basal OCR] in SD versus WT cells derived from the hi-resolution respirometry experiments. All OCRs were normalized for the Specific Citrate Synthetase activity. (n=4 independent determinations)
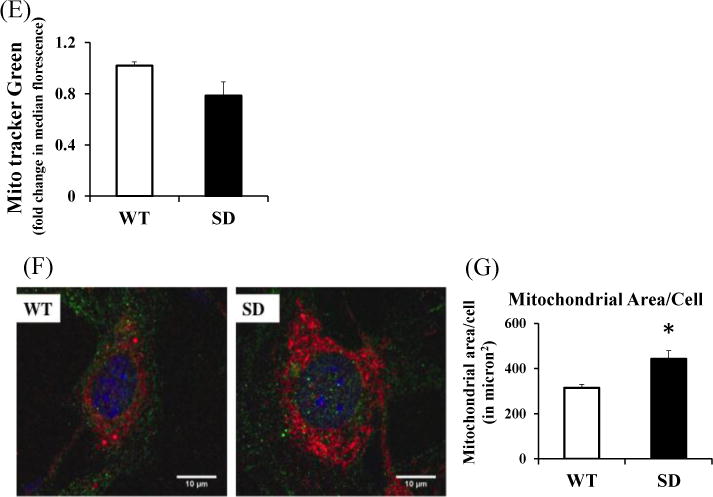
(E) Mitochondrial content (Mito Tracker Green) Flowcytometry was used to measure the fluorescence generated by stained mitochondria after normalization against WT cells. Values are expressed as the relative fold change in median fluorescence intensity (MFI) normalized to that of WT MLG cells. (n=5 independent determinations)
(F) Confocal microscopic images depicting the fluorescence intensity of Mito Tracker Deep Red, actin (in green) and nuclear staining with DAPI (blue) of single WT and SD mouse lung fibroblasts at 60× magnification. Scale bar =10μm
(G) Mitochondrial area/cell was determined by analyzing 12 fields (n=5 with 2 independent experiments performed under conditions similar to the mitochondrial respiration experiments); each field containing 11–16 cells/field were analyzed to calculate mitochondrial area per cell.
All data are presented as mean ± SEM. *p<0.05 by t-test or one-way ANOVA with Bonferroni correction for multiple comparisons.
Stabilizing Rev-erbα leads to greater mitochondrial area and reduced mitophagy
Given the higher mitochondrial bio-energetic capacity and cellular size in the SD cells we hypothesized that mitochondrial content was higher in SD cells than WT cells. Interestingly, the two cell types had similar mitochondrial mass as determined by MitoTracker green florescence on flowcytometry (Figure 4E). Although, MitoTracker green is considered to be a mitochondrial membrane potential independent dye, there are reports suggesting that for certain range of concentrations of the dye and/or in some cell types this assumption might not hold true(40). To resolve this issue, WT and SD cells were grown on coverslips, stained with MitoTracker Deep Red and actin, (Figure 4F) and single cell analyses of cell area occupied by mitochondria using confocal microscopy. In SD cells ~40% more area was occupied by mitochondria than in WT cells (Figure 4F and 4G). While the amount of mitochondrial DNA in SD cells in some experiments was significantly greater than that of the WT fibroblasts (Figure S1A), suggesting increased mitochondrial biogenesis in SD cells, this was not a consistent result across several independent trials (Figure S1B). This makes the conclusion that increased mitochondrial biogenesis as an explanation for the higher mitochondrial mass less likely. However, it is clear that stabilization of Rev-erbα increased mitochondrial mass.
Since mitochondrial content is a balance between mitochondrial production and destruction, we measured mitophagy next. Using bafilomycin and mitochondrial staining, autophagosomes co-localized with MitoTracker Deep Red were quantified as an index of mitophagy (Figure 5A). SD cells showed significantly lower accumulation of the autophagosome marker LC3B co-localized to the mitochondria after bafilomycin incubation (Figure 5B) than the WT cells, suggesting reduced mitophagy in the SD cells. This was also confirmed by higher parkin1 protein (Figure 5C) in WT MLG cells than in SD cells. However, markers of autophagy – beclin-1 and LC3b (Figure 5D) expression wasn’t significantly different between the cell types. This confirms that mitophagy and not autophagy was decreased in SD cells. Given the inconsistent results form the mitochondrial biogenesis assays, we conclude that that decreased mitophagy in SD calls in primarily responsible for the significantly increased mitochondrial area observed in SD cells.
Figure 5. Mitophagy is reduced in Rev-erbα stabilized (SD) compared with WT MLG.
(A) Confocal microscopic images depicting the fluorescence intensity of MitoTracker Deep Red (red), autophagosome marker LC3B (green), co-localization of autophagosomes and mitochondria from individual z-planes, compressed to 2D for display (yellow; highlighted with arrows). Scale bar =10μm
(B) Left panel: Quantification of endogenous LC3B-II and relative co-localization with MitoTracker Deep Red with balfilomycin incubation (left panel) and with/without bafilomycin (right panel). Total mitophagy was normalized to number of cells in the field to calculate mitophagy area per cell.
Right panel: Quantification of endogenous LC3B-II and relative co-localization with MitoTracker Deep Red with or without balfilomycin incubation. Total mitophagy was normalized to number of cells in the field to calculate mitophagy area per cell. *p<0.05 by t-test; n= 3 independent experiments.
(C) Representative immunoblot of Parkin in WT and stabilized Rev-erbα (SD) MLG cells (n=3 independent determinations). Densitometric analysis of Parkin protein normalized to WT MLG cells and GAPDH as a loading control.
(D) Representative immunoblots of beclin-1 and LC3b protein expression in whole cell lysates from SD or WT mouse lung fibroblasts (MLG) [normalized to calnexin and commassie blue as loading control]. Densitometric analysis of beclin-1 and LC3b normalized to normalized to calnexin and commassie blue as loading controls respectively. (n=4 independent determinations)
All data presented as the mean ± SEM. *p<0.05 by t-test
Rev-erbα stabilization is associated with up-regulation of anti-oxidant enzymes which protects SD cells from oxidative stress (induced by hydrogen peroxide and hyperoxia)
As seen in Figure 4A, Rev-erbα stabilization not only increased mitochondrial function but also led to higher oligomycin resistant respiration (leak) in the SD cells than the WT cells. We further hypothesized that higher mitochondrial proton leak would result in decreased ROS production. Cells were incubated with Mitosox red and oxidative burden determined by flowcytometry. Indeed, Rev-erbα stabilization resulted in lower mitosox fluorescence (lower mitochondrial oxidants or ROS) in the SD cells than in WT cells (Figure 6A; left panel), reflecting either reduced production of ROS or increased quenching of the formed species by anti-oxidant defenses. The SD cells appeared to have more negative membrane potential as measured by TMRE (Figure 6A; right panel), suggesting less proton leak, which is contrary to our finding in 4B and C. Based on the increased mitochondrial mass and oxidative phosphorylating capacity in the preceding sections, we however, suspect that increased TMRE fluorescence is a reflection of increased mitochondrial mass per cell. In summary, this suggests that Rev-erbα stabilization enables cells to better process oxidative species generated from the electron transport chain.
Figure 6. Cells with stabilized Rev-erbα are protected against oxidative stress.
(A) Left panel: Fluorescence intensity of MitoSOX expressed as relative fold change in median fluorescence intensity (MFI) normalized to WT MLG cells. (n=3 independent experiments)
Right Panel: Fluorescence intensity of TMRE in expressed as relative fold change in median fluorescence intensity (MFI) normalized to WT MLG cells. (n=3 independent experiments)
(B) Left panel: FoxO-1 gene expression in mouse embryonic fibroblasts (MEF) cells (n=4 independent determinations) with stabilized Rev-erbα (SD) or control (WT) cells.
Right panel: Representative immunoblot of FoxO-1 and phospho-FoxO1 (p-FoxO1; phosphorylated at Serine 256) in WT and stabilized Rev-erbα (SD) MEF cells (n=3 independent determinations) with stabilized Rev-erbα (SD) or control (WT) MEF cells. Bar graph representing the relative levels of p-FoxO1 protein as a fraction of total FoxO1 protein. Calnexin immunoblot is shown as a loading control.
(C) Hmox-1, MnSOD and Catalase gene expression in MLG cells (n=3 independent determinations) with stabilized Rev-erbα (SD) or control (WT) cells.
(D) Upper Panel Phase microscopy images depicting cell survival in stabilized Rev-erbα (SD) and WT MEF after oxidative stress induced by either 250 μM or 500 μM hydrogen peroxide (middle and right panel n=3–4) for 1 hr versus control cells (Left panel; n=3 independent experiments). Scale bar = 100μm.
Lower Panel: Bar graph represents number of healthy/live cells in each group normalized to cells that were not exposed to hydrogen peroxide for each genotype. The cell densities were comparable at the beginning of the exposure to H2O2 between the two genotypes.
(E) Images depicting oxidative damage to DNA (using 8-oxo-DG immunostaining in green with nuclear co-localization with DAPI in blue). Bottom panel shows Rev-erbα (SD) and the top panel depicts WT MEF after oxidative stress induced by 500µM hydrogen peroxide for 1hr or under control conditions.
(F) Cell death quantified by Trypan Blue exclusion assay in SD and WT MLG cells exposed to hyperoxia (95%O2/5%CO2) or to room air (21%O2 /5%CO2). Experiments were repeated in triplicate for five separate determinations. All data presented as the mean ± SEM. *p<0.05 by t-test. **p<0.001 by t-test.
Interestingly, as seen in Figure 6B (left panel), Rev-erbα stabilization also led to a nine fold increase in the expression of FoxO1. Various antioxidant genes that are downstream of FoxO1 such as MnSOD, Hmox1 and catalase (Figure 6C) were also significantly induced. Phosphorylation of FoxO1 marks the protein for ubiquination and subsequent proteasomal degradation (41). Consistent with the increased levels of FoxO1 mRNA, the amount of FoxO1 (active form) relative to the phosphorylated inactive form of FoxO1 (p-FoxO1) was increased in SD cells (Figure 6B; right panel). Furthermore, SD mouse embryonic fibroblasts (MEFs) had significantly higher survival than WT MEFs after incubation with hydrogen peroxide (H2O2) to promote oxidative stress (Figure 6D). Similarly SD cells had higher survival than WT cells when exposed to hyperoxia (95% O2) [Figure 6F]. Both cell types were exposed to hydrogen peroxide or to hyperoxia at very similar densities to avoid the confounding effect of differences in confluence on cell survival under stressful conditions (42). In agreement, SD cells demonstrated significantly lower oxidative DNA damage than WT cells as shown by 8-hydroxy-2-deoxyguanosine (8-oxo-DG) staining (Figure 6E) when exposed to H2O2. The FoxO1-mediated enhancement of antioxidant defenses, explain why the SD cells are better equipped to handle oxidative stress.
Stabilizing Rev-erbα improves cellular oxidative phosphorylation capacity through a PGC1α independent pathway
Stabilization of Rev-erbα led to increased mitochondrial biogenesis as evidenced by increased mitochondrial DNA content relative to nuclear DNA and increased mitochondrial area. This is often mediated by peroxisome proliferator-activated receptor-gamma co-activator 1 alpha (PGC1α), the master regulator of mitochondrial biogenesis (43), although other have shown that PGC1α is decreased in Rev-erbα KO cells (25). In the present study, SD cells had significantly lower PGC1α mRNA levels than WT cells (Figure 7A) but these differences did not exist in the protein levels of PGC1α (Figure 7 B). We tested this further, by using shRNA directed against PGC1α. Knockdown of PGC1α in SD MLG cells did not reduce mitochondrial DNA (Supplemental Figure S1B). However, the conclusion from this experiment is less definitive given that the SD cells did not always have higher mitochondrial DNA than WT cells. We also evaluated levels of other common known regulators of mitochondrial biogenesis, such as NRF1, TFAM, PGC1β and c-myc and these were not elevated in SD MLG cells. These experiments demonstrate at least a PGC1α-independent mechanism of increasing mitochondrial mass (even if not mediated through increased mitochondrial biogenesis) upon Rev-erbα stabilization implicating Rev-erbα directly in the regulation of mitochondrial function.
Figure 7. Stabilization of Rev-erbα increases mitochondrial respiration in a Pgc1α independent manner.
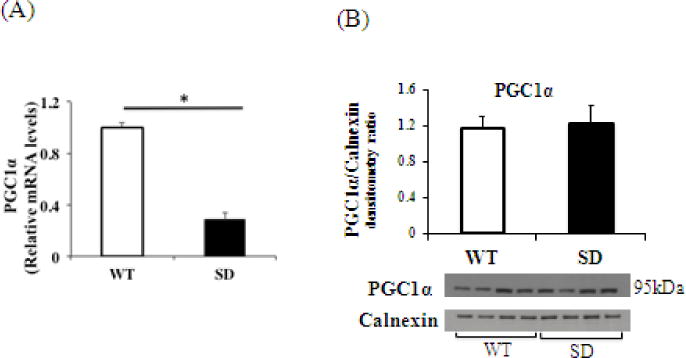
(A) Relative Pgc1α mRNA levels in WT or SD MLG cells (n=3 independent determinations).
(B) Representative immunoblot of PGC1α in WT and stabilized Rev-erbα (SD) MLG. Bar graph representing quantification of protein expression (normalized to WT cells and calnexin as loading control) All data presented as the mean ± SEM. *p<0.05 by t-test and Mann-Whitney for (n=4 independent determinations)
Discussion
In this study we show that the core circadian gene, Rev-erbα, regulates cell bioenergetics through direct effects on mitochondrial function. Rev-erbα protein increases oxidative phosphorylation and mitochondrial mass by reducing mitophagy and also by, most likely, increasing mitochondrial biogenesis in a PGC1α-independent manner. Our results also suggest that Rev-erbα stabilization induces FoxO1 and enhances the antioxidant defense under basal condition. This preconditioning better equipped the cells with stabilized Rev-erbα protein to withstand oxidative stress. While Rev-erbα and Rev-erbβ are believed to act in concert to mediate the circadian function (22), the current findings show that Rev-erbα alone is sufficient to regulate important cellular functions such as oxidative phosphorylation and survival under nutrient deprivation.
Several autophagy-related genes are known to have a circadian pattern of expression (44, 45), and dampened oscillations of autophagy genes was reported in liver-specific Bmal1−/− mice (46). However, not much is known about the role of Rev-erbα in specific forms of autophagy such as mitophagy. The observed decreased mitophagy provided by stabilization of Rev-erbα may be an important mechanism by which nuclear to mitochondrial communication enhances mitochondrial function and survival under nutrient deprivation.
There are very few reports linking Rev-erbα to mitochondrial function. These studies have often focused on metabolically active tissues such as hepatocytes, skeletal muscles and adipose tissues (25, 47). Our study proves that Rev-erbα stabilization enhances mitochondrial respiration in ubiquitously present fibroblasts. This is in contrast to Wu et al who showed that Rev-erbα overexpression restricted mitochondrial respiration driven oxygen consumption in hepatoma cells (47). In skeletal muscle Rev-erbα activation improves mitochondrial biogenesis and thereby mitochondrial function (25). Variability in the downstream targets of core circadian genes in different tissues could explain these different effects (31).
Although the role of mitochondria in ROS production and regulation of cellular redox state has been both controversial and not much is known about the role of circadian genes including Rev-erbα in modulating mitochondrial ROS production. Mitochondrial ROS may be a cytoprotective strategy against oxidative stress associated with disease processes such as aging (48), diabetes (49, 50) or ischemia reperfusion injury (51–54). In the current study, although mitochondrial oxidative burden (as assessed by mitosox) was reduced in SD cells, several antioxidant genes including FoxO1 and its downstream targets MnSOD, Hmox-1 and catalase were up-regulated. This suggests that in a state of constitutive stabilization of Rev-erbα, oxidative burden is reduced despite increased mitochondrial activity. This maybe an adaptive response to the increased mitochondrial activity, which presumably increased cellular ROS levels transiently. Such transient increases in ROS have been reported in Caenorhabditis elegans to cause a delayed but sustained increase in the constitutive expression and activity of anti-oxidant enzymes such as catalase (CAT) and superoxide dismutase (SOD). The resulting effect is protection against adverse conditions such as nutrient deprivation and paraquat-induced oxidative stress. (55). Low levels of ROS produced thus may be involved in cellular signal transduction (56). We suspect that ROS-signaling pathways such as FoxO1 induction triggered preconditioning responses that reduced mitochondrial oxidative burden and dramatically improved cell survival under oxidative stress. Significant protection under oxidative stress induced by H2O2 and by hyperoxia is seen with Rev-erbα stabilization and this provides compelling evidence for the importance of Rev-erbα in anticipating oxidative stress.
Transcription factor FoxO1 is well known to improve survival under nutrient deprivation as well as oxidative stress (57). In fact, the FoxO transcription factors are homologous to the Caenorhabditis elegans transcription factor DAF-16 (abnormal in Dauer Formation-16), which regulates lifespan and survival; under nutrient deprivation as well as oxidative stress (58). Despite being a nuclear repressor, Rev-erbα stabilization and overexpression led to a nine-fold induction of FoxO1. This effect may have been mediated by an intermediary target, which remains to be fully elucidated. Nevertheless, Rev-erbα may also upregulate the expression of important metabolic targets as shown in murine liver (21). Although, we have discussed phosphorylation of FoxO1 in SD cells, it is known that other post-translational modifications, such as acetylation and ubiquitination also regulate FoxO1(59). The precise role of these post-translational modifications in the context of circadian genes such as Rev-erbα remains to be elucidated.
While the role of Rev-erbα in regulating mitochondrial energy production is well supported by our study, the signaling pathway underlying this effect remains uncharacterized. In the SD cells, Rev-erbα induced increases mitochondrial oxidative phosphorylation through a PGC1α independent pathway. Since PGC1α is considered the master regulator of mitochondrial biogenesis (60), this finding suggests that Rev-erbα is also vital in regulating mitochondrial production and function. There are contradictory reports about the relationship between PGC1α and Rev-erbα. In brown adipose tissue, cold exposure represses Rev-erbα and induces PGC1α (47, 61), but in skeletal muscle, deficiency of Rev-erbα decreased PGC1α (25). In our experiments, SD and WT cells did not differ in the total PGC1α protein expression. However, given the complexity of post-translational control of PGC1α activity, the total protein level is less meaningful as a valid surrogate for PGC1α activity. Perhaps the relationship between Rev-erbα and metabolic targets such as PGC1 varies according to the tissue studied through tissue-specific epigenomic pathways as demonstrated in a recent report (62). In the present study, shRNA induced knockdown of PGC1α did not alter mitochondrial DNA content in SD cells. However, SD cells did not consistently have higher mitochondrial DNA than the WT cells, making the conclusion that Rev-erbα stabilization increases mitochondrial biogenesis, less definitive. This was further supported by the observation that the expression of other candidates involved in mitochondrial biogenesis, such as NRF1, NRF2, TFAM, PGC1β(63) and c-myc (64, 65) were not significantly different between WT and SD MLG cells (data not shown). The latter two are particularly relevant since they have been reported to induce biogenesis through pathways independent of PCG1α(66). While the exact pathway remains to be elucidated, these findings points to novel regulators of mitochondrial dynamics and function.
Conclusion
In summary, the core circadian gene, Rev-erbα regulates mitochondrial energy production and enhances cellular antioxidant defense mechanisms, which protects cells against oxidative stress. This energy advantage helps maintain cellular homeostasis under adverse conditions to promote cell survival and growth.
Supplementary Material
Table 1.
Primers used for qPCR
| Gene name | Catalog number |
|---|---|
| Bmal1 | Mm00500226_m1 |
| Per1 | Mm00501813_m1 |
| Hmox-1 | Mm00516006_m1 |
| Sod2 | Mm01313000_m1 |
| hk2 | Mm00443385_m1 |
| Pfkp | Mm00444792_m1 |
| Catalase | Mm00437992_m1 |
| FoxO-1 | Mm00490672_m1 |
| Rorα | Mm01173766_m1 |
Highlights.
Circadian gene Rev-erbα, preconditions and protects cells against oxidative damage
Rev-erbα increases mitochondrial respiration via an increase in mitochondrial mass
Rev-erbα induces FoxO1 and protects cells against nutrient deprivation
Acknowledgments
We are thankful to MA Lazar for the kind gift of the Rev-erbα SD transcript (from which the Rev-erbα SD MLG cells were generated) and animals (from which Rev-erbαSD MEF cells were generated). We thank Douglas C Wallace and Harry Ischiropoulos for their thoughtful discussions. This work was supported by NIH grant T32 HD60556-4 (to SS), R01 HL058752 (to P.A.D.), R21-HL111907 (to P.A.D.), R01 NS077773 (M.B.R) and T32 GM008076 (to J.O.D).
Footnotes
Publisher's Disclaimer: This is a PDF file of an unedited manuscript that has been accepted for publication. As a service to our customers we are providing this early version of the manuscript. The manuscript will undergo copyediting, typesetting, and review of the resulting proof before it is published in its final citable form. Please note that during the production process errors may be discovered which could affect the content, and all legal disclaimers that apply to the journal pertain.
Author Contributions:
SS, GY and PAD designed research; SS, GY, JOD, MH, PL, SMM MLW, EN-O and MY performed experiments; EP, MJF and SMM provided technical expertise for one experiment; MBR and JOD contributed to new analytic tools; SS, PL, JOD and GY analyzed data. SS, JOD and PAD wrote the paper; SS, PAD, JOD, MJF and MBR helped with manuscript revisions.
References
- 1.Panda S, Hogenesch JB, Kay SA. Circadian rhythms from flies to human. Nature. 2002;417(6886):329–35. doi: 10.1038/417329a. [DOI] [PubMed] [Google Scholar]
- 2.Bell-Pedersen D, Cassone VM, Earnest DJ, Golden SS, Hardin PE, Thomas TL, et al. Circadian rhythms from multiple oscillators: lessons from diverse organisms. Nat Rev Genet. 2005;6(7):544–56. doi: 10.1038/nrg1633. [DOI] [PMC free article] [PubMed] [Google Scholar]
- 3.Young ME. Anticipating anticipation: pursuing identification of cardiomyocyte circadian clock function. Journal of applied physiology. 2009;107(4):1339–47. doi: 10.1152/japplphysiol.00473.2009. [DOI] [PMC free article] [PubMed] [Google Scholar]
- 4.Schernhammer ES, Laden F, Speizer FE, Willett WC, Hunter DJ, Kawachi I, et al. Rotating night shifts and risk of breast cancer in women participating in the nurses’ health study. J Natl Cancer Inst. 2001;93(20):1563–8. doi: 10.1093/jnci/93.20.1563. [DOI] [PubMed] [Google Scholar]
- 5.Schernhammer ES, Laden F, Speizer FE, Willett WC, Hunter DJ, Kawachi I, et al. Night-shift work and risk of colorectal cancer in the nurses’ health study. J Natl Cancer Inst. 2003;95(11):825–8. doi: 10.1093/jnci/95.11.825. [DOI] [PubMed] [Google Scholar]
- 6.Barger LK, Lockley SW, Rajaratnam SM, Landrigan CP. Neurobehavioral, health, and safety consequences associated with shift work in safety-sensitive professions. Curr Neurol Neurosci Rep. 2009;9(2):155–64. doi: 10.1007/s11910-009-0024-7. [DOI] [PubMed] [Google Scholar]
- 7.Reddy AB, O’Neill JS. Healthy clocks, healthy body, healthy mind. Trends in cell biology. 2010;20(1):36–44. doi: 10.1016/j.tcb.2009.10.005. [DOI] [PMC free article] [PubMed] [Google Scholar]
- 8.Hastings MH, Maywood ES, Reddy AB. Two decades of circadian time. Journal of neuroendocrinology. 2008;20(6):812–9. doi: 10.1111/j.1365-2826.2008.01715.x. [DOI] [PubMed] [Google Scholar]
- 9.Maywood ES, O’Neill JS, Reddy AB, Chesham JE, Prosser HM, Kyriacou CP, et al. Genetic and molecular analysis of the central and peripheral circadian clockwork of mice. Cold Spring Harbor symposia on quantitative biology. 2007;72:85–94. doi: 10.1101/sqb.2007.72.005. [DOI] [PubMed] [Google Scholar]
- 10.Rutter J, Reick M, Wu LC, McKnight SL. Regulation of clock and NPAS2 DNA binding by the redox state of NAD cofactors. Science. 2001;293(5529):510–4. doi: 10.1126/science.1060698. [DOI] [PubMed] [Google Scholar]
- 11.Musiek ES, Lim MM, Yang G, Bauer AQ, Qi L, Lee Y, et al. Circadian clock proteins regulate neuronal redox homeostasis and neurodegeneration. J Clin Invest. 2013;123(12):5389–400. doi: 10.1172/JCI70317. [DOI] [PMC free article] [PubMed] [Google Scholar]
- 12.Edgar RS, Green EW, Zhao Y, van Ooijen G, Olmedo M, Qin X, et al. Peroxiredoxins are conserved markers of circadian rhythms. Nature. 2012;485(7399):459–64. doi: 10.1038/nature11088. [DOI] [PMC free article] [PubMed] [Google Scholar]
- 13.Stangherlin A, Reddy AB. Regulation of circadian clocks by redox homeostasis. The Journal of biological chemistry. 2013;288(37):26505–11. doi: 10.1074/jbc.R113.457564. [DOI] [PMC free article] [PubMed] [Google Scholar]
- 14.Feng D, Lazar MA. Clocks, metabolism, and the epigenome. Mol Cell. 2012;47(2):158–67. doi: 10.1016/j.molcel.2012.06.026. [DOI] [PMC free article] [PubMed] [Google Scholar]
- 15.Yang X, Downes M, Yu RT, Bookout AL, He W, Straume M, et al. Nuclear receptor expression links the circadian clock to metabolism. Cell. 2006;126(4):801–10. doi: 10.1016/j.cell.2006.06.050. [DOI] [PubMed] [Google Scholar]
- 16.Panda S, Antoch MP, Miller BH, Su AI, Schook AB, Straume M, et al. Coordinated transcription of key pathways in the mouse by the circadian clock. Cell. 2002;109(3):307–20. doi: 10.1016/s0092-8674(02)00722-5. [DOI] [PubMed] [Google Scholar]
- 17.McCarthy JJ, Andrews JL, McDearmon EL, Campbell KS, Barber BK, Miller BH, et al. Identification of the circadian transcriptome in adult mouse skeletal muscle. Physiol Genomics. 2007;31(1):86–95. doi: 10.1152/physiolgenomics.00066.2007. [DOI] [PMC free article] [PubMed] [Google Scholar]
- 18.Rey G, Reddy AB. Protein acetylation links the circadian clock to mitochondrial function. Proceedings of the National Academy of Sciences of the United States of America. 2013;110(9):3210–1. doi: 10.1073/pnas.1300419110. [DOI] [PMC free article] [PubMed] [Google Scholar]
- 19.Peek CB, Affinati AH, Ramsey KM, Kuo HY, Yu W, Sena LA, et al. Circadian clock NAD+ cycle drives mitochondrial oxidative metabolism in mice. Science. 2013;342(6158):1243417. doi: 10.1126/science.1243417. [DOI] [PMC free article] [PubMed] [Google Scholar]
- 20.Yin L, Wu N, Lazar MA. Nuclear receptor Rev-erbalpha: a heme receptor that coordinates circadian rhythm and metabolism. Nucl Recept Signal. 2010;8:e001. doi: 10.1621/nrs.08001. [DOI] [PMC free article] [PubMed] [Google Scholar]
- 21.Cho H, Zhao X, Hatori M, Yu RT, Barish GD, Lam MT, et al. Regulation of circadian behaviour and metabolism by REV-ERB-alpha and REV-ERB-beta. Nature. 2012;485(7396):123–7. doi: 10.1038/nature11048. [DOI] [PMC free article] [PubMed] [Google Scholar]
- 22.Bugge A, Feng D, Everett LJ, Briggs ER, Mullican SE, Wang F, et al. Rev-erbalpha and Rev-erbbeta coordinately protect the circadian clock and normal metabolic function. Genes Dev. 2012;26(7):657–67. doi: 10.1101/gad.186858.112. [DOI] [PMC free article] [PubMed] [Google Scholar]
- 23.Duez H, Staels B. Rev-erb-alpha: an integrator of circadian rhythms and metabolism. J Appl Physiol (1985) 2009;107(6):1972–80. doi: 10.1152/japplphysiol.00570.2009. [DOI] [PMC free article] [PubMed] [Google Scholar]
- 24.Yang G, Wright CJ, Hinson MD, Fernando AP, Sengupta S, Biswas C, et al. Oxidative stress and inflammation modulate Rev-erbalpha signaling in the neonatal lung and affect circadian rhythmicity. Antioxidants & redox signaling. 2014;21(1):17–32. doi: 10.1089/ars.2013.5539. [DOI] [PMC free article] [PubMed] [Google Scholar]
- 25.Woldt E, Sebti Y, Solt LA, Duhem C, Lancel S, Eeckhoute J, et al. Rev-erb-alpha modulates skeletal muscle oxidative capacity by regulating mitochondrial biogenesis and autophagy. Nature medicine. 2013;19(8):1039–46. doi: 10.1038/nm.3213. [DOI] [PMC free article] [PubMed] [Google Scholar]
- 26.Lin MT, Beal MF. Mitochondrial dysfunction and oxidative stress in neurodegenerative diseases. Nature. 2006;443(7113):787–95. doi: 10.1038/nature05292. [DOI] [PubMed] [Google Scholar]
- 27.Moreira PI, Zhu X, Wang X, Lee HG, Nunomura A, Petersen RB, et al. Mitochondria: a therapeutic target in neurodegeneration. Biochim Biophys Acta. 2010;1802(1):212–20. doi: 10.1016/j.bbadis.2009.10.007. [DOI] [PMC free article] [PubMed] [Google Scholar]
- 28.Ratner V, Sosunov SA, Niatsetskaya ZV, Utkina-Sosunova IV, Ten VS. Mechanical ventilation causes pulmonary mitochondrial dysfunction and delayed alveolarization in neonatal mice. Am J Respir Cell Mol Biol. 2013;49(6):943–50. doi: 10.1165/rcmb.2012-0172OC. [DOI] [PMC free article] [PubMed] [Google Scholar]
- 29.Ratner V, Starkov A, Matsiukevich D, Polin RA, Ten VS. Mitochondrial dysfunction contributes to alveolar developmental arrest in hyperoxia-exposed mice. Am J Respir Cell Mol Biol. 2009;40(5):511–8. doi: 10.1165/rcmb.2008-0341RC. [DOI] [PMC free article] [PubMed] [Google Scholar]
- 30.Storch KF, Lipan O, Leykin I, Viswanathan N, Davis FC, Wong WH, et al. Extensive and divergent circadian gene expression in liver and heart. Nature. 2002;417(6884):78–83. doi: 10.1038/nature744. [DOI] [PubMed] [Google Scholar]
- 31.Bray MS, Young ME. The role of cell-specific circadian clocks in metabolism and disease. Obesity reviews: an official journal of the International Association for the Study of Obesity. 2009;10(Suppl 2):6–13. doi: 10.1111/j.1467-789X.2009.00684.x. [DOI] [PubMed] [Google Scholar]
- 32.Wang J, Lazar MA. Bifunctional role of Rev-erbalpha in adipocyte differentiation. Molecular and cellular biology. 2008;28(7):2213–20. doi: 10.1128/MCB.01608-07. [DOI] [PMC free article] [PubMed] [Google Scholar]
- 33.Yin L, Wang J, Klein PS, Lazar MA. Nuclear receptor Rev-erbalpha is a critical lithium-sensitive component of the circadian clock. Science. 2006;311(5763):1002–5. doi: 10.1126/science.1121613. [DOI] [PubMed] [Google Scholar]
- 34.Schindelin J, Arganda-Carreras I, Frise E, Kaynig V, Longair M, Pietzsch T, et al. Fiji: an open-source platform for biological-image analysis. Nat Methods. 2012;9(7):676–82. doi: 10.1038/nmeth.2019. [DOI] [PMC free article] [PubMed] [Google Scholar]
- 35.Sondheimer N, Fang JK, Polyak E, Falk MJ, Avadhani NG. Leucine-rich pentatricopeptide-repeat containing protein regulates mitochondrial transcription. Biochemistry. 2010;49(35):7467–73. doi: 10.1021/bi1008479. [DOI] [PMC free article] [PubMed] [Google Scholar]
- 36.Dingley S, Chapman KA, Falk MJ. Fluorescence-activated cell sorting analysis of mitochondrial content, membrane potential, and matrix oxidant burden in human lymphoblastoid cell lines. Methods Mol Biol. 2012;837:231–9. doi: 10.1007/978-1-61779-504-6_16. [DOI] [PMC free article] [PubMed] [Google Scholar]
- 37.Yang G, Hinson MD, Bordner JE, Lin QS, Fernando AP, La P, et al. Silencing hyperoxia-induced C/EBPalpha in neonatal mice improves lung architecture via enhanced proliferation of alveolar epithelial cells. American journal of physiology Lung cellular and molecular physiology. 2011;301(2):L187–96. doi: 10.1152/ajplung.00082.2011. [DOI] [PMC free article] [PubMed] [Google Scholar]
- 38.Gekakis N, Staknis D, Nguyen HB, Davis FC, Wilsbacher LD, King DP, et al. Role of the CLOCK protein in the mammalian circadian mechanism. Science. 1998;280(5369):1564–9. doi: 10.1126/science.280.5369.1564. [DOI] [PubMed] [Google Scholar]
- 39.Brand MD, Nicholls DG. Assessing mitochondrial dysfunction in cells. Biochem J. 2011;435(2):297–312. doi: 10.1042/BJ20110162. [DOI] [PMC free article] [PubMed] [Google Scholar]
- 40.Buckman JF, Hernandez H, Kress GJ, Votyakova TV, Pal S, Reynolds IJ. MitoTracker labeling in primary neuronal and astrocytic cultures: influence of mitochondrial membrane potential and oxidants. Journal of neuroscience methods. 2001;104(2):165–76. doi: 10.1016/s0165-0270(00)00340-x. [DOI] [PubMed] [Google Scholar]
- 41.Huang H, Tindall DJ. Regulation of FOXO protein stability via ubiquitination and proteasome degradation. Biochimica et biophysica acta. 2011;1813(11):1961–4. doi: 10.1016/j.bbamcr.2011.01.007. [DOI] [PMC free article] [PubMed] [Google Scholar]
- 42.Spitz DR, Dewey WC, Li GC. Hydrogen peroxide or heat shock induces resistance to hydrogen peroxide in Chinese hamster fibroblasts. Journal of cellular physiology. 1987;131(3):364–73. doi: 10.1002/jcp.1041310308. [DOI] [PubMed] [Google Scholar]
- 43.Ventura-Clapier R, Garnier A, Veksler V. Transcriptional control of mitochondrial biogenesis: the central role of PGC-1alpha. Cardiovasc Res. 2008;79(2):208–17. doi: 10.1093/cvr/cvn098. [DOI] [PubMed] [Google Scholar]
- 44.Ma D, Li S, Molusky MM, Lin JD. Circadian autophagy rhythm: a link between clock and metabolism? Trends in endocrinology and metabolism: TEM. 2012;23(7):319–25. doi: 10.1016/j.tem.2012.03.004. [DOI] [PMC free article] [PubMed] [Google Scholar]
- 45.Sachdeva UM, Thompson CB. Diurnal rhythms of autophagy: implications for cell biology and human disease. Autophagy. 2008;4(5):581–9. doi: 10.4161/auto.6141. [DOI] [PubMed] [Google Scholar]
- 46.Ma D, Panda S, Lin JD. Temporal orchestration of circadian autophagy rhythm by C/EBPbeta. The EMBO journal. 2011;30(22):4642–51. doi: 10.1038/emboj.2011.322. [DOI] [PMC free article] [PubMed] [Google Scholar]
- 47.Wu N, Yin L, Hanniman EA, Joshi S, Lazar MA. Negative feedback maintenance of heme homeostasis by its receptor, Rev-erbalpha. Genes Dev. 2009;23(18):2201–9. doi: 10.1101/gad.1825809. [DOI] [PMC free article] [PubMed] [Google Scholar]
- 48.Speakman JR, Talbot DA, Selman C, Snart S, McLaren JS, Redman P, et al. Uncoupled and surviving: individual mice with high metabolism have greater mitochondrial uncoupling and live longer. Aging Cell. 2004;3(3):87–95. doi: 10.1111/j.1474-9728.2004.00097.x. [DOI] [PubMed] [Google Scholar]
- 49.Green K, Brand MD, Murphy MP. Prevention of mitochondrial oxidative damage as a therapeutic strategy in diabetes. Diabetes. 2004;53(Suppl 1):S110–8. doi: 10.2337/diabetes.53.2007.s110. [DOI] [PubMed] [Google Scholar]
- 50.Nishikawa T, Edelstein D, Du XL, Yamagishi S, Matsumura T, Kaneda Y, et al. Normalizing mitochondrial superoxide production blocks three pathways of hyperglycaemic damage. Nature. 2000;404(6779):787–90. doi: 10.1038/35008121. [DOI] [PubMed] [Google Scholar]
- 51.Bienengraeber M, Ozcan C, Terzic A. Stable transfection of UCP1 confers resistance to hypoxia/reoxygenation in a heart-derived cell line. J Mol Cell Cardiol. 2003;35(7):861–5. doi: 10.1016/s0022-2828(03)00147-0. [DOI] [PubMed] [Google Scholar]
- 52.Ganote CE, Armstrong SC. Effects of CCCP-induced mitochondrial uncoupling and cyclosporin A on cell volume, cell injury and preconditioning protection of isolated rabbit cardiomyocytes. J Mol Cell Cardiol. 2003;35(7):749–59. doi: 10.1016/s0022-2828(03)00114-7. [DOI] [PubMed] [Google Scholar]
- 53.Hoerter J, Gonzalez-Barroso MD, Couplan E, Mateo P, Gelly C, Cassard-Doulcier AM, et al. Mitochondrial uncoupling protein 1 expressed in the heart of transgenic mice protects against ischemic-reperfusion damage. Circulation. 2004;110(5):528–33. doi: 10.1161/01.CIR.0000137824.30476.0E. [DOI] [PubMed] [Google Scholar]
- 54.Mattox TA, Young ME, Rubel CE, Spaniel C, Rodriguez JE, Grevengoed TJ, et al. MuRF1 activity is present in cardiac mitochondria and regulates reactive oxygen species production in vivo. Journal of bioenergetics and biomembranes. 2014;46(3):173–87. doi: 10.1007/s10863-014-9549-9. [DOI] [PMC free article] [PubMed] [Google Scholar]
- 55.Zarse K, Schmeisser S, Groth M, Priebe S, Beuster G, Kuhlow D, et al. Impaired insulin/IGF1 signaling extends life span by promoting mitochondrial L-proline catabolism to induce a transient ROS signal. Cell metabolism. 2012;15(4):451–65. doi: 10.1016/j.cmet.2012.02.013. [DOI] [PMC free article] [PubMed] [Google Scholar]
- 56.Jastroch M, Divakaruni AS, Mookerjee S, Treberg JR, Brand MD. Mitochondrial proton and electron leaks. Essays Biochem. 2010;47:53–67. doi: 10.1042/bse0470053. [DOI] [PMC free article] [PubMed] [Google Scholar]
- 57.Salih DA, Brunet A. FoxO transcription factors in the maintenance of cellular homeostasis during aging. Current opinion in cell biology. 2008;20(2):126–36. doi: 10.1016/j.ceb.2008.02.005. [DOI] [PMC free article] [PubMed] [Google Scholar]
- 58.Lin K, Dorman JB, Rodan A, Kenyon C. daf-16: An HNF-3/forkhead family member that can function to double the life-span of Caenorhabditis elegans. Science. 1997;278(5341):1319–22. doi: 10.1126/science.278.5341.1319. [DOI] [PubMed] [Google Scholar]
- 59.Vogt PK, Jiang H, Aoki M. Triple layer control: phosphorylation, acetylation and ubiquitination of FOXO proteins. Cell Cycle. 2005;4(7):908–13. doi: 10.4161/cc.4.7.1796. [DOI] [PubMed] [Google Scholar]
- 60.Kelly DP, Scarpulla RC. Transcriptional regulatory circuits controlling mitochondrial biogenesis and function. Genes Dev. 2004;18(4):357–68. doi: 10.1101/gad.1177604. [DOI] [PubMed] [Google Scholar]
- 61.Gerhart-Hines Z, Feng D, Emmett MJ, Everett LJ, Loro E, Briggs ER, et al. The nuclear receptor Rev-erbalpha controls circadian thermogenic plasticity. Nature. 2013;503(7476):410–3. doi: 10.1038/nature12642. [DOI] [PMC free article] [PubMed] [Google Scholar]
- 62.Zhang Y, Fang B, Emmett MJ, Damle M, Sun Z, Feng D, et al. GENE REGULATION. Discrete functions of nuclear receptor Rev-erbalpha couple metabolism to the clock. Science. 2015;348(6242):1488–92. doi: 10.1126/science.aab3021. [DOI] [PMC free article] [PubMed] [Google Scholar]
- 63.Ishii KA, Fumoto T, Iwai K, Takeshita S, Ito M, Shimohata N, et al. Coordination of PGC-1beta and iron uptake in mitochondrial biogenesis and osteoclast activation. Nature medicine. 2009;15(3):259–66. doi: 10.1038/nm.1910. [DOI] [PubMed] [Google Scholar]
- 64.Kim J, Lee JH, Iyer VR. Global identification of Myc target genes reveals its direct role in mitochondrial biogenesis and its E-box usage in vivo. PloS one. 2008;3(3):e1798. doi: 10.1371/journal.pone.0001798. [DOI] [PMC free article] [PubMed] [Google Scholar]
- 65.Li F, Wang Y, Zeller KI, Potter JJ, Wonsey DR, O’Donnell KA, et al. Myc stimulates nuclearly encoded mitochondrial genes and mitochondrial biogenesis. Molecular and cellular biology. 2005;25(14):6225–34. doi: 10.1128/MCB.25.14.6225-6234.2005. [DOI] [PMC free article] [PubMed] [Google Scholar]
- 66.Morrish F, Hockenbery D. MYC and mitochondrial biogenesis. Cold Spring Harbor perspectives in medicine. 2014;4(5) doi: 10.1101/cshperspect.a014225. [DOI] [PMC free article] [PubMed] [Google Scholar]
Associated Data
This section collects any data citations, data availability statements, or supplementary materials included in this article.