

Abstract
Successful realization of the enormous potential of pluripotent stem cells in regenerative medicine demands the development of well- defined culture conditions. Maintenance of embryonic stem cells (ESCs) typically requires co-culture with feeder layer cells, generally mouse embryonic fibroblasts (MEFs). Concerns about xenogeneic pathogen contamination and immune reaction to feeder cells underlie the need for ensuring the safety and efficacy of future stem cell-based products through the development of a controlled culture environment. To gain insight into the effectiveness of MEF layers, here we have developed a biomimetic synthetic feeder layer (BSFL) that is acellular and replicates the stiffness and topography of MEFs. The mechanical properties of MEFs were measured using atomic force microscopy. The average Young’s modulus of the MEF monolayers was replicated using tunable polyacrylamide (PA) gels. BSFLs replicated topographical features of the MEFs, including cellular, subcellular, and cytoskeletal features. On BSFLs, mouse ESCs adhered and formed compact round colonies; similar to on MEF controls but not on Flat PA. ESCs on BSFLs maintained their pluripotency and self-renewal across passages, formed embryoid bodies and differentiated into progenitors of the three germ layers. This acellular biomimetic synthetic feeder layer supports stem cell culture without requiring co-culture of live xenogeneic feeder cells, and provides a versatile, tailorable platform for investigating stem cell growth.
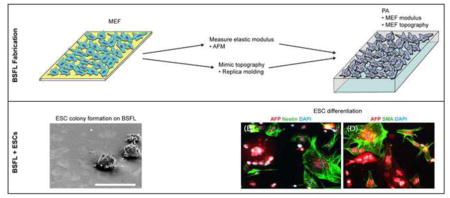
Graphical Abstract
1. Introduction
Embryonic stem cells (ESCs) are pluripotent cells that are derived from the inner cell mass of the blastocyst and maintain the abilities of self-renewal and multilineage differentiation in vitro under defined conditions [1,2]. By harnessing and controlling the ability of these cells to differentiate into virtually all cell types found in the body, scientists hope to use these cells for myriad disease treatments. However, there are challenges that need to be overcome before such therapies can be utilized. Realization of the potential of pluripotent stem cells in regenerative medicine requires the development of well-defined conditions for long-term culture, growth, and directed differentiation. There is a need to produce ESCs on a large scale in a controlled manner, with well-characterized conditions free of foreign support cells and other unknown conditioning factors [3].
Mouse ESCs (mESCs) [1] and human ESCs (hESCs) [2] each have been established using similar procedures, through co-culture with mouse embryonic fibroblasts (MEFs) as feeder cells. The majority of stem cells are still maintained in co-culture with MEFs, as MEFs can provide the required environment for ESC self-renewal. However, the use of MEFs is less than ideal for several reasons, including limited usage due to early senescence, as well as the risk of xenogeneic contamination. Further, the presence of feeder layers complicates certain types of stem cell research, since collected data may reflect the combined response of stem cells and feeder layers [4].
Since MEFs present a highly supportive environment for stem cells, several studies have focused on exploring their characteristics. While some of the soluble or bound factors expressed by MEFs have been found [5], many cues are still unidentified. In addition, several efforts have tried to replace live MEFs with cell-dependent and cell-independent approaches [6]. Defined culture media formulation and defined surface coating approaches [7–9] have been explored. A variety of materials have been investigated including natural materials such as hyaluronic acid [10]. Recent strategies have focused on replacing biologically variable materials with synthetic materials in hopes of creating a more controllable, systematic and xeno-free platform for the growth and expansion of stem cells [9,11].
In addition, stem cells respond to substrate properties, including compliance and topography. Recently, materials of varying stiffnesses, including the range of 0.3–50 kPa, have been developed to explore stem cell self-renewal and differentiation [12–15]. In some of these studies, material patterning and topography, which have been shown to influence mesenchymal stem cell differentiation [16–19], have been investigated for their effects on embryonic stem cells as well [12,13].
To better understand how MEFs support stem cells, the goal of this study was to investigate the influence of MEF feeder layer topography and stiffness on the proliferation, self-renewal, and differentiation capabilities of mESCs. Here we have developed materials that replicate the combination of both the stiffness and the topography of MEF feeder layers. Using a replica molding technique that reproduces cell topography at the micro/nano-scale [20–22], we reproduced critical elements of the feeder layer that support mESCs, specifically by fabricating biomimetic synthetic feeder layers (BSFLs) that incorporate micro/nano-scale physical features with the shape, size, and stiffness of feeder layer cells. To evaluate whether the BSFLs can support stem cells, mESCs cultured on BSFLs were evaluated for their abilities to establish colonies, form embryoid bodies (EBs), and differentiate into the three germ layers.
2. Materials and methods
2.1. Culture of MEFs and their inactivation
Primary MEFs (Millipore PMEF-CLF strain CF-1 untreated, passage 3) were maintained in tissue culture flasks coated with 0.1% gelatin solution (Millipore, ES-006-B) in Dulbecco’s Modified Eagle’s Medium (DMEM, Millipore, SLM-220B) supplemented with 10% embryonic stem cell qualified fetal bovine serum (ES, FBS, Millipore, ES-009B), 100 μg/mL Penicillin, 100 μg/mL Streptomycin (Invitrogen), and 4 mM L-glutamine (Invitrogen). Cells were incubated at 37°C with 5% CO2, grown to confluence and passaged at 1:4. To mitotically inactivate MEFs, 10 μg/mL mitomycin C in PMEF media (Acros Organics) was added to confluent MEF cultures. Cultures were incubated for 2 hours, and cells were rinsed 3 times with PBS for 10 minutes followed by the addition of fresh media. Mitotically inactivated MEFs were kept for up to 2 weeks at 37°C with 5% CO2 and were used as feeder layers for mESC cultures.
2.2. Mechanical and topographical characterization of MEFs
MEFs at a density of 100,000 cells/cm2 were grown to confluence on gelatin-coated glass coverslips and assessed for their live-cell topographical features and elastic moduli using an MFP-3D-BIO atomic force microscope (AFM, Asylum Research). To facilitate conformal contact during testing, 5 μm diameter, borosilicate glass spheres were attached to the tip of AFM cantilevers with nominal stiffness values of 0.03 Nm−1 (Novascan Technologies). Cellular elastic moduli were quantified using three techniques: single-cell indentation [23], force mapping [24], and force scanning [25]. The force scanning technique was also used to generate high-resolution (~15,000 points) topographical/elastic maps of live MEFs. Scan sizes ranged from 80 × 80 – 90 × 90 μm, typically incorporating 1–3 cells in a field of interest. Average MEF mechanical properties were determined by testing ten random sites via force maps (n = 100 indentations/site), in conjunction with single-cell indentations of confluent monolayers (n = 10 cells). Approach velocities of 15 μm/s were used for all indentation tests. Force-indentation data were fit with a modified, thin-layer Hertz model to extract elastic moduli as described previously [23–25]. Data are presented as mean ± standard deviation. Topographical scans were performed using spherical-tipped cantilevers at a scan rate of 0.3–1 Hz, resolution of 256 × 256, and set point force of 5 nN.
2.3. Fabrication of MEF templates
Cellular templates were fabricated as previously described by Bruder et al [22]. Glass slides (75 × 50 mm, Corning) were cleaned with ethanol and deionized water (dH2O) and then dried. Slides were oxygen plasma-etched (Harrick Plasma) for 1 minute, coated with 0.1% gelatin solution, and 150,000 cells/cm2 were plated. MEF cultures reached confluence in 2–3 days, at which point cells were fixed in 2% paraformaldehyde (PFA, Electron Microscopy Sciences) in 0.1 M phosphate buffered saline, pH 7.4 (PBS, Invitrogen) at room temperature for 20 minutes. PFA-fixed cells were subsequently post-fixed and dehydrated according to Bruder et al [22] with procedures that use Karnovsky’s fixative (Electron Microscopy Sciences) and ethanol (Sigma Aldrich), respectively. Templates were dried and sputter coated with gold-palladium at 20 mA for 3 minutes (Emitech K550 Sputter coater), resulting in a rigid cell template (Figure 1A).
Figure 1.

Fabrication of BSFLs. First a (A) MEF cellular template was generated. Using this, a (B) PDMS impression replica was made and silanated; PA was cast onto the surface of the impression replica. (C) After polymerization, the PA gel was removed, resulting in a BSFL containing the protruding topographical features of MEFs. Abbreviations: mouse embryonic fibroblasts (MEF), poly(dimethylsiloxane) (PDMS), impression replica (IR), polyacrylamide (PA).
2.4. Fabrication of BSFLs on polyacrylamide substrates
To produce PDMS MEF impression replicas (IRs), Sylgard 184 elastomer base was mixed with Sylgard 184 curing agent (10:1 wt/wt) (Dow Corning) and centrifuged for 1 minute at 2,000 rpm to remove air bubbles. PDMS was cast over the fixed cell templates and baked for 4 hours at 65°C to cure. The cured PDMS was peeled from the template revealing a MEF cellular IR with cellular features indented in the PDMS. Freshly peeled PDMS IR was plasma etched for 1 minute and immediately silanized through vapor deposition of tridecafluoro-1,1,2,2-tetrahydrooctyl (trichlorosilane) (Gelest, Inc.) for 2.5 hours (Figure 1B).
Prior to PA gel crosslinking, 18 mm glass coverslips (microscope cover glass No 1, Fisher Scientific) were chemically modified to enhance the covalent binding of the PA gel onto their surfaces. Coverslips were rinsed three times with 100% ethanol for 5 minutes, treated with a 0.5% (v/v) solution of 3-aminopropyltrimethoxysilane (APTS, Sigma Aldrich) in ethanol for 5 minutes, rinsed three times with 100% ethanol and placed in a solution of 0.5% (v/v) glutaraldehyde (Electron Microscopy Sciences) in water for 30 minutes. The resulting activated coverslips were rinsed three times with deionized water and baked at 60°C until dried.
PA substrates with elastic moduli comparable to that of live MEFs (~8 kPa) were prepared according to Gilchrist et al. [26] by diluting stock reagents in Hanks Balanced Salt Solution (HBSS) to final concentrations of 0.186 M Tris-HCl pH 6.8 (stock, 1 M pH 6.8, TekaNova), 8% acrylamide (stock, 40% wt/vl, Bio-Rad Laboratories Inc.), 0.08% N,N-methylene-bis-acrylamide (BIS, 2%wt/vl, Bio-Rad Laboratories), 0.125% ammonium persulfate (APS, Sigma) and 2.7 % N, N, N′,-tetramethy-ethylenediamine (TEMED, Invitrogen). The solution was degassed, pipetted on top of the silanized PDMS MEF IR, and the solution was degassed again to allow the PA solution to fill the indented features of the MEF IR mold. Following this, TEMED was added to the PA solution to 0.83%, and the solution was immediately covered with an APTS-treated coverslip and allowed to polymerize for one hour. Once the PA polymerized, the IR-substrate-coverslip system was soaked in PBS for 2 hours, at which point the substrate was peeled from the MEF IR mold while immersed in PBS. The resulting PA substrates presented a protruding MEF cellular replica, namely a biomimetic synthetic feeder layer (BSFL) (Figure 1C). The combination of fixation, processing, and replica molding steps in the MEF template and BSFL fabrication processes ensures that no cellular biochemical factors are present on the BSFL [22].
Flat substrates of the same compliance were fabricated as control surfaces. A 70 μL droplet of the PA solution was pipetted onto an APTS-treated glass slide (Fisher Scientific) and 2 μL of TEMED (Invitrogen) was added before covering the droplet with an APTS-treated coverslip, proceeding as described above.
Topographical features were visualized with phase contrast microscopy, AFM, and scanning electron microcopy (SEM, Hitachi S-2700). For SEM, the PA substrates were dehydrated as described by Bruder et al. [22], and the following settings were used: a voltage of 8 kV, 50° tilt and a beam current of 8 mA.
2.5. mESC culture
Feeder layer-dependent mESCs, ES-D3 (ATCC CRL-1934), were cultured according to Chung et al. [27]. mESCs were maintained undifferentiated on mitotically inactivated MEFs in knock-out DMEM (Invitrogen) supplemented with 2 mM L-Glutamine (Invitrogen), 0.1 mM non-essential amino acids (Millipore), 0.1 mM β-mercaptoethanol (Millipore), 100 μg/mL Penicillin, 100 μg/mL Streptomycin (Invitrogen), 15% FBS (Benchmark 100–106, Gemini Bio-Products) and 1000 units/mL LIF (ESG1107, Millipore) (LIF-supplemented maintenance medium). Differentiation medium had the same composition, but lacked LIF. Cells were incubated at 37°C with 5% CO2 and monitored to ensure optimal confluency. Cell medium was replenished every day, and cultures were passaged 1:3. Briefly, mESC and MEF hetero-cultures were treated with 0.25% trypsin-EDTA for 5 minutes, one volume of ESC medium was added, and cell suspension was centrifuged at 1,000 rpm for 5 minutes. Cells were then resuspended in ESC medium, and re-plated on confluent, mitotically inactivated MEF monolayers.
2.6. mESC culture on PA substrates
Both types of PA substrates (Flat and BSFL) were coated with 0.1% gelatin 30 minutes prior to cell seeding. mESCs were grown on either Flat substrates, BSFL substrates, or on mitotically inactivated MEFs. All conditions were tested in LIF-supplemented maintenance medium. Before cells were plated on the substrates, the heterogeneous cell population, containing MEF feeder layer cells and mESCs, was pre-plated on gelatin coated Petri dishes for 1.5 hours to allow the MEFs to preferentially adhere to the dish. After incubation, the supernatant, containing non-adhered mESCs, was plated at a density of 50,000 cells/cm2 on all culture substrates (BSFL, Flat and MEF controls). Cells for all conditions were cultured for a total of 3 passages, performed every 48 hours. At each passage, samples were rinsed with HBSS (Invitrogen) to remove floating debris and exposed to 0.25% trypsin (Invitrogen) for 5 minutes at 37°C with 5% CO2. Cells were rinsed with media, centrifuged at 1,000 rpm for 5 minutes, then resuspended, counted and plated at 50,000 cells/cm2. Passaging experiments were performed in triplicate. At each passage, cells were seeded onto a passaging plate, for passaging; and a colony analysis plate, where cells were fixed to obtain cell colony number and area data. If the cell count was insufficient for the combination of passaging and colony analysis, then cells were simply passaged. Images were taken at 10x on a Nikon Eclipse TE2000-S microscope equipped with phase contrast and epifluorescence optics.
2.7. Formation of embryoid bodies and differentiation in vitro
After centrifugation of passage three (P3) mESCs, cells were resuspended in differentiation medium and plated on untreated tissue culture plastic wells (BD Falcon) at a density of 35,000 cells/cm2 for EB formation. Cells were cultured for 7 days, and medium was changed every other day. At day 7, EBs were transferred onto gelatin-coated Petri dishes (100 mm, BD Falcon) and cultured for an additional 7 days in differentiation medium.
2.8. Immunofluorescence staining and imaging
At each passage, a sample of mESCs was fixed with 2% PFA in 0.1 M PBS at pH 7.4 for 30 minutes, then with 4% PFA for 1 hour. After rinsing 3 times with PBS, nonspecific staining was blocked for 1 hour at room temperature with 10% normal goat serum (Jackson Immuno Research Laboratories) and 1% bovine serum albumin (Sigma) in 0.1 M PBS (working solution), with 0.1% Triton-X100 (VWR). Primary antibodies used include: rabbit anti-Oct4 and rabbit anti-Sox2 (1:150, Abcam) for identifying undifferentiated cells, mouse anti-nestin (1:150, Millipore) for identifying ectoderm cells, mouse anti- alpha smooth muscle actin (SMA, undiluted, DAKO) for identifying mesoderm cells and rabbit-anti human alpha 1-fetoprotein (AFP, undiluted, DAKO) for identifying endoderm cells. Primary antibodies were diluted in working solution and placed on samples overnight at 4°C. For double immunostaining, the first primary antibody was removed, samples were rinsed twice with PBS, and the second primary antibody was placed on samples overnight at 4°C. Samples were rinsed twice with PBS at room temperature and incubated for 1 h with Cyanine-3-conjugated (Cy3) goat anti-mouse or goat anti-rabbit secondary antibody (Jackson Immuno Research Laboratories) diluted 1:200 in working solution. After rinsing twice with PBS, cell nuclei were stained with 4′,6-diamidino-2-phenylindole (DAPI) (Sigma) diluted 1:100 in PBS. Samples were rinsed twice with PBS before they were imaged on a Nikon Eclipse TE2000-S (fluorescent) or on a Zeiss LSM 510 META (confocal) microscope.
Protein adhesion to Flat and BSFL PA substrates was quantified using FITC-BSA as follows.
A 1 mg/ml FITC-BSA (Sigma) solution was prepared in 10 mM Tris-HCl pH6.8, filtered, and 0.2 ml was pipetted onto each substrate (BSFL, n=4; Flat PA made from glass, n=5). Substrates were incubated for 30 minutes, rinsed twice with PBS, and 1 ml of PBS was added. Samples were imaged using a 10X objective on a Nikon Eclipse TE2000-S. Total fluorescence per FOV was calculated using a custom MATLAB script.
2.9. Data analysis
For quantification of colony numbers, phase contrast images were loaded into Image J 1.45s (National Institutes of Health, NIH) and objects within a field of view (FOV) were counted. At least 30 FOV were quantified per condition. For area quantification, phase contrast images were loaded into Image J 1.45s (NIH), software was calibrated and objects within a FOV were manually traced using the Freehand selection tool. Colonies in the periphery of the FOV were not traced. At least 30 FOV were quantified per condition.
2.10. Statistical analysis
All data were compared within each condition and across conditions. The following statistical tests were performed. Numerical data collected were subjected to a Shapiro-Wilk normality test to verify that distributions were normal. For groups with normal distributions, parametric tests (one-way analysis of variance (ANOVA) for 3 or more groups or Student’s t-test for 2 groups) were used to compare means. Two-way ANOVA was employed in the presence of two factors. Post hoc analyses (Tukey) for equal variance in the population were also employed for multiple comparison of the means and their interactions. For groups with non-normal distributions, non-parametric tests (Kruskal-Wallis one-way ANOVA on ranks for 3 or more groups or Welch’s t-test for 2 groups) were used to compare the means. Post hoc analyses (Dunn’s) for unequal variance in the population were also employed for multiple comparison of the means and their interactions. A p < 0.05 was considered to be significant. All statistical tests were performed using SigmaPlot 12.3, Systat Software Inc.
3. Results
3.1. MEF mechanical testing
MEFs were grown to desired confluence on gelatin-coated glass as typically used to support mESCs. Using AFM, cellular elastic modulus, height, roughness, and topographical features were assessed in live MEF monolayers. To calculate heights of scans, AFM images were first flattened, and then a histogram was generated for the height measurements across the entire image. Topographical scans indicated an average monolayer height of 3.1 ± 1.8 μm from the glass surface, with a root mean squared roughness of 520 ± 170 nm (Figure 2A). As expected, the tallest features of the MEFs were the cell body and nucleus, and the lowest were the cytoplasmic regions furthest from the perinuclear area. The average elastic modulus was 7.7 ± 5.5 kPa (n = 997 indentations), as measured by force mapping, and 7.3 ± 6.1 kPa (n = 10 cells), as measured by single-cell indentations. Stiffness inversely correlated with height across the monolayers, with the taller features (i.e., nuclei) being less stiff than the shorter features, which were firmly adhered to the glass substrate. Force scan data revealed that MEF mechanical properties were similar to those obtained by force mapping, with cell nuclei being softer (~4 kPa) than the taut, spread cytoskeletal regions (~8 kPa).
Figure 2.

Physical properties of live MEFs and BSFLs were assessed with AFM. Characterization of live MEF monolayers provided (A) topographical height images of the cells. AFM height images were also generated for the (B) PDMS impression replica and (C) PA BSFL substrate. Subcellular features are largely conserved between MEFs and IRs/BSFLs. Green arrows indicate cell nuclei and blue arrows indicate cytoskeletal features.
3.2. BSFLs reproduced the topographical features and roughness of MEFs
During fabrication of the BSFLs in 8kPa PA, the physical, topographical integrity of the confluent MEFs (Figure 3A) was conserved. Both the intermediate IR (Figure 3B) and the final BSFL (Figure 3C) displayed biomimetic topographical features. The shapes and topographical morphology of MEFs and BSFLs were confirmed by AFM, where BSFLs replicated the surface topography of MEFs (Figure 2C). There was a reduction in height in the raised topographical features in the BSFL; the tallest raised features in the BSFL were approximately 2 μm tall, whereas the tallest live cell dimensions were approximately 6 μm tall. To confirm that the reduction of height was not a result of the BSFLs fabrication process, IRs were also topographically imaged. Indented features in the IRs were also approximately 1–2 μm high (Figure 2B), suggesting the reduction in height occurred during fixation. PA BSFL substrates had a roughness of 585.6 ± 132.4 nm RMS, similar to live MEFs (524.2 ± 168.8 nm RMS). All other feature shapes and sizes were very similar to live MEFs. A single MEF cell template was large enough in area for the fabrication of six BSFLs, minimizing potential effects of variation in MEF population.
Figure 3.

MEF cellular integrity was preserved during the stages of cell template fabrication and in the BSFLs. Phase contrast micrographs of (A) live MEF in culture, (B) PDMS impression replica and (C) BSFL. Three different cell nuclei are outlined in blue in each image. Red arrowheads show MEF structural details on the BSFLs. Scale bar = 30 μm.
3.3. mESCs adhered and formed colonies on BSFLs
mESCs cultured on BSFLs formed round, compact colonies (Figures 4 and 5), typical of undifferentiated ESCs. BSFL topographical features were preserved beneath the colonies, as confirmed with SEM (Figure 4). To assess the effect of topography on colony formation, two other types of substrates were included in the study. Flat substrates presented the same material and stiffness as BSFLs but with a flat surface. Comparison of fluorescence intensity between Flat and BSFL, both coated with FITC-BSA, showed that the two types of substrates bound similar amounts of protein (Supplemental Figure 1). Also included were live MEF monolayers, the gold standard for stem cell propagation, which presented the same stiffness and topography as BSFLs, and additionally contained live cells.
Figure 4.

BSFLs supported the growth and colony formation of mESCs. Scanning electron micrograph of mESCs grown on a BSFL for three days. mESCs formed tightly packed and circular colonies. The BSFL topographical features can also be visualized beneath the round colonies. Scale bars = 600 μm, 87.5 μm (inset).
Figure 5.

BSFLs, but not Flat substrates, supported growth and colony formation of mESCs across three passages. Phase contrast micrographs of mESCs grown on Flat, BSFL and MEF controls at P1 and P3. mESCs formed tightly packed colonies with undifferentiated morphologies on BSFLs and MEF controls. Note that on these images, exposure conditions optimized the visualization of colonies and not the BSFL features. Scale bar = 60 μm
When mESCs were cultured on Flat substrates, BSFLs, or MEFs for three passages, at each passage, significantly more cells were harvested from BSFLs and MEFs than from Flat substrates (Table 1). At P1, mESCs harvested from Flat substrates were not sufficient in number for both P2 passage and P2 colony experiments (Figure 5 left column); therefore, cells were only passaged. mESCs on BSFLs and MEFs had stable proliferation rates. No significant differences were found for doubling times (16.0 ± 0.9h and 19.5 ± 1.6h; Table 1) within or across conditions. Across all three passages, colony formation on Flat substrates was limited, and the colonies that did exist were small in size or non-adhered and floating. The presence of individual mESCs was also more evident on Flat substrates (Figure 5, left column). Both BSFLs and MEFs supported adhesion, growth, and colony formation of mESCs (Figure 5 center and right columns). Colony morphology on BSFLs was in general more rounded and uniform, whereas colony morphology on MEFs was more varied, ranging from round to somewhat flattened.
Table 1.
mESCs proliferated on BSFLs, and doubling times were similar to those of MEF controls. Quantification of the number of mESCs harvested and their doubling times at each passage.
| Passage | Substrate | # of cells harvested (x105) | Doubling time (hours) |
|---|---|---|---|
| P1 | Flat substrates | 3.7 ± 0.7 | n/a |
| BSFLs | 7.8 ± 1.2 | 19.5 ± 1.6 | |
| MEFs | 9.8 ± 1.6 | 17.3 ± 1.9 | |
| P2 | Flat substrates | 1.4 ± 0.1 | n/a |
| BSFLs | 8.0 ± 0.2 | 18.7 ± 0.3 | |
| MEFs | 7.9 ± 0.6 | 16.0 ± 0.9 | |
| P3 | Flat substrates | 1.5 ± 0.4 | n/a |
| BSFLs | 10.4 ± 1.0 | 17.7 ± 0.9 | |
| MEFs | 12.3 ± 1.4 | 16.0 ± 0.9 |
At P1, there were significantly more colonies per FOV on BSFLs and MEFs than on Flat substrates and significantly more colonies on MEFs than on BSFLs (Figure 6A). At P2, there were also significantly more colonies on MEFs than on BSFLs. These trends continued at P3, with significantly more colonies per FOV on BSFLs and MEFs than on Flat substrates. As before, there were significantly more colonies on MEFs than on BSFLs. Additionally, there were significantly more colonies per FOV on BSFLs at P3 than at P2.
Figure 6.

Topographical features promoted mESC colony formation. (A) The average number of colonies per FOV and (B) the average area of colonies were calculated across passages. #: no flat condition available; harvested cells in P1 were only sufficient for passage to P3 experiments. * indicates p < 0.05 by two-way ANOVA for BSFL and MEF, + indicates p < 0.05 across BSFL. ^ indicates p < 0.05 by one-way ANOVA within P1 and P3. Average ± SEM.
At P1, the average areas of individual colonies on BSFLs and MEFs were significantly higher than the area of colonies on Flat substrates (Figure 6B). At P2, the average area of colonies on BSFLs was significantly higher than the average area of colonies on MEFs. As mentioned previously, no Flat condition existed at P2. At P3, the average areas of colonies on BSFLs and MEFs were significantly larger than the area of colonies on Flat substrates.
3.4. mESCs maintained their stem cell phenotype on BSFLs
To determine if mESC cultures on BSFLs or MEFs were undifferentiated after 3 passages, we performed Oct-4 staining (Figure 7). mESC colonies cultured on BSFLs for 3 passages were Oct-4 positive, as were colonies on MEFs. Across all substrates, all colonies appeared to be Oct-4 positive and no apparent difference in Oct-4 fluorescent intensity was observed. Oct-4 staining also confirmed the 3D nature of the colonies as well as their compact morphology. While Flat conditions contained Oct-4 positive colonies, the colonies were sporadic and smaller in size than colonies on BSFLs or MEFs, and individual, Oct-4 positive cells were found scattered across the surfaces of the Flat substrates. These data indicate that in feeder-free cultures, cells express a nuclear marker that is characteristic of pluripotency and self-renewal.
Figure 7.

BSFLs supported the self-renewal of mESCs. Micrographs of colonies cultured on MEF (top row, fluorescent), BSFL (middle row, confocal) and Flat (bottom row) substrates at passage three, stained for DAPI (first column), Oct-4 (second column) and merged (third column). Scale bar = 60 μm.
3.5. mESCs maintained on BSFLs formed embryoid bodies and had the ability to differentiate
To determine whether mESCs cultured in feeder-free conditions retained the features of cells grown on MEF feeder layers, we evaluated the ability of mESCs cultured for three passages on BSFLs to form EBs and differentiate. mESCs cultured and passaged either on BSFLs or MEFs started forming EBs after one day of being transferred to untreated Petri dishes in differentiation medium (medium without LIF supplementation). After seven days in suspension, EBs were transferred to gelatin coated dishes. EBs fully attached to the surface by the second day, and cells began emerging from the EBs. At this point, cellular morphology was heterogeneous, suggesting the cells were starting to differentiate (Figure 8, top panels). Extension-like features were also seen emanating from clusters of cells at this time. After seven days in culture, no clear EB boundaries existed, and the cells arising from the EBs had formed a monolayer covering the surface of the dish. Heterogeneous cellular morphologies were also characteristic of this stage for both conditions (Figure 8, bottom panels). In some instances, clusters of cells also exhibited a beating behavior, characteristic of mesodermal differentiation (Supplemental Video).
Figure 8.

Colonies from BSFLs maintained their ability to form embryoid bodies (EBs) on gelatin-coated dishes at day 2 and day 7. Phase contrast micrographs of corresponding low magnification (left column) and high magnification (right column) images showing EBs with mESCs originated from BSFLs or MEF controls. Red arrows point to extension-like features emanating from the EBs indicating differentiation. Dashed black line represents the EB border. Scale bars = 60 μm (left column), 30 μm (right column).
As a proof of principle of differentiation capacity, we used immunostaining to determine whether cells were capable of spontaneously differentiating into precursors of the three germ layers. Selective staining for nestin and AFP, markers for ectodermal and endodermal differentiation, respectively, were observed in cells originally cultured on either BSFLs or MEFs (Figure 9A–B, E–F). Selective staining for AFP and SMA, markers for endodermal and mesodermal differentiation, respectively, were also observed in cells originally cultured on either BSFLs or MEFs (Figure 9C–D, G–H).
Figure 9.

mESCs differentiated into precursors of the three germ layers. Corresponding phase micrographs (A, C, E, G) and fluorescence micrographs (B, D, F, H) of mESCs previously cultured and passaged on BSFLs (A–D) or on MEF controls (E–H), stained for (B, F) α-fetoprotein (AFP) and nestin or (D, H) AFP and smooth muscle actin (SMA) after differentiation was induced. All nuclei were stained with DAPI. Scale bar = 30 μm.
4. Discussion
To gain insight into the effectiveness of MEF feeder layers, we have examined the non-biochemical factors that MEFs provide, in the context of a well-established model culture system, including mESCs, gelatin coating, and serum-containing media. To the best of our knowledge, this study provides the first investigation of the influence of the physical characteristics of MEFs on mESC self-renewal and propagation. Here, AFM imaging and mechanical testing of MEF feeder layers provided physiologically relevant targets for elastic modulus and feature shapes and sizes that were then incorporated into our biomimetic synthetic surfaces. These BSFLs presented a novel combination of MEF compliance and MEF micro- and nano-scale topographical features.
A key finding of this study was that the acellular BSFL maintained the self-renewal and stemness of mESCs to a similar extent as MEF controls did. Our findings show that mESCs on BSFLs had a similar doubling time as mESCs on MEFs, while Flat substrates did not support mESC growth. Of note, the doubling times reported here lie within the range of previously reported doubling times for mESCs [28]. These findings point to the importance of MEF topography and roughness in modulating stem cell function, since Flat substrates with the same stiffness as BSFLs showed minimal attachment of single cells and no substantial colony formation.
The effects of stiffness and of topography on stem cell self-renewal have been studied by a few groups [12,13, 29–32]. Recently, Cetinkaya et al. suggested that 3D nanofibrillar scaffolds are better suited for studying differentiation than self-renewal [29]. Franzin et al. showed that 15 kPa PA gels, when micropatterned with a circular pattern of Matrigel (300 μm diameter, 700μm spacing), could support the maintenance of mESC stemness [12]. Lu et al. also examined the maintenance of mESC stemness, in response to combinations of topography and stiffness [13]. Collagen-coated PA of 6.1 kPa was more supportive of stemness than collagen-coated PA of 46.7 kPa, and hexagonal and pillar topographies of 5–15 μm dimensions were more supportive than groove topography – but only when incorporated into the stiffer materials. Thus, they suggested that in those studies, stiffness acted as a primary regulatory factor, while topography acted in a secondary manner. When Chowdhury et al. investigated the role of substrate stiffness by culturing mESCs on flat, collagen-coated PA gels that matched the intrinsic stiffness of mESCs, they reported more uniform, compact, and undifferentiated colonies on softer gels (0.6 kPa) when compared to colonies on rigid plastic dishes [15]. Taken together with the present results, these findings emphasize the significance of substrate stiffness and MEF-scale topographical features in influencing and potentially directing mESC functions.
In the present study, we demonstrated that BSFLs promoted the adhesion and colony formation of mESCs. Further, we confirmed that mESCs cultured on BSFLs were pluripotent, by their abilities to form EBs and yield a heterogeneous cell population that consisted of cellular precursors for all three germ layers. The role of mechanical cues in cellular behavior has begun to be investigated, and efforts are currently underway to elucidate the complex process of mechanotransduction and how it changes with cell phenotype. The topographical features of the physical environment that a cell encounters are also being evaluated (for review see [33]). Interestingly, when MEF-ESC physical contact was prevented by a microporous Trans-well membrane, ESCs did not maintain their self-renewal state but rather, differentiated [34]. This suggests that MEF-ESC physical contact may be required for the maintenance of ESC self-renewal and points to possible stiffness and/or topography-driven mechanisms.
Some advances in defining culture conditions have not been sufficient to prevent the spontaneous differentiation of hESCs [35] or, alternatively, require the use of recombinant proteins [36]. Further, some commercially available defined media require the culture of ESCs on Matrigel, a not-completely-defined mixture of proteins derived from mouse sarcoma [37]. In a recent study using defined media, human pluripotent stem cells showed different differentiation potentials, depending on whether they were cultured on MEFs or on recombinant human vitronectin peptide [38]. This result, along with the present study, suggests that MEFs may provide non-biochemical factors that are important for pluripotent stem cell function.
5. Conclusions
We conclude that a BSFL presenting the stiffness and topography of live MEFs can sustain undifferentiated and pluripotent mESCs that can differentiate into precursors of the three germ layers. It is conceivable that with careful biomimetic design, a substrate presenting the stiffness and topographical features of the appropriate feeder cells, may prove sufficient for maintaining the self-renewal and pluripotency characteristics of hESCs and induced pluripotent stem cells. In this way the stem cell community could attain a tailorable and versatile tool to further understand the function of stem cells and advance their enormous potential.
Supplementary Material
Supplemental video 1. Beating behavior was observed on mESCs previously cultured and passaged on BSFLs.
Suplemental Figure 1. BSFL and flat PA substrates bound similar amounts of FITC-BSA. Average total fluorescence intensity was similar between substrates. p>0.05 by t-Test. Average ± SD.
Statement of Significance.
Embryonic stem cells (ESCs) have enormous potential to aid therapeutics, because they can renew themselves and become different cell types. This study addresses a key challenge for ESC use – growing them safely for human patients. ESCs typically grow with a feeder layer of mouse fibroblasts. Since patients have a risk of immune response to feeder layer cells, we have developed a material to mimic the feeder layer and eliminate this risk. We investigated the influence of feeder layer topography and stiffness on mouse ESCs. While the biomimetic synthetic feeder layer (BSFL) contains no live cells, it replicates the stiffness and topography of feeder layer cells. Significantly, ESCs grown on BSFLs retain their abilities to grow and become multiple cell types.
Acknowledgments
The authors thank Nicholas Labriola for help with AFM topography scans and Yu-Ting Liu Dingle PhD, Samantha Brady, and Michael Kader for their help with data analysis We thank Molly Boutin for help with graphical abstract. This work was supported by NIH IMSD R25GM083270-01 and NSF Graduate Research Fellowship to CLF; NIH R01 EB005722-01, NSF Advance and CAREER Awards and CBET 1134166 to DHK and NIH R00AR054673, P20GM104937, R01AR063642, and NSF CAREER Award CBET1253189 to EMD.
Footnotes
Publisher's Disclaimer: This is a PDF file of an unedited manuscript that has been accepted for publication. As a service to our customers we are providing this early version of the manuscript. The manuscript will undergo copyediting, typesetting, and review of the resulting proof before it is published in its final citable form. Please note that during the production process errors may be discovered which could affect the content, and all legal disclaimers that apply to the journal pertain.
Contributor Information
Cristina López-Fagundo, Email: clopezfagundo@gmail.com.
Liane L. Livi, Email: liane_livi@brown.edu.
Talisha Ramchal, Email: talisha.ramchal@duke.edu.
Eric M. Darling, Email: Eric_Darling@brown.edu.
Diane Hoffman-Kim, Email: dhk@brown.edu.
References
- 1.Evans MJ, Kaufman MH. Establishment in culture of pluripotential cells from mouse embryos. Nature. 1981;292:154–6. doi: 10.1038/292154a0. [DOI] [PubMed] [Google Scholar]
- 2.Thomson JA, Itskovitz-Eldor J, Shapiro SS, Waknitz MA, Swiergiel JJ, Marshall VS, Jones JM. Embryonic stem cell lines derived from human blastocysts. Science. 1998;282:1145–7. doi: 10.1126/science.282.5391.1145. [DOI] [PubMed] [Google Scholar]
- 3.Reubinoff BE, Pera MF, Fong C-Y, Trounson A, Bongso A. Embryonic stem cell lines from human blastocysts: somatic differentiation in vitro. Nature biotechnology. 2000;18:399–404. doi: 10.1038/74447. [DOI] [PubMed] [Google Scholar]
- 4.Moore H. The medium is the message. Nature biotechnology. 2006;24:160–1. doi: 10.1038/nbt0206-160. [DOI] [PubMed] [Google Scholar]
- 5.Lim JWE, Bodnar A. Proteome analysis of conditioned medium from mouse embryonic fibroblast feeder layers which support the growth of human embryonic stem cells. Proteomics. 2002;2:1187–203. doi: 10.1002/1615-9861(200209)2:9<1187::AID-PROT1187>3.0.CO;2-T. [DOI] [PubMed] [Google Scholar]
- 6.Marklein RA, Burdick JA. Controlling stem cell fate with material design. Advanced Materials. 2010;22:175–89. doi: 10.1002/adma.200901055. [DOI] [PubMed] [Google Scholar]
- 7.Kaini RR, Shen-Gunther J, Cleland JM, Greene WA, Want H-C. Recombinant xeno-free vitronectin supports self-renewal and pluripotency in protein induced pluripotent stem cells. Tissue Engineering Part C Methods. 2016 doi: 10.1089/ten.TEC.2015.0180. In press. [DOI] [PubMed] [Google Scholar]
- 8.Takenaka C, Miyajima H, Yoda Y, Imazato H, Yamamoto T, Gomi S, Ohshima Y, Kagawa K, Sasaki T, Kawamata S. Controlled growth and the maintenance of human pluripotent stem cells by cultivation with defined medium on extracellular matrix-coated micropatterned dishes. PLOS One. 2015 doi: 10.1371/journal.pone.0129855. doi:10.1371. [DOI] [PMC free article] [PubMed] [Google Scholar]
- 9.Brafman DA, Shah KD, Fellner T, Chien S, Willert K. Defining long-term maintenance conditions of human embryonic stem cells with arrayed cellular microenvironment technology. Stem cells and development. 2009;18:1141–54. doi: 10.1089/scd.2008.0410. [DOI] [PubMed] [Google Scholar]
- 10.Gerecht S, Burdick JA, Ferreira LS, Townsend SA, Langer R, Vunjak-Novakovic G. Hyaluronic acid hydrogel for controlled self-renewal and differentiation of human embryonic stem cells. Proceedings of the National Academy of Sciences. 2007;104:11298–303. doi: 10.1073/pnas.0703723104. [DOI] [PMC free article] [PubMed] [Google Scholar]
- 11.Abraham S, Eroshenko N, Rao RR. Role of bioinspired polymers in determination of pluripotent stem cell fate. Regenerative medicine. 2009;4:561–78. doi: 10.2217/rme.09.23. [DOI] [PMC free article] [PubMed] [Google Scholar]
- 12.Franzin C, Piccoli M, Serena E, Bertin E, Urbani L, Luni C, Pasqualetto V, Eaton S, Elvassore N, De Coppi P, Pozzobon M. Single-cell PCR analysis of murine embryonic stem cells cultured on different substrates highlights heterogeneous expression of stem cell markers. Biology of the cell / under the auspices of the European Cell Biology Organization. 2013;105:549–60. doi: 10.1111/boc.201300034. [DOI] [PubMed] [Google Scholar]
- 13.Lu D, Luo C, Zhang C, Li Z, Long M. Differential regulation of morphology and stemness of mouse embryonic stem cells by substrate stiffness and topography. Biomaterials. 2014;35:3945–55. doi: 10.1016/j.biomaterials.2014.01.066. [DOI] [PubMed] [Google Scholar]
- 14.Task K, D’Amore A, Singh S, Candiello J, Jaramillo M, Wagner WR, Kumta P, Banerjee I. Systems level approach reveals the correlation of endoderm differentiation of mouse embryonic stem cells with specific microstructural cues of fibrin gels. Journal of the Royal Society, Interface / the Royal Society. 2014;11:20140009. doi: 10.1098/rsif.2014.0009. [DOI] [PMC free article] [PubMed] [Google Scholar]
- 15.Chowdhury F, Li Y, Poh Y-C, Yokohama-Tamaki T, Wang N, Tanaka TS. Soft substrates promote homogeneous self-renewal of embryonic stem cells via downregulating cell-matrix tractions. PLoS One. 2010;5:e15655. doi: 10.1371/journal.pone.0015655. [DOI] [PMC free article] [PubMed] [Google Scholar]
- 16.Engler AJ, Sen S, Sweeney HL, Discher DE. Matrix elasticity directs stem cell lineage specification. Cell. 2006;126:677–89. doi: 10.1016/j.cell.2006.06.044. [DOI] [PubMed] [Google Scholar]
- 17.Bakhru S, Nain AS, Highley C, Wang J, Campbell P, Amon C, Zappe S. Direct and cell signaling-based, geometry-induced neuronal differentiation of neural stem cells. Integrative biology : quantitative biosciences from nano to macro. 2011;3:1207–14. doi: 10.1039/c1ib00098e. [DOI] [PubMed] [Google Scholar]
- 18.Dalby MJ, Gadegaard N, Tare R, Andar A, Riehle MO, Herzyk P, Wilkinson CD, Oreffo RO. The control of human mesenchymal cell differentiation using nanoscale symmetry and disorder. Nat Mater. 2007;6:997–1003. doi: 10.1038/nmat2013. [DOI] [PubMed] [Google Scholar]
- 19.Oh S, Brammer KS, Li YS, Teng D, Engler AJ, Chien S, Jin S. Stem cell fate dictated solely by altered nanotube dimension. Proceedings of the National Academy of Sciences of the United States of America. 2009;106:2130–5. doi: 10.1073/pnas.0813200106. [DOI] [PMC free article] [PubMed] [Google Scholar]
- 20.Bruder JM, Lee AP, Hoffman-Kim D. Biomimetic materials replicating Schwann cell topography enhance neuronal adhesion and neurite alignment in vitro. Journal of Biomaterials Science Polymer Edition. 2007;18:967–982. doi: 10.1163/156856207781494412. [DOI] [PubMed] [Google Scholar]
- 21.Kofron CM, Liu Y-T, Lopez-Fagundo C, Mitchel JA, Hoffman-Kim D. neurite outgrowth at the biomimetic interface. Annals of Biomedical Engineering. 2010;38:2210–2225. doi: 10.1007/s10439-010-0054-y. [DOI] [PMC free article] [PubMed] [Google Scholar]
- 22.Bruder JM, Monu NC, Harrison MW, Hoffman-Kim D. Fabrication of polymeric replicas of cell surfaces with nanoscale resolution. Langmuir. 2006;22:8266–70. doi: 10.1021/la0608563. [DOI] [PubMed] [Google Scholar]
- 23.Darling EM, Topel M, Zauscher S, Vail TP, Guilak F. Viscoelastic properties of human mesenchymally-derived stem cells and primary osteoblasts, chondrocytes, and adipocytes. Journal of biomechanics. 2008;41:454–64. doi: 10.1016/j.jbiomech.2007.06.019. [DOI] [PMC free article] [PubMed] [Google Scholar]
- 24.Darling EM, Wilusz RE, Bolognesi MP, Zauscher S, Guilak F. Spatial mapping of the biomechanical properties of the pericellular matrix of articular cartilage measured in situ via atomic force microscopy. Biophys J. 2010;98:2848–56. doi: 10.1016/j.bpj.2010.03.037. [DOI] [PMC free article] [PubMed] [Google Scholar]
- 25.Darling EM. Force scanning: a rapid, high-resolution approach for spatial mechanical property mapping. Nanotechnology. 2011;22:175707. doi: 10.1088/0957-4484/22/17/175707. [DOI] [PMC free article] [PubMed] [Google Scholar]
- 26.Gilchrist CL, Darling EM, Chen J, Setton LA. Extracellular matrix ligand and stiffness modulate immature nucleus pulposus cell-cell interactions. PLoS One. 2011;6:e27170. doi: 10.1371/journal.pone.0027170. [DOI] [PMC free article] [PubMed] [Google Scholar]
- 27.Chung S, Sonntag KC, Andersson T, Bjorklund LM, Park JJ, Kim DW, Kang UJ, Isacson O, Kim KS. Genetic engineering of mouse embryonic stem cells by Nurr1 enhances differentiation and maturation into dopaminergic neurons. The European journal of neuroscience. 2002;16:1829–38. doi: 10.1046/j.1460-9568.2002.02255.x. [DOI] [PMC free article] [PubMed] [Google Scholar]
- 28.Takahashi K, Yamanaka S. Induction of pluripotent stem cells from mouse embryonic and adult fibroblast cultures by defined factors. Cell. 2006;126:663–76. doi: 10.1016/j.cell.2006.07.024. [DOI] [PubMed] [Google Scholar]
- 29.Çetinkaya G, Türkoğlu H, Arat S, Odaman H, Onur MA, Gümüşderelioğlu M, Tümer A. LIF-immobilized nonwoven polyester fabrics for cultivation of murine embryonic stem cells. Journal of Biomedical Materials Research Part A. 2007;81:911–9. doi: 10.1002/jbm.a.31107. [DOI] [PubMed] [Google Scholar]
- 30.Nur EKA, Ahmed I, Kamal J, Schindler M, Meiners S. Three-dimensional nanofibrillar surfaces promote self-renewal in mouse embryonic stem cells. Stem Cells. 2006;24:426–33. doi: 10.1634/stemcells.2005-0170. [DOI] [PubMed] [Google Scholar]
- 31.Mei Y, Saha K, Bogatyrev SR, Yang J, Hook AL, Kalcioglu ZI, Cho S-W, Mitalipova M, Pyzocha N, Rochas F. Combinatorial development of biomaterials for clonal growth of human pluripotent stem cells. Nature materials. 2010;9:768–78. doi: 10.1038/nmat2812. [DOI] [PMC free article] [PubMed] [Google Scholar]
- 32.Trappmann B, Gautrot JE, Connelly JT, Strange DG, Li Y, Oyen ML, Stuart MAC, Boehm H, Li B, Vogel V. Extracellular-matrix tethering regulates stem-cell fate. Nature materials. 2012;11:642–9. doi: 10.1038/nmat3339. [DOI] [PubMed] [Google Scholar]
- 33.Hoffman-Kim D, Mitchel JA, Bellamkonda RV. Topography, cell response, and nerve regeneration. Annual review of biomedical engineering. 2010;12:203. doi: 10.1146/annurev-bioeng-070909-105351. [DOI] [PMC free article] [PubMed] [Google Scholar]
- 34.Rathjen PD, Toth S, Willis A, Heath JK, Smith AG. Differentiation inhibiting activity is produced in matrix-associated and diffusible forms that are generated by alternate promoter usage. Cell. 1990;62:1105–14. doi: 10.1016/0092-8674(90)90387-t. [DOI] [PubMed] [Google Scholar]
- 35.Ludwig TE, Levenstein ME, Jones JM, Berggren WT, Mitchen ER, Frane JL, Crandall LJ, Daigh CA, Conard KR, Piekarczyk M. Derivation of human embryonic stem cells in defined conditions. Nature biotechnology. 2006;24:185–7. doi: 10.1038/nbt1177. [DOI] [PubMed] [Google Scholar]
- 36.Li Y, Powell S, Brunette E, Lebkowski J, Mandalam R. Expansion of human embryonic stem cells in defined serum - free medium devoid of animal - derived products. Biotechnology and bioengineering. 2005;91:688–98. doi: 10.1002/bit.20536. [DOI] [PubMed] [Google Scholar]
- 37.Kleinman HK, Martin GR. Seminars in cancer biology. Elsevier; 2005. Matrigel: basement membrane matrix with biological activity; pp. 378–86. [DOI] [PubMed] [Google Scholar]
- 38.Lippmann ES, Estevez-Silva MC, Ashton RS. Defined human pluripotent stem cell culture enables highly efficient neuroepithelium derivation without small molecule inhibitors. Stem Cells. 2014;32:1032–1042. doi: 10.1002/stem.1622. [DOI] [PubMed] [Google Scholar]
Associated Data
This section collects any data citations, data availability statements, or supplementary materials included in this article.
Supplementary Materials
Supplemental video 1. Beating behavior was observed on mESCs previously cultured and passaged on BSFLs.
Suplemental Figure 1. BSFL and flat PA substrates bound similar amounts of FITC-BSA. Average total fluorescence intensity was similar between substrates. p>0.05 by t-Test. Average ± SD.