

Abstract
Structural magnetic resonance imaging (MRI) scans at high spatial resolution can detect potential foci of early brain dysmaturation in children with autism spectrum disorders (ASD). In addition, comparison between MRI and behavior measures over time can identify patterns of brain change accompanying specific outcomes. We report structural MRI data from two time points for a total of 84 scans in children with ASD and 30 scans in typical controls (mean age time one = 4.1 years, mean age at time two = 6.6 years). Surface‐based cortical morphometry and linear mixed effects models were used to link changes in cortical anatomy to both diagnostic status and individual differences in changes in language and autism severity. Compared with controls, children with ASD showed accelerated gray matter volume gain with age, which was driven by a lack of typical age‐related cortical thickness (CT) decrease within 10 cortical regions involved in language, social cognition, and behavioral control. Greater expressive communication gains with age in children with ASD were associated with greater CT gains in a set of right hemisphere homologues to dominant language cortices, potentially identifying a compensatory system for closer translational study. Hum Brain Mapp 37:2616–2629, 2016. © 2016 Wiley Periodicals, Inc.
Keywords: autism spectrum disorder, cortical thickness, surface based morphometry, expressive language, MRI
INTRODUCTION
Autism spectrum disorder (ASD) is a common neurodevelopmental disorder that is behaviorally defined, emerges early in life, encompasses a heterogeneous range of presentations, and is characterized by deficits in social communication and patterns of restrictive/repetitive behavior [American Psychiatric Association, 2013]. Genetically‐driven disruptions of early brain development [Willsey et al., 2013], combined with environmental effects [Hallmayer et al., 2011] are thought to play an important role in ASD pathogenesis, but the growing neuroimaging literature in ASD has yet to identify neuroanatomical or functional markers that specifically and consistently accompany an ASD diagnosis [Philip et al., 2012; Stigler et al., 2011].
The majority of structural neuroimaging studies in ASD have included older children, adolescents, or adults, and have used cross‐sectional study designs [Ecker et al., 2010; Hadjikhani et al., 2006; Hyde et al., 2010]. These studies hint at a potentially triphasic pattern of brain development in ASD, with increased brain growth in the very early years, normalization in late childhood, faster gray matter loss beginning in the teen years, and reduced gray matter loss with age in the adult years [Lange et al., 2015; Zielinski et al., 2014]. However, while these studies are useful for characterizing the brain in autism, understanding brain changes during the developmental window when ASD symptoms first emerge requires longitudinal measures of brain anatomy during early childhood. Neuroimaging research in young children with ASD has begun to incorporate longitudinal study designs [Courchesne et al., 2011; Hardan et al., 2009; Hazlett et al., 2011; Lange et al., 2015; Zielinski et al., 2014], but these approaches have yet to be combined with vertex‐based image analysis methods that can map changes in cortical thickness (CT) and surface area (SA) across the cortical sheet. Integration of these two approaches is important for localizing early brain dysmaturation in ASD, as well as identifying patterns of neuroanatomical change that accompanying more desirable patterns of skill attainment.
In a recent cross‐sectional neuroimaging study of preschool‐aged children with ASD, we used surface‐based methods for cortical morphometry to evaluate differences in CT and SA relative to typically developing controls [Raznahan et al., 2013]. This study showed that CT was greater in ASD than in controls in multiple cortical regions associated with social cognition and behavioral regulation, including the superior frontal gyrus, inferior frontal gyrus, medial temporal gyrus, superior temporal gyrus, and intraparietal sulcus [Raznahan et al., 2013]. In contrast to these CT differences, regional SA measures in ASD were not statistically distinguishable from those in typically developing controls. Regional CT variation has also been highlighted as a neuroanatomical phenotype of interest by several neuroimaging studies of ASD [Chung et al., 2005; Doyle‐Thomas et al., 2013; Ecker et al., 2013, 2010, 2014; Hadjikhani et al., 2006; Hardan et al., 2009, 2006; Hyde et al., 2010; Jiao et al., 2010; Mak‐Fan et al., 2012; Misaki et al., 2012; Raznahan et al., 2013, 2010; Scheel et al., 2011; Wallace et al., 2010, 2015; Zhou et al., 2013, 2014; Zielinski et al., 2014], and CT variation is associated with autistic traits both in typical individuals and those with ASD [Doyle‐Thomas et al., 2013; Hadjikhani et al., 2006; Hardan et al., 2009; Richter et al., 2015; Wallace et al., 2015; Wallace et al., 2012]. However, only two studies of change over time have included very young children [Hazlett et al., 2011; Zielinski et al., 2014]. Further, studies have yet to investigate relations between CT change and changes in measures of autism symptoms in young children.
The current study extends our previous cross‐sectional work by using neuroimaging over time and vertex‐based analyses to investigate neuroanatomical change in a sample of young children with ASD. We compare brain development between children with ASD and TD controls, and also investigate how brain development over time relates to specific areas of behavioral change within ASD. We focus on the following two questions: First, are differences in CT between ASD and TD developmentally dynamic within early childhood? Second, is change in CT related to clinically meaningful developmental changes in young children with ASD? Here, we specifically focus on changes in communication because of their importance in predicting adult outcomes in ASD [Magiati et al., 2014], and relationship to CT in both ASD [Balardin et al., 2015] and TD [Brouwer et al., 2014; Porter et al., 2011]. We also focus on symptom severity change in two domains of deficit in ASD (i.e., restrictive interests and repetitive behaviors, and social communication), which have been found to correlate with static neuroanatomical measures [Hadjikhani et al., 2006; Knaus et al., 2010; Rojas et al., 2006].
MATERIALS AND METHODS
This study was approved by an NIH Institutional Review Board and was performed in accordance with the guidelines and regulations thereof and in compliance with the Declaration of Helsinki. The nature of the experimental procedures was explained to parents/guardians of all participants, and written informed consent was obtained from all participants' parents/guardians.
Participants
Participants included 57 children (11 females) enrolled in a natural history study who were selected for the current analyses based on having two high‐quality MRI scans (see Table 1). The cohort was initially within the age range of 2 to 7 years, and the time between scans ranged from 0.86 to 3.57 years, with no difference in interscan interval between groups. Forty‐two children were included in a group defined by diagnosis of DSM‐IV defined autistic disorder (referred to here as ASD), while 15 children participated as typically developing controls (TDC). At each visit, all children completed the Autism Diagnostic Observation Schedule (ADOS) [Lord et al., 2000], the Vineland Adaptive Behavior Scales, 2nd Edition (VABS) [Sparrow et al., 2005], and either the Mullen Scales of Early Development (MSEL) [Mullen, 1995], the Differential Ability Scales‐II (DAS‐II) [Elliott, 2007], or the Wechsler Intelligence Scale for Children (WISC‐IV) [Wechsler, 2004], depending on age and ability level. At both time points, there were no significant differences between groups on either age or time between scans, but the ASD group did have significantly more males and lower verbal and nonverbal DQ (see Table 1).
Table 1.
Participant Characteristics
| Characteristic | ASD mean (SD) [range] | TD mean (SD) [range] | Group difference |
|---|---|---|---|
| Number (scans) | 42 (84) | 15 (30) | |
| Sex (m:f) | 38:4 | 8:7 | χ 2 = 9.8, P=0.004 |
| Time between scans (yr) | 2.5 (0.67) | 2.4 (0.64) | F = 0.21, P = 0.7 |
| [1.1–3.6] | [0.86–3.2] | ||
| Age | |||
| Time 1 | 4.0 (1.2) | 4.4 (1.3) | F = 1.6, P = 0.21 |
| [2.2–7.5] | [2.5–7.0] | ||
| Time 2 | 6.5 (1.2) | 6.8 (1.3) | F = 0.9, P = 0.35 |
| [3.6–9.0] | [4.4–8.8] | ||
| Verbal DQa | |||
| Time 1 | 41.7 (21.4) | 107.8 (15.2) | F = 120.6, P < 0.001 |
| [11.7–96.4] | [87.8–151.5] | ||
| Time 2 | 41.9 (28.7) | 120.8 (19.6) | F = 97.0, P < 0.001 |
| [9.2–109.0] | [89.0–147.1] | ||
| Nonverbal DQa | |||
| Time 1 | 60.4 (18.1) | 105.1 (11.7) | F = 78.8, P < 0.001 |
| [20.1–109.2] | [80.6–129.1] | ||
| Time 2 | 54.3 (26.2) | 116.9 (18.6) | F = 71.9, P < 0.001 |
| [19.4–115.3] | [82.1–140.8] | ||
| VABS expressive language AE | |||
| Time 1 | 16.26 (8.77) | 67.2 (31.77) | F = 180.2, P < 0.001 |
| [3–38] | [25–147] | ||
| Time 2 | 26.98 (18.93) | 138.53 (78.50) | F = 147.8, P < 0.001 |
| [8–90] | [58–264] | ||
| VABS receptive language | |||
| Time 1 | 18.50 (13.44) | 71.0 (49.02) | F = 80.57, P < 0.001 |
| [1–78] | [22–216] | ||
| Time 2 | 31.88 (25.37) | 112.33 (35.93) | F = 176.4, P < 0.001 |
| [9–132] | [59–216] | ||
| ADOS SOC severityb | |||
| Time 1 | 6.83 (1.45) | ||
| [3–10] | |||
| Time 2 | 6.98 (2.08) | ||
| [1–10] | |||
| ADOS RRB severityc | |||
| Time 1 | 8.57 (1.26) | ||
| [5–10] | |||
| Time 2 | 8.35 (1.51) | ||
| [1–10] | |||
| Percent minimally verbald | |||
| Time 1 | 67.4 | ||
| Time 2 | 46.5 |
Verbal Developmental Quotient and Nonverbal Developmental Quotient were measured with the Mullen Scales of Early Learning (n = 90), the Differential Ability Scales (n = 23), and the Wechsler Intelligence Scales for Children (n = 1), depending on age and developmental level of each child. DQs were calculated for each child as Age Equivalent/Chronological Age × 100 to reduce floor effects due to many participants scoring at the floor on standard scores.
ADOS social communication severity score based on a scale of 1 to 10 with 10 being most severe symptoms (Gotham et al., 2009).
ADOS restrictive and repetitive behaviors severity score, based on a scale of 1 to 10 with 10 being most severe symptoms (Gotham et al., 2009).
Minimally verbal status indicates communicative use of five or fewer words during ADOS administration (Thurm et al., 2015).
ASD = autism spectrum disorder; TD = typically developing controls.
To confirm diagnosis in the ASD group before the first scan, the Autism Diagnostic Interview‐Revised (ADI‐R) [Rutter et al., 2003] was administered; parents of the TDC group completed the Social Communication Questionnaire [Rutter et al., 2004] to confirm lack of ASD symptoms. DSM‐IV diagnoses of autistic disorder were confirmed by doctoral‐level clinicians based on the Autism Diagnostic Observation Schedule (ADOS), ADI‐R, and clinical judgment; all children met ASD cutoffs on these measures [Risi et al., 2006]. Exclusion criteria for both groups included impairing neurological disorder other than ASD that would have affected the validity of behavioral testing (e.g., cerebral palsy) and genetic abnormalities based on pathogenic findings from CGH microarray conducted on the ASD sample. All scans were reviewed by a board‐certified radiologist and none were found to have clinically significant anatomical atypicalities. Additional exclusion criteria for the TDC group included having a first‐degree relative with an ASD, a history of premature birth or extremely low birth weight, or history of special education services/early intervention before enrollment.
Neuroimaging
Children with ASD were scanned under sedation, administered by a board‐certified anesthesiologist to minimize movement artifacts [Reuter et al., 2015], whereas the TDC group was scanned during natural night time sleep or while awake and watching a movie. All participants were scanned on the same 1.5 T General Electric Signa scanner (Milwaukee, WI) using a three‐dimensional (3D) spoiled gradient recalled echo sequence with the following image acquisition parameters: Echo time, 5 ms; repetition time, 24 ms; flip angle 45°; acquisition matrix, 256 × 192; number of excitations, 1; and field of view, 24 cm.
Raw T1‐weighted scans were first coded by two independent raters for degree of motion artifact using Blumenthal et al.'s 4‐level coding system (i.e., 1 = none, 2 = mild, 3 = moderate, and 4 = severe) [Blumenthal et al., 2002]. Scans scoring a 1 or a 2 after consensus coding were then submitted to the CIVET pipeline for automated segmentation and modeling of cortical surfaces [Raznahan et al., 2013]. Only scans with accurate skull‐stripping and segmentation at this level were analyzed further. The cortical surfaces from all individual scans were aligned at each of 80,000 vertices using curvature features via a 2D registration algorithm to align sulcal features [Lyttelton et al., 2007]. We focus here on the following CIVET‐derived anatomical metrics of global brain anatomy: gray matter volume (GMV), white matter volume (WMV), cerebrospinal fluid volume (CSF), total tissue volume (TTV, GMV + WMV), total cortical volume (CV), total surface area (SA), and mean cortical thickness (CT). Spatially fine‐grained analyses of cortical anatomy were based on measures of CT taken at ∼80,000 points (vertices) on the modeled cortical surface of each scan [MacDonald et al., 2000]. This is in contrast to other studies of CT, which use parcellation schemes to examine anatomically‐defined regions of interest a priori [e.g., Hazlett et al., 2011; Zielinski et al., 2014].
Statistical Analyses
We used linear mixed effects models to explore group differences in global measures of brain development, including GMV, WMV, CSF, TTV, CV, SA, and CT as well as in CT at the vertex level. In order to test our hypotheses we included main effects of group and age and a group × age interaction in our models [see Eq. (1)]: the interaction tests if there are group differences in brain development over time, and the main effect of group (in the absence of a significant interaction) measures differences in estimated means while controlling for age.
| (1) |
We included a random intercept per person (di) to account for within‐person dependence associated with multiple measures per person, and the residuals (eijs) were modeled with a Standard Normal distribution. For all analyses, we began with this parsimonious, simplified model. Then, in order to ensure our findings were not due to group differences in other variables in our sample known to be associated with cortical anatomy, including sex [Sowell et al., 2007], IQ [Misaki et al., 2012], or in global measures frequently found to differ in this population [Chen et al., 2011], we followed‐up all significant findings by adding sex, nonverbal DQ, and TTV as covariates [see Eq. (2)].
| (2) |
To further assess potential effects of sex on group findings, we also tested the above model with males only [Eq. (3)]:
| (3) |
Finally, for each anatomical metric of interest, we ran the above models after excluding subjects with anatomy scores more than two standard deviations from the sample mean. We used the nlme package (http://CRAN.R-project.org/package=nlme) in R to conduct all mixed model analyses [R Core Team, 2014].
The above approach was taken for both global and vertex‐wise analyses. Vertex‐wise analyses entailed running the models at each of 80,000 vertices across the cortical mantle. Vertex‐wise effects were visualized after false detection rate (FDR) [Genovese et al., 2002] correction for multiple comparisons with q (the expected proportion of falsely rejected null hypotheses) set at 0.05. A separate FDR threshold was determined for each model and was calculated using all effects in the model except the intercept. We used Brain‐view2 [Lerch, 2009] to identify MNI coordinates of the vertex with the highest t‐value within a given area of significance and the Talaraich Daemon [Lancaster et al., 1997] to label the location of these vertices for descriptive purposes.
In order to assess if changes in anatomy were associated with developmental changes in communication and symptom severity within ASD, we focused on the receptive and expressive communication age equivalents from the VABS and the restrictive/repetitive behavior and social communication domain severity scores from the ADOS, respectively. These measures were chosen because they could be gathered over time across children with ranges of abilities, and would not artificially decrease with increasing age (i.e., due to varied rates of change at different ages as seen for DQ [Aiken, 1996]). For each participant with ASD, slopes for VABS scores were calculated as follows:
| (4) |
Slopes for ADOS severity scores were calculated as follows:
| (5) |
Then, slopes were related to vertex‐based measures of anatomy as follows:
| (6) |
Age was centered at the sample mean (5.3 years) in all analyses, including interactions with age, so that the main effects of diagnosis [in Eq. (1)], and interindividual differences in symptom change [in Eq. (2)] could be interpreted at the mean age of our sample. Given our sample size and that we have two time points from each subject, we focus on linear effects in order to capitalize on within‐subject and between‐group effects of time.
RESULTS
Global Measures
Main effects of group membership (ASD, TDC) were not observed for any global anatomical measure (see Table 2). Significant changes over time occurred on all anatomical measures in the TDC group except for GMV and CV. In ASD, significant changes over time occurred on all anatomical measures, with a marginal effect observed for CT. The interaction between diagnosis and age was significant in the GMV model, with a greater increase in volume over time in ASD versus TDC. This pattern was also observed in CV, which accounts for the bulk of total GMV in humans. The interaction between diagnosis and age was not significant in modeling SA, but was for CT. Specifically, individuals in the TDC group showed greater decrease of CT over time than individuals with ASD. Thus, differences in age‐related CV change between children with ASD and controls were underpinned by an attenuation of the typical pattern of age‐related CT reduction in ASD. This, alongside similar rates of age‐related SA increase in both groups, resulted in a greater rate of CV gain in children with ASD compared with the TDC group (see Fig. 1). These results remained significant in models accounting for sex, nonverbal DQ, and TTV, when modeled in males only, and when excluding data from participants with CT slopes over two SDs from the mean (for CT and SA analyses, see Supporting Information Table I).
Table 2.
Main effects and group by age interaction for global anatomy
| Main effect of group | ASD Mean (SE) | TDC Mean (SE) | β (SE) | p |
|---|---|---|---|---|
| Total tissue volume (cm3) | 1,322 (16.3) | 1,285 (27.2) | −36.8 (31.7) | 0.25 |
| Cerebrospinal fluid volume (cm3) | 1,28.3 (3.0) | 119.2 (5.0) | −9.1 (5.9) | 0.13 |
| White matter volume (cm3) | 419.2 (6.6) | 410.9 (11.1) | −8.3 (12.9) | 0.52 |
| Grey matter volume (cm3) | 902.9 (10.5) | 876.3 (17.6) | −28.4 (20.6) | 0.20 |
| Cortical volume (cm3) | 670.9 (8.6) | 651.2 (14.4) | −21.1 (16.9) | 0.24 |
| Surface area (mm2) | 1,839.9 (19) | 1,780.3 (32.2) | −59.7 (37.5) | 0.12 |
| Mean cortical thickness (mm) | 3.83 (0.02) | 3.82 (0.03) | −0.02 (0.04) | 0.70 |
| ASD | ||||
|---|---|---|---|---|
| Main effect of age—ASD | β | SE | t | p |
| Total tissue volume (cm3) | 33.4 | 2.4 | 13.8 | <0.001 |
| Cerebrospinal fluid volume (cm3) | 3.7 | 0.97 | 3.8 | <0.001 |
| White matter volume (cm3) | 18.4 | 1.1 | 16.4 | <0.001 |
| Grey matter volume (cm3) | 14.8 | 1.8 | 8.4 | <0.001 |
| Cortical volume (cm3) | 10.6 | 1.3 | 7.9 | <0.001 |
| Surface area (mm2) | 46.3 | 3.0 | 15.5 | <0.001 |
| Mean cortical thickness (mm) | −0.01 | 0.006 | −1.9 | 0.06 |
| Main effect of age—TD | TD | |||
|---|---|---|---|---|
| β | SE | t | p | |
| Total tissue volume (cm3) | 28.3 | 3.7 | 7.6 | <0.001 |
| Cerebrospinal fluid volume (cm3) | 6.7 | 1.6 | 4.1 | <0.001 |
| White matter volume (cm3) | 21.1 | 1.9 | 11.1 | <0.001 |
| Grey matter volume (cm3) | 6.8 | 3.7 | 1.9 | 0.08 |
| Cortical volume (cm3) | 4.6 | 2.8 | 1.7 | 0.12 |
| Surface area (mm2) | 44.8 | 5.3 | 8.5 | <0.001 |
| Mean cortical thickness (mm) | −0.04 | 0.01 | −3.4 | 0.003 |
| Interaction of group and age | β a | SE | t | p |
|---|---|---|---|---|
| Total tissue volume (cm3) | −5.3 | 4.7 | −1.1 | 0.26 |
| Cerebrospinal fluid volume (cm3) | 3.1 | 1.9 | 1.6 | 0.11 |
| White matter volume (cm3) | 2.5 | 2.2 | 1.1 | 0.26 |
| Grey matter volume (cm3) | −7.9 | 3.7 | −2.1 | 0.04 |
| Cortical volume (cm3) | −5.8 | 2.8 | −2.1 | 0.04 |
| Surface area (mm2) | −1.3 | 6.0 | −.22 | 0.83 |
| Mean cortical thickness (mm) | −0.03 | 0.01 | −2.4 | 0.02 |
Main effect of group statistics reflects effect of group after accounting for the main effect of age.
β weights for interaction model with ASD as the reference group.
SE = standard error.
Figure 1.
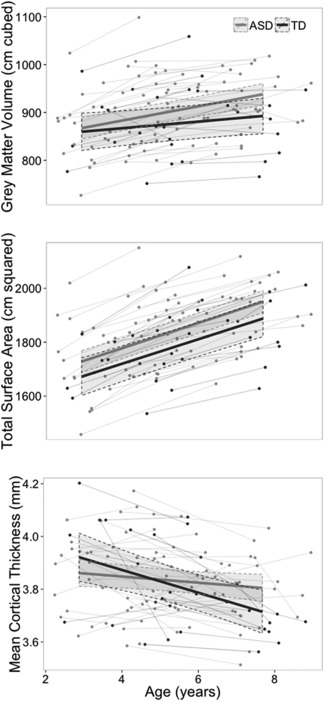
Change in anatomy with age for grey matter volume, total surface area, and mean cortical thickness in autism spectrum disorder (ASD) and typically developing controls (TDC).
Vertex‐Level Cortical Thickness Measures
In order to further characterize group differences in CT change with age, we completed vertex‐based CT analyses. Our vertex‐based analyses for the group‐by‐age interaction revealed vertices within several regions where developmental patterns of CT change differed between groups. These differences were localized to vertices within left precentral gyrus, supramarginal gyrus, middle temporal gyrus, and cuneus, as well as within the right frontal pole, superior frontal gyrus, postcentral gyrus, inferior temporal gyrus, fusiform gyrus, and precuneus (see Fig. 2, Supporting Information Table I for coordinates of peak vertex). At each of these vertices, the TDC group showed significant CT decreases with time, while individuals with ASD showed less CT decrease (left supramarginal gyrus, right medial frontal gyrus), no change over time (left precentral gyrus, left middle temporal gyrus, right inferior temporal gyrus, right superior frontal gyrus, right fusiform gyrus, right precuneus, right postcentral gyrus), or even CT increases over time (left cuneus). Significant group‐by‐age interaction in these regions was confirmed by sensitivity analyses using a model accounting for sex, TTV, and nonverbal DQ, a model within males only, and after excluding data from participants with CT values over two SDs from the mean (see Supporting Information Fig. 3). Degree of motion (i.e., “none” or “mild”) did not predict CT in our sample (t (1,73) = −0.39, P = 0.70).
Figure 2.
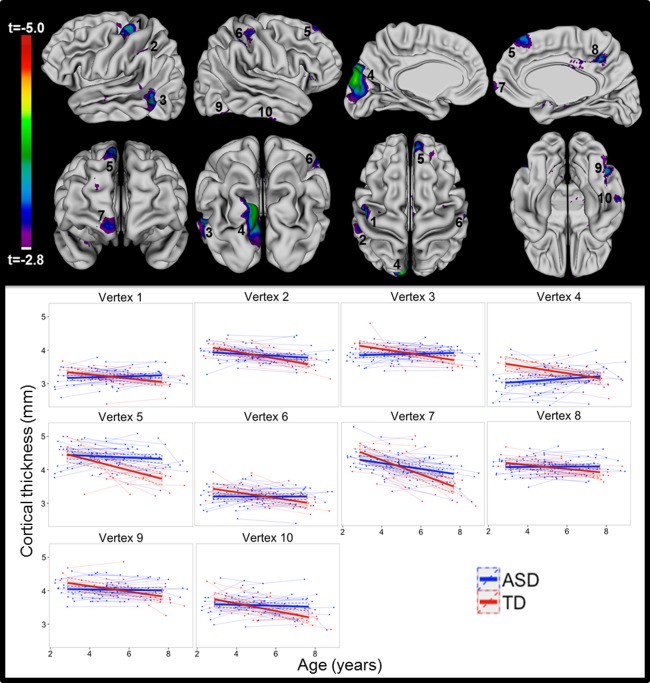
Interaction of group and age. Highlighted regions represent areas where patterns of change in cortical thickness with age varied between autism spectrum disorder (ASD) and typically developing controls (TDC). Scatterplots for cortical thickness at the center of each numbered region are shown with separate lines for ASD and TDC.
These group differences in CT change occurred in the context of a widespread pattern of significant age‐related CT decrease that was detected in both groups across large swaths of frontal, temporal, parietal, and occipital cortex (see Supporting Information Fig. 1). Notably, there were no areas of significant CT increase with age in TDC.
In addition to the aforementioned group differences in CT change, we also identified foci of developmentally static CT excess in ASD relative to controls in vertices located in the left superior temporal gyrus, inferior occipital gyrus, and a broad region over the superior frontal gyrus as well as within the right superior parietal lobule and a broad region overlapping the superior frontal gyrus and middle frontal gyrus (see Supporting Information Fig. 2). Developmentally static CT deficits in ASD relative to controls were found in vertices within the left superior occipital gyrus, orbitofrontal gyrus, parahippocampal gyrus, and right orbitofrontal gyrus.
Next, we evaluated whether changes in cortical thickness within particular regions were associated with changes in communication and core autism symptoms in ASD. Within the ASD group, we identified four right hemisphere groups of vertices where the slope for expressive communication was associated with CT change with age. These were within the pre/postcentral gyrus (β = 0.01, SE = 0.002, t (40) = 4.8, p < 0.001), superior temporal gyrus (β = 0.006, SE = 0.002, t (40) = 3.7, p < 0.001), inferior frontal gyrus (β = 0.008, SE = 0.002, t (40) = 4.9, p < 0.001), and lingual gyrus (β = 0.007, SE = 0.002, (t (40) = 3.3, p < 0.0001, see Fig. 3.) Within these groups of vertices, greater rates of expressive communication gain in ASD were associated with increasing CT over time. These vertices continued to be significant after accounting for sex, TTV, and nonverbal DQ within the model, when modeled in males only, and excluding CT values over 2 SDs from the mean, for a total of six sensitivity models (see Supporting Information Table IV). Rate of change in expressive communication did not significantly relate to rates of CT change within the left hemisphere. There were no brain regions where changes in CT were associated with changes in VABS Receptive Communication, ADOS SOC severity scores, or ADOS RRB severity scores.
Figure 3.
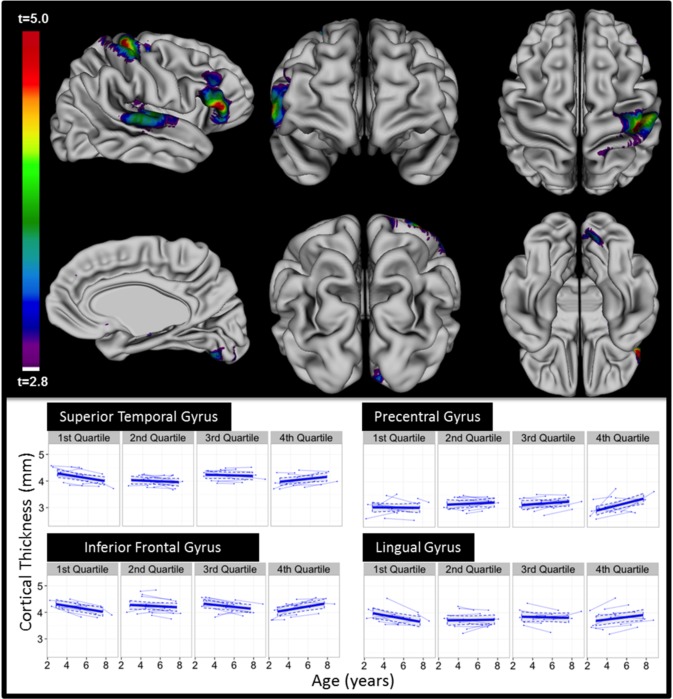
Regions within ASD only where changes in CT were associated with changes in expressive language age equivalents as measured with VABS. (A) The regions highlighted represent regions where increases in CT with age were associated with increases in expressive language age‐equivalents with age. (B) Scatterplots of CT by age for 1st, 2nd, 3rd, and 4th quartiles for slope of expressive language scores within ASD. Although expressive language was measured continuously, mapping CT change with age within these categories allows for visualization of the significant interactions.
DISCUSSION
Summary of Main Findings
Linear models with two time points of data for global measures indicated similar volumes and patterns of change over time in children with ASD and controls for TTV, WMV, CSF, and SA. GMV and CV showed different patterns of change over time by group, with greater increases in GMV and CV with time in the ASD group. In addition, the cerebral cortex of children with ASD showed less CT decrease with time compared with controls, particularly in vertices located in the left medial temporal gyrus, supramarginal gyrus, precentral gyrus, and cuneus and right postcentral gyrus, inferior temporal gyrus, superior frontal gyrus, precuneus, and fusiform gyrus. Relative to the decreases over time observed in the TDC group, CT in these groups of vertices decreased less, remained stable, or increased in children with ASD. Within the ASD group, greater expressive communication gains over time were associated with CT increase over time in vertices located in the right pre and postcentral gyrus, inferior frontal gyrus, superior temporal gyrus, and lingual gyrus.
Global Measures
We did not find statistically significant differences between children with ASD and TDC in rates of TBV, WM, or CSF change with development. This replicates the only other longitudinal study of brain anatomy in preschool aged children with ASD by Hazlett et al. [2011], which investigated linear changes in cortical anatomy in children with ASD and a heterogeneous control group at ages 2 and 4 to 5 years. Lack of difference between groups at this age fits with the triphasic model of brain development in ASD (i.e., that any early‐emerging atypicalities in brain growth are stabilizing within this age range, Lange et al. [2015] and Zielinski et al. [2014]). We did, however, find evidence for altered GMV change with age in ASD such that total GMV, and its major subcomponent CV, increased more with age in ASD versus TDC. Moreover, within our sample, global CV dysmaturation in ASD was driven by aberrant global CT change with age (i.e., decreased age‐related CT reduction) with no significant group differences in rates of total SA change with age. These findings contrast with those of Hazlett et al., who reported a developmentally stable CV excess in ASD, driven by larger total cortical SA rather than any alterations in CT. Methodological differences between studies that could potentially account for these conflicting findings include our use of a homogenous control group (the control group in Hazlett et al. comprised children with both typical and delayed development), and use of different methods for measuring cortical anatomy (i.e., no explicit surface‐based modeling of the cortical sheet or direct SA measurement in Hazlett et al.).
Of the nine studies in ASD that have used surface based methods to separately measure CT and SA, seven have found alterations of CT in ASD [Ecker et al., 2013, 2014; Libero et al., 2014; Mak‐Fan et al., 2012; Raznahan et al., 2013, 2010; Wallace et al., 2015] while five have shown differences in SA [Ecker et al., 2014; Hazlett et al., 2011; Libero et al., 2014; Mak‐Fan et al., 2012; Ohta et al., 2015]. Given extensive evidence that CT and SA are shaped by distinct genetic and environmental influences [Panizzon et al., 2009; Raznahan et al., 2012], emergence of more consistent differences in CT versus SA in ASD via replication would assist in translational efforts to identify molecular and cellular pathways underpinning aberrant cortical development in ASD.
Vertex‐Level CT Findings in ASD Compared With TDC
As cortical changes in ASD may not conform to the traditional anatomical parcellations defined by gyral features, we used vertex‐based analyses (versus a priori regions of interest from automated cortical parcellation) to characterize the spatial distribution of CT changes within our sample. Our vertex‐level analyses of CT change in children with ASD and TDC yielded several findings of note. First, amongst our (albeit small) sample of TDCs, we identified vertices of significant CT decrease with age (see Supporting Information Fig. 1), which were most prominent in bilateral frontotemporal cortices. These findings represent the first vertex‐level map of typical CT development within this age‐range. Prior studies of CT development in typically developing children report a robust pattern of increasing CT over the first 2 years of life [Li et al., 2015; Lyall et al., 2014], and decreases in CT throughout much of the cortex during adolescence and into adulthood [Brown and Jernigan, 2012; Raznahan et al., 2011; Shaw et al., 2008; Tamnes et al., 2010; Thambisetty et al., 2010; Ziegler et al., 2010]. Data on CT change between 2 years of age and late childhood are sparse and less consistent, with evidence for both dominant patterns of CT reduction [Brown et al., 2012; Sowell et al., 2004] and CT increases [Raznahan et al., 2011; Shaw et al., 2008]. Further studies in this critical age‐range will be required to reconcile these conflicting findings.
Second, our vertex‐wise analyses produced evidence for differences between children with ASD and TDCs in rates of CT change over time. These differences generally involved an attenuation of typical age‐related CT loss in ASD. This pattern of altered CT development in ASD differs from those of the four other longitudinal studies of regional CT change in ASD, each of which focused on a different age range [Hardan et al., 2009; Hazlett et al., 2011; Wallace et al., 2015; Zielinski et al., 2014]. Specifically, the prior reports found either no difference in CT change over time in toddlers and preschoolers with ASD [Hazlett et al., 2011] or greater age‐related CT decreases over time in ASD relative to controls in school age children and in a broad sample of children and adults [Hardan et al., 2009; Wallace et al., 2015; Zielinski et al., 2014]. The difference between our results and these earlier reports could stem from (i) the methods used to measure CT, (ii) group characteristics, such as degree of intellectual disability, or (iii) varying patterns of cortical dysmaturation in ASD across different age‐ranges (e.g., Supporting Information Fig. 3). Specifically, the triphasic developmental pattern seen across imaging studies in autism [e.g., Lange et al., 2015] posits that after the early increase in brain volume in the first 2 years in ASD, brain volume would at some point begin to decrease, eventually decreasing at a greater rate than in typical development. Therefore, whereas the first 2 years of life are characterized by brain overgrowth in autism, it is plausible that the present study captures the next developmental phase in ASD, when brain volume (and CT) have begun to decrease but are not changing at the same rate as in TD.
Third, our study adds to the converging evidence for CT alterations in ASD within a set of brain regions involved in language, social cognition and behavioral control. Collapsing across different classes of CT abnormality in ASD relative to controls (i.e., altered rates of change, static increases or static decreases), multiple independent studies localize CT alterations in ASD to rostral prefrontal cortices, the superior temporal sulcus and gyrus (STS/STG) and neighboring lateral temporal structures, inferior parietal lobule, and fusiform gyrus [e.g., Ecker et al., 2013; Hadjikhani et al., 2006; Jiao et al., 2010; Libero et al., 2014; Raznahan et al., 2013; Scheel et al., 2011; Zielinski et al., 2014]. Alterations of CT within the STS/STG have therefore been associated with ASD diagnosis and with degree of normative ASD traits in controls [Blanken et al., 2015; Wallace et al., 2012], highlighting the link between the STS/STG and social‐communication development.
Finally, we identified foci where significant CT differences are found between ASD and TDC at mean age. These results echoed our earlier cross‐sectional neuroimaging data within this cohort [Raznahan et al., 2013]. Specifically, the present study showed increased CT in ASD in vertices located within the bilateral superior frontal gyrus, left superior temporal gyrus, left lateral occipital gyrus, right middle frontal gyrus, and right intraparietal sulcus. In addition, the present study revealed regions of increased CT in TDC compared with ASD (see Supporting Information Fig. 2). Please see this prior publication [Raznahan et al., 2013] for a detailed systematic review of existing cross‐sectional studies of specific brain anatomy differences in young children with ASD.
Vertex‐Level Relationships Between Language and CT Development in ASD
In this study, we found an association between rates of expressive communication gains in ASD and rates of CT increase in vertices within a set of right hemisphere regions previously linked to development of language and communication. Specifically, we identified vertices within the right somatomotor and somatosensory cortices where CT change with time was positively correlated with changes in expressive communication. These regions are primarily related to sensation and movement of the hand, but are also associated with gesture development and embodiment of language in typical development [Flöel et al., 2003; Hauk et al., 2004; Meister et al., 2003]. In addition, the pars triangularis of the inferior frontal gyrus is associated with gesture comprehension [Pazzaglia et al., 2008]. Two of the regions (IFG and somato‐motor cortex) have also been identified as components of a CT covariance network that correlates with differences in expressive language in typically developing youth [Lee et al., 2014]. Links between language and CT development in ASD were also found in the STG at the primary auditory cortex [Lange et al., 2015].
The vertices within right IFG, STG, SSC/SMC, and LG where CT change and language development are correlated in ASD are nonoverlapping with those showing significant differences in CT change between ASD and TDC. This observation suggests that the positive correlation between CT increase and expressive communication gains in ASD at these vertices could potentially represent compensatory processes in ASD. For example, this lateralized relationship could potentially represent compensatory development in the right cortex in association with atypical left‐hemisphere language specialization. In keeping with this hypothesis, several prior reports have found evidence for atypical lateralization in ASD [Cardinale et al., 2013; Eyler et al., 2012; Flagg et al., 2005; Floris et al., 2015; Herbert et al., 2002; Knaus et al., 2010; Lange et al., 2015], as well as evidence that atypical lateralization of language is specifically associated with language outcomes[De Fosse et al., 2004; Floris et al., 2015; Redcay and Courchesne, 2008]. That specialization of the right hemisphere for language could be compensatory rather than a primary neurological feature in ASD also fits with theories regarding right hemisphere compensation for early left hemisphere dysmaturation [Flagg et al., 2005].
Limitations and Future Directions
While the present study is the first to compare change over time in vertex‐based neuroanatomical measures amongst young children with ASD versus typically developing controls, some limitations should be noted. First, while the groups did not vary on age or time between scans, which is important given rapid developmental change in this age group, the groups were not equally sized, or matched on DQ or sex. For this reason, statistical robustness of all group differences and the relation between language and CT in the ASD group were confirmed after accounting for TTV, nonverbal DQ, and sex within the model, in the sample of males only, and both including and excluding CT slopes more than two SDs from the mean, for a total of six sensitivity models per finding. However, further work in larger samples is needed to better understand the role of these factors in brain dysmaturation in ASD. Therefore, important methodological priorities in follow‐up work will include targeted recruitment of females with ASD, and control groups with idiopathic developmental delay/ID. In addition, ASD status was confounded with use of sedation in this study. Although we took great care to exclude any scans with significant motion artifact and found no difference in CT by degree of movement artifact (i.e., “none” vs. “mild”), it is theoretically possible that more subtle group differences in motion arising from group differences in sedation could have led to nonrandom biases in CT estimation between children with ASD and controls. In addition, the present study focuses on linear models due to sample size and having only two time points of data for each participant. While CT change is most likely linear after age 2 years [Brown et al., 2012], gathering three or more data points per subject in a larger longitudinal design would allow for testing of more complex models including those with nonlinear trends. Also, the sample size of the TDC group (30 scans, 15 participants) could lead to spurious differences between groups that would be driven by a small number of individual controls. While all distributions were subjected to outlier analyses and results were confirmed within a very stringently defined subset of data, the small size of this group necessitates replication of the present findings with a larger sample. Finally, the in vivo imaging methods employed in our study provide no information about the cellular and molecular underpinnings of detected CT alterations in ASD. Dominant theories for cellular underpinnings of cortical thinning in typical development include both dendritic pruning and myelination [Giedd et al., 2010; Kochunov et al., 2011], but data that can directly test these theories is lacking. Furthermore, mechanisms of developmental and disease‐related CT variation need not overlap.
Notwithstanding these limitations, our study provides evidence of CT dysmaturation over time in ASD during early childhood, localized to vertices within several cortical regions reported in previous studies to show structural and functional alterations in older ASD cohorts. This finding attests to the early roots of altered brain development in ASD, and motivates longitudinal, vertex‐based studies of even earlier brain development in typical development and ASD within prospective high‐risk study designs [e.g., Wolff et al., 2012]. We also provide data on the relation between early changes in CT and language within ASD, with findings suggesting CT gains in language regions as a marker of compensatory processes supporting development of expressive communication within ASD. Exploration of this hypothesis using multimodal imaging data and finer‐grained behavioral assessment may identify opportunities for targeted intervention to optimize earlier developmental trajectories in ASD. A critical component of this effort will be testing whether findings in idiopathic ASD cohorts like the current sample generalize to the growing number of genetically‐defined ASD subgroups [Geschwind and State, 2015].
CONCLUSIONS
Study findings suggest that differences in cortical thickness between children with ASD and TDC change with age. This provides an important framework when considering cross‐sectional differences between ASD and controls, and suggests that differences over time rather than static differences may serve as a more consistent neuroanatomical marker in ASD. These findings also suggest that within ASD, changes in brain anatomy are related to changes in expressive communication over time. Whether this relationship reflects compensatory processes or delayed maturation of brain regions related to skill development will be an essential next step for the field.
Supporting information
Supporting Information
ACKNOWLEDGMENTS
Authors thank the members of the Pediatrics and Developmental Neuroscience and Child Psychiatry research teams, and express our gratitude to the families that participated in this research. Selected results were presented at the Society for Neuroscience meeting November 2014. The views expressed in this article do not necessarily represent the views of the NIMH, NIH, HHS, or the United States Government.
REFERENCES
- Aiken LR (1996): Assessment of Intellectual Functioning, 2nd ed New York: Springer. [Google Scholar]
- American Psychiatric Association (2013): Diagnostic and Statistical Manual of Mental Disorders, 5th ed. Arlington, VA: American Psychiatric Publishing. [Google Scholar]
- Balardin JB, Sato JR, Vieira G, Feng Y, Daly E, Murphy C, Ecker C (2015): Relationship between surface‐based brain morphometric measures and intelligence in autism spectrum disorders: Influence of history of language delay. Autism Res 8:556–566. [DOI] [PubMed] [Google Scholar]
- Blanken LM, Mous SE, Ghassabian A, Muetzel RL, Schoemaker NK, El Marroun H, White T (2015): Cortical morphology in 6‐ to 10‐year old children with autistic traits: A population‐based neuroimaging study. Am J Psychiatry 172:479–486. [DOI] [PubMed] [Google Scholar]
- Blumenthal JD, Zijdenbos A, Molloy E, Giedd JN (2002): Motion artifact in magnetic resonance imaging: Implications for automated analysis. Neuroimage 16:89–92. [DOI] [PubMed] [Google Scholar]
- Brouwer RM, van Soelen ILC, Swagerman SC, Schnack HG, Ehli EA, Kahn RS, Boomsma DI (2014): Genetic associations between intelligence and cortical thickness emerge at the start of puberty. Hum Brain Mapp 35:3760–3773. [DOI] [PMC free article] [PubMed] [Google Scholar]
- Brown TT, Jernigan TL (2012): Brain development during the preschool years. Neuropsychol Rev 22:313–333. [DOI] [PMC free article] [PubMed] [Google Scholar]
- Brown KJM, Chung Y, Erhart M, McCabe C, Hagler DJ Jr, Dale AM (2012): Neuroanatomical assessment of biological maturity. Curr Biol 22:1693–1698. [DOI] [PMC free article] [PubMed] [Google Scholar]
- Cardinale RC, Shih P, Fishman I, Ford LM, Muller RA (2013): Pervasive rightward asymmetry shifts of functional networks in autism spectrum disorder. JAMA Psychiatry 70:975–982. [DOI] [PMC free article] [PubMed] [Google Scholar]
- Chen R, Jiao Y, Herskovits EH (2011): Structural MRI in autism spectrum disorder. Pediatr Res 69:63R–68R. [DOI] [PMC free article] [PubMed] [Google Scholar]
- Chung MK, Robbins SM, Dalton KM, Davidson RJ, Alexander AL, Evans AC (2005): Cortical thickness analysis in autism with heat kernel smoothing. Neuroimage 25:1256–1265. [DOI] [PubMed] [Google Scholar]
- Courchesne E, Campbell K, Solso S (2011): Brain growth across the life span in autism: Age‐specific changes in anatomical pathology. Brain Res 1380:138–145. [DOI] [PMC free article] [PubMed] [Google Scholar]
- De Fosse L, Hodge SM, Makris N, Kennedy DN, Caviness VS, Jr. , McGrath L, Harris GJ (2004): Language‐association cortex asymmetry in autism and specific language impairment. Ann Neurol 56:757–766. [DOI] [PubMed] [Google Scholar]
- Doyle‐Thomas KAR, Duerden EG, Taylor MJ, Lerch JP, Soorya LV, Wang AT, Anagnostou E (2013): Effects of age and symptomatology on cortical thickness in autism spectrum disorders. Res Autism Spectrum Disord 7:141–150. [DOI] [PMC free article] [PubMed] [Google Scholar]
- Ecker G,C, Feng Y, Johnston P, Lombardo MV, Lai MC, Murphy DGM (2013): Brain surface anatomy in adults with autism: The relationship between surface area, cortical thickness, and autistic symptoms. JAMA Psychiatry 70:59–70. [DOI] [PubMed] [Google Scholar]
- Ecker M,A, Mourao‐Miranda J, Johnston P, Daly EM, Brammer MJ, Murphy DG (2010): Describing the brain in autism in five dimensions–magnetic resonance imaging‐assisted diagnosis of autism spectrum disorder using a multiparameter classification approach. J Neurosci 30:10612–10623. [DOI] [PMC free article] [PubMed] [Google Scholar]
- Ecker SA, Feng Y, Daly E, Murphy C, D'Almeida V, Murphy DG (2014): The effect of age, diagnosis, and their interaction on vertex‐based measures of cortical thickness and surface area in autism spectrum disorder. J Neural Transmission 121:1157–1170. [DOI] [PubMed] [Google Scholar]
- Elliott CD (2007): Differential Ability Scales, 2nd ed San Antonio, TX: Harcourt Assessment. [Google Scholar]
- Eyler LT, Pierce K, Courchesne E (2012): A failure of left temporal cortex to specialize for language is an early emerging and fundamental property of autism. Brain 135:949–960. [DOI] [PMC free article] [PubMed] [Google Scholar]
- Flagg EJ, Cardy JE, Roberts W, Roberts TP (2005): Language lateralization development in children with autism: Insights from the late field magnetoencephalogram. Neuroscience Letters 386:82–87. [DOI] [PubMed] [Google Scholar]
- Flöel A, Ellger T, Breitenstein C, Knecht S (2003): Language perception activates the hand motor cortex: Implications for motor theories of speech perception. Eur J Neurosci 18:704–708. [DOI] [PubMed] [Google Scholar]
- Floris DL, Lai MC, Auer T, Lombardo MV, Ecker C, Chakrabarti B, Suckling J (2015): Atypically rightward cerebral asymmetry in male adults with autism stratifies individuals with and without language delay. Hum Brain Mapp 37:230–253. [DOI] [PMC free article] [PubMed] [Google Scholar]
- Genovese CR, Lazar NA, Nichols T (2002): Thresholding of statistical maps in functional neuroimaging using the false discovery rate. Neuroimage 15:870–878. [DOI] [PubMed] [Google Scholar]
- Geschwind DH, State MW (2015): Gene hunting in autism spectrum disorder: On the path to precision medicine. Lancet Neurol 14:1109–1120. [DOI] [PMC free article] [PubMed] [Google Scholar]
- Giedd JN, Stockman M, Weddle C, Liverpool M, Alexander‐Bloch A, Wallace GL, Lenroot RK (2010): Anatomic magnetic resonance imaging of the developing child and adolescent brain and effects of genetic variation. Neuropsychol Rev 20:349–361. [DOI] [PMC free article] [PubMed] [Google Scholar]
- Gotham K, Pickles A, Lord C (2009): Standardizing ADOS Scores for a Measure of Severity in Autism Spectrum Disorders. J Autism Dev Disord 39:693–705. [DOI] [PMC free article] [PubMed] [Google Scholar]
- Hadjikhani N, Joseph RM, Snyder J, Tager‐Flusberg H (2006): Anatomical differences in the mirror neuron system and social cognition network in autism. Cereb Cortex 16:1276–1282. [DOI] [PubMed] [Google Scholar]
- Hallmayer JC, Torres S, Phillips A, Cohen J, Torigoe B, Risch TN (2011): Genetic heritability and shared environmental factors among twin pairs with autism. Arch Gen Psychiatry 68:1095. [DOI] [PMC free article] [PubMed] [Google Scholar]
- Hardan AY, Libove RA, Keshavan MS, Melhem NM, Minshew NJ (2009): A preliminary longitudinal magnetic resonance imaging study of brain volume and cortical thickness is autism. Biol Psychiatry 66:320–326. [DOI] [PMC free article] [PubMed] [Google Scholar]
- Hardan AY, Muddasani S, Vemulapalli M, Keshavan MS, Minshew NJ (2006): An MRI study of increased cortical thickness in autism. Am J Psychiatry 163:1290–1292. [DOI] [PMC free article] [PubMed] [Google Scholar]
- Hauk O, Johnsrude I, Pulvermuller F (2004): Somatotopic representation of action words in human motor and premotor cortex. Neuron 41:301–307. [DOI] [PubMed] [Google Scholar]
- Hazlett HC, Poe MD, Gerig G, Styner M, Chappell C, Smith RG, Piven J (2011): Early brain overgrowth in autism associated with an increase in cortical surface area before age 2 years. Arch Gen Psychiatry 68:467–476. [DOI] [PMC free article] [PubMed] [Google Scholar]
- Herbert MR, Harris GJ, Adrien KT, Ziegler DA, Makris N, Kennedy DN, Caviness VS (2002): Abnormal asymmetry in language association cortex in autism. Ann Neurol 52:588–596. [DOI] [PubMed] [Google Scholar]
- Hyde KL, Samson F, Evans AC, Mottron L (2010): Neuroanatomical differences in brain areas implicated in perceptual and other core features of autism revealed by cortical thickness analysis and voxel‐based morphometry. Hum Brain Mapp 31:556–566. [DOI] [PMC free article] [PubMed] [Google Scholar]
- Jiao Y, Chen R, Ke X, Chu K, Lu Z, Herskovits EH (2010): Predictive models of autism spectrum disorder based on brain regional cortical thickness. Neuroimage 50:589–599. [DOI] [PMC free article] [PubMed] [Google Scholar]
- Knaus TA, Silver AM, Kennedy M, Lindgren KA, Dominick KC, Siegel J, Tager‐Flusberg H (2010): Language laterality in autism spectrum disorder and typical controls: A functional, volumetric, and diffusion tensor MRI study. Brain Lang 112:113–120. [DOI] [PMC free article] [PubMed] [Google Scholar]
- Kochunov P, Glahn DC, Lancaster J, Thompson PM, Kochunov V, Rogers B, Williamson DE (2011): Fractional anisotropy of cerebral white matter and thickness of cortical gray matter across the lifespan. Neuroimage 58:41–49. [DOI] [PMC free article] [PubMed] [Google Scholar]
- Lancaster JL, Summerin JL, Rainey L, Freitas CS, Fox PT (1997): The Talairach Daemon, a database server for Talairach Atlas Labels. Neuroimage 5:633. [Google Scholar]
- Lange N, Travers BG, Bigler ED, Prigge MB, Froehlich AL, Nielsen JA, Lainhart JE (2015): Longitudinal volumetric brain changes in autism spectrum disorder ages 6‐35 years. Autism Res 8:82–93. [DOI] [PMC free article] [PubMed] [Google Scholar]
- Lee NR, Raznahan A, Wallace GL, Alexander‐Bloch A, Clasen LS, Lerch JP, Giedd JN (2014): Anatomical coupling among distributed cortical regions in youth varies as a function of individual differences in vocabulary abilities. Hum Brain Mapp 35:1885–1895. [DOI] [PMC free article] [PubMed] [Google Scholar]
- Lerch J (2009): Brain‐View‐2. Retrieved from https://github.com/Mouse-Imaging-Centre/brain-view2.
- Li Lin W, Gilmore JH Shen D (2015): Spatial patterns, longitudinal development, and hemispheric asymmetries of cortical thickness in infants from birth to 2 years of age. J Neurosci 35:9150–9162. [DOI] [PMC free article] [PubMed] [Google Scholar]
- Libero LE, DeRamus TP, Deshpande HD, Kana RK (2014): Surface‐based morphometry of the cortical architecture of autism spectrum disorders: Volume, thickness, area, and gyrification. Neuropsychologia 62:1–10. [DOI] [PubMed] [Google Scholar]
- Lord C, Rutter M, Di Lavore PC, Risi S (2000): Autism Diagnostic Observation Schedule (ADOS). Los Angeles: Western Psychological Services. [Google Scholar]
- Lyall AE, Shi F, Geng X, Woolson S, Li G, Wang L, Gilmore JH (2014): Dynamic development of regional cortical thickness and surface area in early childhood. Cereb Cortex 25:2204–2212. [DOI] [PMC free article] [PubMed] [Google Scholar]
- Lyttelton O, Boucher M, Robbins S, Evans A (2007): An unbiased iterative group registration template for cortical surface analysis. Neuroimage 34:1535–1544. [DOI] [PubMed] [Google Scholar]
- MacDonald D, Kabani N, Avis D, Evans AC (2000): Automated 3‐D extraction of inner and outer surfaces of cerebral cortex from MRI. Neuroimage 12:340–356. [DOI] [PubMed] [Google Scholar]
- Magiati I, Tay XW, Howlin P (2014): Cognitive, language, social and behavioural outcomes in adults with autism spectrum disorders: A systematic review of longitudinal follow‐up studies in adulthood. Clin Psychol Rev 34:73–86. [DOI] [PubMed] [Google Scholar]
- Mak‐Fan KM, Taylor MJ, Roberts W, Lerch JP (2012): Measures of cortical grey matter structure and development in children with autism spectrum disorder. J Autism Dev Disord 42:419–427. [DOI] [PubMed] [Google Scholar]
- Meister IG, Boroojerdi B, Foltys H, Sparing R, Huber W, Topper R (2003): Motor cortex hand area and speech: Implications for the development of language. Neuropsychologia 41:401–406. [DOI] [PubMed] [Google Scholar]
- Misaki M, Wallace GL, Dankner N, Martin A, Bandettini PA (2012): Characteristic cortical thickness patterns in adolescents with autism spectrum disorders: Interactions with age and intellectual ability revealed by canonical correlation analysis. Neuroimage 60:1890–1901. [DOI] [PMC free article] [PubMed] [Google Scholar]
- Mullen EM (1995): Mullen Scales of Early Learning. Circle Pines, MN: American Guidance Service. [Google Scholar]
- Ohta H, Nordahl CW, Iosif AM, Lee A, Rogers S, Amaral DG (2015): Increased surface area, but not cortical thickness, in a subset of young boys with autism spectrum disorder. Autism Res 9:232–248. [DOI] [PMC free article] [PubMed] [Google Scholar]
- Panizzon MS, Fennema‐Notestine C, Eyler LT, Jernigan TL, Prom‐Wormley E, Neale M, Kremen WS (2009): Distinct genetic influences on cortical surface area and cortical thickness. Cereb Cortex 19:2728–2735. [DOI] [PMC free article] [PubMed] [Google Scholar]
- Pazzaglia M, Smania N, Corato E, Aglioti SM (2008): Neural underpinnings of gesture discrimination in patients with limb apraxia. J Neurosci 28:3030–3041. [DOI] [PMC free article] [PubMed] [Google Scholar]
- Philip RCM, Dauvermann MR, Whalley HC, Baynham K, Lawrie SM, Stanfield AC (2012): A systematic review and meta‐analysis of the fMRI investigation of autism spectrum disorders. Neurosci Biobehav Rev 36:901–942. [DOI] [PubMed] [Google Scholar]
- Porter JN, Collins PF, Muetzel RL, Lim KO, Luciana M (2011): Associations between cortical thickness and verbal fluency in childhood, adolescence, and young adulthood. Neuroimage 55:1865–1877. [DOI] [PMC free article] [PubMed] [Google Scholar]
- Raznahan Lenroot R, Thurm A, Gozzi M, Hanley A, Spence SJ … Giedd JN (2013): Mapping cortical anatomy in preschool aged children with autism using surface‐based morphometry. Neuroimage 2:111–119. [DOI] [PMC free article] [PubMed] [Google Scholar]
- Raznahan Shaw P, Lalonde F, Stockman M, Wallace GL, Greenstein D, Giedd JN (2011): How does your cortex grow? J Neurosci 31:7174–7177. [DOI] [PMC free article] [PubMed] [Google Scholar]
- Raznahan Toro R, Daly E, Robertson D, Murphy C, Deeley Q, Murphy DGM (2010): Cortical anatomy in autism spectrum disorder: An in vivo MRI study on the effect of age. Cereb Cortex 20:1332–1340. [DOI] [PubMed] [Google Scholar]
- Raznahan A, Greenstein D, Lee NR, Clasen LS, Giedd JN (2012): Prenatal growth in humans and postnatal brain maturation into late adolescence. Proc Natl Acad Sci USA 109:11366–11371. [DOI] [PMC free article] [PubMed] [Google Scholar]
- Redcay E, Courchesne E (2008): Deviant functional magnetic resonance imaging patterns of brain activity to speech in 2‐3‐year‐old children with autism spectrum disorder. Biol Psychiatry 64:589–598. [DOI] [PMC free article] [PubMed] [Google Scholar]
- Reuter M, Tisdall MD, Qureshi A, Buckner RL, van der Kouwe AJ, Fischl B (2015): Head motion during MRI acquisition reduces gray matter volume and thickness estimates. Neuroimage 107:107–115. [DOI] [PMC free article] [PubMed] [Google Scholar]
- Richter J, Henze R, Vomstein K, Stieltjes B, Parzer P, Haffner J, Poustka L (2015): Reduced cortical thickness and its association with social reactivity in children with autism spectrum disorder. Psychiatry Res 234:15–24. [DOI] [PubMed] [Google Scholar]
- Risi S, Lord C, Gotham K, Corsello C, Chrysler C, Szatmari P, Cook E, Leventhal B, Pickles A (2006): Combining information from multiple sources in the diagnosis of autism spectrum disorders. J Am Acad Child Adolesc Psychiatry 45:1094–1103. [DOI] [PubMed] [Google Scholar]
- Rojas DC, Peterson E, Winterrowd E, Reite ML, Rogers SJ, Tregellas JR (2006): Regional gray matter volumetric changes in autism associated with social and repetitive behavior symptoms. BMC Psychiatry 6:56. [DOI] [PMC free article] [PubMed] [Google Scholar]
- Rutter M, Bailey AJ, Lord C (2004): Social Communication Questionnaire. Los Angeles, CA: Western Psychological Services. [Google Scholar]
- Rutter M, LeCouteur A, Lord C (2003): Autism diagnostic Interview‐Revised (ADI‐R). Los Angeles: Western Psychological Services. [Google Scholar]
- Scheel C, Rotarska‐Jagiela A, Schilbach L, Lehnhardt FG, Krug B, Vogeley K, Tepest R (2011): Imaging derived cortical thickness reduction in high‐functioning autism: Key regions and temporal slope. Neuroimage 58:391–400. [DOI] [PubMed] [Google Scholar]
- Shaw P, Kabani NJ, Lerch JP, Eckstrand K, Lenroot R, Gogtay N, Wise SP (2008): Neurodevelopmental trajectories of the human cerebral cortex. J Neurosci 28:3586–3594. [DOI] [PMC free article] [PubMed] [Google Scholar]
- Sowell Peterson BS, Kan E, Woods RP, Yoshii J, Bansal R, Toga AW (2007): Sex differences in cortical thickness mapped in 176 healthy individuals between 7 and 87 years of age. Cereb Cortex 17:1550–1560. [DOI] [PMC free article] [PubMed] [Google Scholar]
- Sowell Thompson PM, Leonard CM, Welcome SE, Kan E Toga AW (2004): Longitudinal mapping of cortical thickness and brain growth in normal children. J Neurosci 24:8223–8231. [DOI] [PMC free article] [PubMed] [Google Scholar]
- Sparrow S, Cicchetti D, Balla D. (2005). Vineland Adaptive Behavior Scales, Survey Interview Form/Caregiver Rating Form, 2nd ed Livonia, MN: Pearson Assessments. [Google Scholar]
- Stigler KA, McDonald BC, Anand A, Saykin AJ, McDougle CJ (2011): Structural and functional magnetic resonance imaging of autism spectrum disorders. Brain Res 1380:146–161. [DOI] [PMC free article] [PubMed] [Google Scholar]
- Tamnes CK, Østby Y, Fjell AM, Westlye LT, Due‐Tonnesse P, Walhovd KB (2010): Brain maturation in adolescence and young adulthood: Regional age‐related changes in cortical thickness and white matter volume and microstructure. Cereb Cortex 20:534–548. [DOI] [PubMed] [Google Scholar]
- R Core Team (2014): R: A language and environment for statistical computing. Vienna, Austria: R Foundation for Statistical Computing. Retrieved from: http://www.R-project.org/
- Thambisetty M, Wan J, Carass A, An Y, Prince JL, Resnick SM (2010): Longitudinal changes in cortical thickness associated with normal aging. Neuroimage 52:1215–1223. [DOI] [PMC free article] [PubMed] [Google Scholar]
- Thurm A, Manwaring SS, Swineford L, Farmer C (2015): Longitudinal study of symptom severity and language in minimally verbal children with autism. Journal of Child Psychology and Psychiatry and Allied Disciplines 56:97–104. [DOI] [PMC free article] [PubMed] [Google Scholar]
- Wallace Dankner N, Kenworthy L, Giedd JN, Martin A (2010): Age‐related temporal and parietal cortical thinning in autism spectrum disorders. Brain 133:3745–3754. [DOI] [PMC free article] [PubMed] [Google Scholar]
- Wallace Eisenberg IW, Robustelli B, Dankner N, Kenworthy L, Giedd JN, Martin A (2015): Longitudinal cortical development during adolescence and young adulthood in autism spectrum disorder: Increased cortical thinning but comparable surface area changes. J Am Acad Child Adolesc Psychiatry 54:464–469. [DOI] [PMC free article] [PubMed] [Google Scholar]
- Wallace GL, Shaw P, Lee NR, Clasen LS, Raznahan A, Lenroot RK, Giedd JN (2012): Distinct cortical correlates of autistic versus antisocial traits in a longitudinal sample of typically developing youth. J Neurosci 32:4856–4860. [DOI] [PMC free article] [PubMed] [Google Scholar]
- Wechsler D (2004): The Wechsler Intelligence Scale for Children, 4th ed. London: Pearson Assessment. [Google Scholar]
- Willsey AJ, Sanders SJ, Li M, Dong S, Tebbenkamp AT, Muhle RA, State MW (2013): Coexpression networks implicate human midfetal deep cortical projection neurons in the pathogenesis of autism. Cell 155:997–1007. [DOI] [PMC free article] [PubMed] [Google Scholar]
- Wolff JJ, Gu H, Gerig G, Elison JT, Styner M, Gouttard S, Piven J (2012): Differences in white matter fiber tract development present from 6 to 24 months in infants with autism. Am J Psychiatry 169:589–600. [DOI] [PMC free article] [PubMed] [Google Scholar]
- Zhou DM, Lebel C, Evans A, Beaulieu C (2013): Cortical thickness asymmetry from childhood to older adulthood. Neuroimage 83:66–74. [DOI] [PubMed] [Google Scholar]
- Zhou Y, Yu F, Duong T (2014): Multiparametric MRI characterization and prediction in autism spectrum disorder using graph theory and machine learning. PLoS One 9:e90405. [DOI] [PMC free article] [PubMed] [Google Scholar]
- Ziegler DA, Piguet O, Salat DH, Prince K, Connally E, Corkin S (2010): Cognition in healthy aging is related to regional white matter integrity, but not cortical thickness. Neurobiol Aging 31:1912–1926. [DOI] [PMC free article] [PubMed] [Google Scholar]
- Zielinski BA, Prigge MB, Nielsen JA, Froehlich AL, Abildskov TJ, Anderson JS, Lainhart JE (2014): Longitudinal changes in cortical thickness in autism and typical development. Brain 137:1799–1812. [DOI] [PMC free article] [PubMed] [Google Scholar]
Associated Data
This section collects any data citations, data availability statements, or supplementary materials included in this article.
Supplementary Materials
Supporting Information