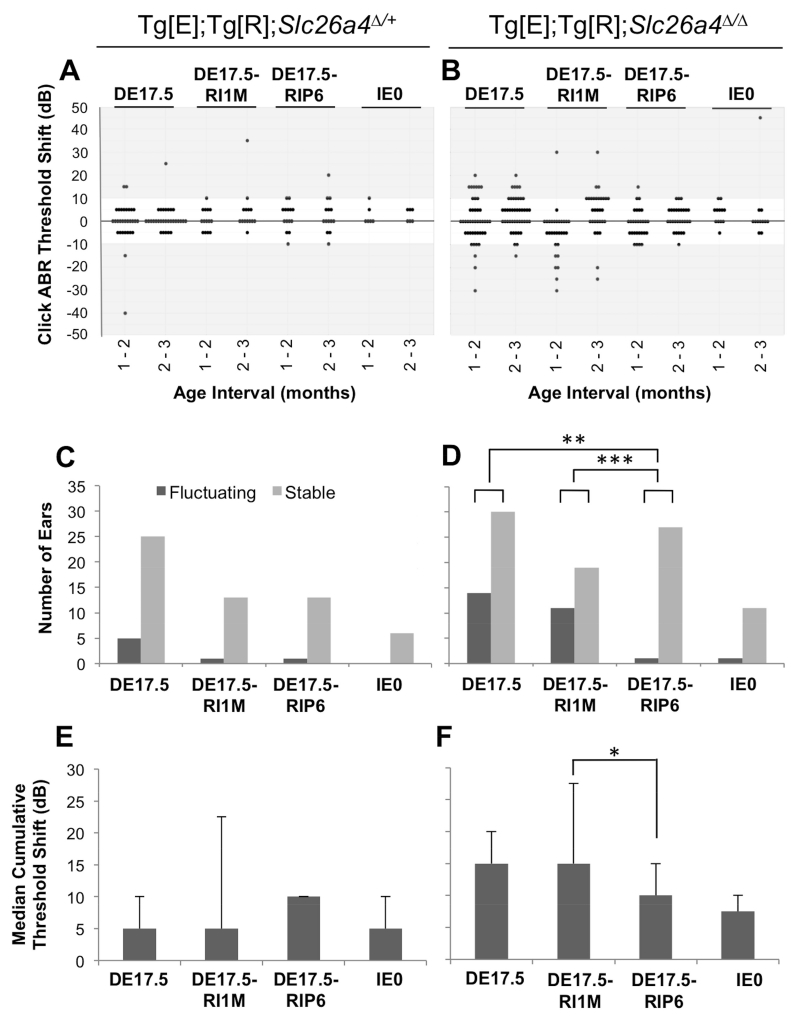
Figure 3.
Fluctuation of Hearing.
The difference in click ABR threshold measured at consecutive monthly intervals in individual ears is shown for the DE17.5, DE17.5-RI1M, DE17.5-RIP6 and IE0 groups of (A) Tg[E];Tg[R];Slc26a4Δ/+ ears (n = 30, 14, 14 and 6, respectively) and (B) Tg[E];Tg[R];Slc26a4Δ/Δ ears (n = 44, 30, 28 and 12, respectively). Threshold increases are shown as positive shifts and decreases are displayed as negative shifts. The number of fluctuating or stable ears is shown for each group of (C) Tg[E];Tg[R];Slc26a4Δ/+ ears and (D) Tg[E];Tg[R];Slc26a4Δ/Δ ears. Fluctuation was defined as a click ABR threshold difference > 10 dB between consecutive monthly measurements. The median (± median absolute deviation) cumulative sum of differences in consecutive monthly measurements of click ABR threshold for each individual ear are shown for each group of (E) Tg[E];Tg[R];Slc26a4Δ/+ ears and (F) Tg[E];Tg[R];Slc26a4Δ/Δ ears. Fisher’s exact test (C, D) and Kruskal-Wallis test (E, F), *p < 0.05, **p < 0.01, ***p < 0.005.

