

Abstract
Measurement of RNA can be used to study and monitor a range of infectious and non-communicable diseases, with profiling of multiple gene expression mRNA transcripts being increasingly applied to cancer stratification and prognosis. An international comparison study (Consultative Committee for Amount of Substance (CCQM)-P103.1) was performed in order to evaluate the comparability of measurements of RNA copy number ratio for multiple gene targets between two samples. Six exogenous synthetic targets comprising of External RNA Control Consortium (ERCC) standards were measured alongside transcripts for three endogenous gene targets present in the background of human cell line RNA. The study was carried out under the auspices of the Nucleic Acids (formerly Bioanalysis) Working Group of the CCQM. It was coordinated by LGC (United Kingdom) with the support of National Institute of Standards and Technology (USA) and results were submitted from thirteen National Metrology Institutes and Designated Institutes. The majority of laboratories performed RNA measurements using RT-qPCR, with datasets also being submitted by two laboratories based on reverse transcription digital polymerase chain reaction and one laboratory using a next-generation sequencing method. In RT-qPCR analysis, the RNA copy number ratios between the two samples were quantified using either a standard curve or a relative quantification approach. In general, good agreement was observed between the reported results of ERCC RNA copy number ratio measurements. Measurements of the RNA copy number ratios for endogenous genes between the two samples were also consistent between the majority of laboratories. Some differences in the reported values and confidence intervals (‘measurement uncertainties’) were noted which may be attributable to choice of measurement method or quantification approach. This highlights the need for standardised practices for the calculation of fold change ratios and uncertainties in the area of gene expression profiling.
Keywords: RNA copy number ratio, RT-qPCR, Gene expression, Normalisation, Standardisation, Molecular diagnostic, Transcriptomics, Cancer, Diagnostics, Biomarker identification and validation
1. Introduction
Gene expression profiling typically involves measuring the relative amounts of messenger RNA (mRNA) present in two or more samples or conditions. Such profiling is used to distinguish between disease states or show how cells in vitro react to particular treatments. RNA transcripts, therefore, offer considerable potential as diagnostic and prognostic biomarkers. However, RNA measurement is challenging and complicated by difficulties associated with the robustness and comparability of the techniques used to analyse these molecules and lack of commonly applied universal standards. The set of external RNA controls developed through the External RNA Controls Consortium (ERCC),1 an ad hoc group of 70 members from private, public and academic organizations led by the National Institute of Standards (NIST), was developed in order to meet the bioanalytical community's need for measurement assurance tools for reproducible gene expression measurements [1]. The panel of 96 different plasmid standards developed through the ERCC project consists of artificial sequences or sequences from bacterial and other genomes which lack homology to human sequences and from which RNA controls are produced by in vitro transcription [2]. These standards have been tested as prototype quality control tools for gene expression measurements and applied to the validation of new qPCR and sequencing approaches [3], [4], [5], [6].
Whilst measurement of a single gene transcript is applicable to the diagnosis of some diseases [7], there are increasing diagnostic opportunities when multiple gene transcripts are analysed. The transcriptome changes during disease and the changes can be measured as a surrogate biomarker to diagnose a given pathology. Measuring panels of biomarkers offers a more powerful and informative approach, but also considerably increases the measurement challenge, due to differing properties (e.g. specificity) in the detection chemistries for each biomarker and increased complexity in downstream data analysis. In some cases, accurate quantification of multiple individual transcripts is required, although more frequently it is the change in the overall pattern of expression (i.e. the gene expression signature) that is the diagnostic or prognostic indicator. In these instances, indicators use a score based on the RNA copy number ratios of multiple targets or determine profile similarity based on cluster analysis [8].
Wider implementation of prognostic and predictive tests utilising gene expression measurements of multiple markers is anticipated for a number of conditions, including breast cancer [9], colorectal cancer [10] and coronary artery disease [11]. A number of gene expression tests have been developed for personalised prognosis of early stage breast cancer [12], some of which are conducted at a central laboratory while the recently developed EndoPredict assay is suitable for implementation in multiple regional laboratories [13]. This raises the issue of how to ensure comparability of the underlying RNA copy number ratio values (which is calculated based on differences in the quantification cycle (Cq; formerly threshold cycle Ct or crossing point Cp) in the case of RT-qPCR measurements [14]) and the calculated prognostic scores between alternative tests [15]. In order to assess the accuracy (i.e. closeness of agreement between a measured quantity value and a true quantity value [16]) of measurements by different laboratories or different assays through round-robin or external quality assessment schemes [13], samples with independently assigned reference values would be required. For value assignment of control samples in terms of RNA copy number ratio, analytical methods of high accuracy and inter-laboratory reproducibility (precision of measurements when performed at different locations, by different operators or using different platforms [16]), are required (so called reference methods [17]), where sources of error are well understood and can be captured in a measurement uncertainty budget [18]. While one study assessed the reproducibility of the Oncotype Dx multiple gene signature test for recurrence prognosis and therapeutic response prediction in breast cancer, this was restricted to comparisons between different operators within the same laboratory [19]. Others have addressed the question of inter-laboratory reproducibility, but have only evaluated a single target with large (several orders of magnitude) changes in expression [7]. The suitability of methods for RNA analysis to fulfil the function of reference methods for multiparametric gene expression signatures has not previously been evaluated.
In the current study CCQM-P103.1, the accuracy and inter-laboratory reproducibility of RNA biomarker measurements was assessed by comparing multiple RNA copy number ratios and associated measurement uncertainties of a panel of six ERCC synthetic transcripts spiked into a complex RNA background. Three endogenous RNA targets present within the complex background, consisting of total RNA from three commonly used human liver, brain and bone cell lines, were also selected as ‘genes of interest’ (GOIs) and some participating laboratories measured these alongside the synthetic transcripts. Laboratories reported the RNA copy number ratio (the measurand) of each target transcript between two unknown samples (Unknown 1, U1, and Unknown 2, U2). Laboratories could use the method of their choice; the coordinating laboratory provided participating institutes with information on the RT-qPCR method and primer/probe sequences to nine mRNA targets which had been used in the development of the study materials and information on possible normalisation approaches for the endogenous GOIs (Supplementary information A). Participating National Measurement Institutes (NMIs) were not obliged to follow this and performed measurements and calculations independently for the purpose of developing and demonstrating capability in this field of measurements. The majority of laboratories used a reverse transcription quantitative polymerase chain reaction (RT-qPCR) approach, whilst two laboratories analysed the study materials using reverse transcription digital polymerase chain reaction (RT-dPCR), a binary-counting method based on limiting dilution [20], [21]. Two dPCR platforms were utilised with one laboratory using microfluidic dPCR arrays, which partition each sample into over 700 sub-nanolitre-scale reaction chambers [22], and another laboratory a droplet-dPCR (ddPCR) system, which partitions samples into approximately 20,000 sub-nanolitre-scale emulsion droplets [23]. In addition, one laboratory examined the study materials using a next generation sequencing (NGS) method for whole transcriptome sequencing (RNA-Seq) [24] to obtain further insights into the accuracy of NGS methods for quantitative expression profiling.
2. Materials and methods
2.1. Preparation of test materials
Each ERCC plasmid DNA (ERCC-00013, -00025, -00042, -00099, -00113 and -00171)(NIST) was linearised and in vitro transcribed using a Megascript T7 kit (Ambion) to produce corresponding ERCC RNA stock solution. Following in-solution DNase treatment (Turbo DNase, Ambion) and clean-up using an RNeasy Mini Kit (Qiagen) with on-column DNase treatment, the concentration (ng/μL) of each transcript stock solution was measured using the Nanodrop 1000 spectrophotometer (Thermo Scientific). RNA copy number per μL (copies/μL) of each ERCC in the solution was estimated based on the molecular weight of each transcript and the Avogadro number. The identity and purity of each in vitro transcribed ERCC was confirmed by electrophoresis using the 2100 Bioanalyzer (Agilent); purity was estimated based on the presence of specific and non-specific length fragments in the Bioanalyzer traces and taken into consideration for assignment of RNA copy number concentration in the Calibrant material (Section 2.4.1).
Endogenous genes of interest matrix metallopeptidase 1 (MMP1); nestin (NES); and solute carrier family 1 (glial high affinity glutamate transporter) member 3 (SLC1A3) were expressed to differing extents in three different cell lines: hepatoma Hep-G2, oligodendroglioma Hs 683 and osteosarcoma SaOS-2 cells (ATCC). Cell lines were maintained under supplier’s recommended culture conditions. Total RNA was extracted using TRIzol reagent (Invitrogen) and genomic DNA was removed using DNase (Ambion, rDNase I). RNA was purified using an RNeasy Midi kit (Qiagen). RNA quantity and quality were assessed using Nanodrop 1000 and 2100 Bioanalyzer, respectively. A260/280 and A260/230 ratios >2.0 and RNA integrity number (RIN) of ≥9.3 confirmed high purity and integrity of total RNA.
Each ERCC RNA stock solution was diluted in RNA Storage Solution (Ambion) to 109 copies/μL (for Calibrant) or 108 copies/μL (for U1, U2) and different volumes of these solutions were mixed to produce three 100× ERCC solutions each containing all six ERCC transcripts at 100 times the final concentration (further information contained in Supplementary information Section B). Each cell line RNA stock solution was diluted in RNA Storage Solution to fixed concentrations and three ‘mixed ratio cell line’ solutions for U1, U2 and Calibrant, were prepared by mixing different proportions of each cell line RNA to a final concentration of 50 ng/μL. Each 100× ERCC solution was spiked into the corresponding ‘mixed ratio cell line’ solution to produce U1, U2 and Calibrant materials. The U1, U2 and Calibrant solutions were aliquoted (150 μL) to generate 245 units of each material.
2.2. Stability of test materials
A short-term stability (STS) study was undertaken at a range of temperatures to establish the fidelity of unit composition during sample distribution. Study materials Calibrant, U1 and U2 were maintained at −80 °C (reference temperature), or on dry ice, 4 °C and 40 °C for time (T) 0, 7 and 14 days (three replicate units per temperature and time point). Immediately following incubation at designated temperatures, units were tested isochronously by RT-qPCR (50 ng per reaction) for one ERCC (ERCC-00099) and one reference gene (hypoxanthine guanine phosphoribosyltransferase 1, HPRT1) (n = 1 assay/unit). These analytes were chosen to represent exogenous and endogenous transcripts, respectively, in the stability study. RT-qPCR was performed by the coordinating laboratory as described in the Study Protocol, Supplementary information A. Cq values (Supplementary information B, Fig. B.1) were analysed by fitting a linear model to each assay and sample combination, with time and temperature as the covariates, using R version 3.1.1 [25]. As the aim of this analysis was to establish whether the Cq value varied with storage time, the time variate was treated as a continuous variable.
A long-term stability (LTS) study was also performed in order to ascertain whether the study materials remained stable when stored at −20 °C in the case that −80 °C storage, which is the standard storage temperature for RNA-based materials, was not available in the participating laboratories. Three replicate units for each Calibrant, U1 and U2 were incubated for one week on dry ice (to simulate the shipping period) before being transferred to either −80 °C or −20 °C for six months. Measurements of ERCC-00099 and HPRT1 were made following 6 months storage using the same RT-qPCR approach used for the STS. The Cq values for a particular unit type at the two temperatures (Supplementary information B, Fig. B.2) were compared by ANOVA using R version 2.14.1.
2.3. Homogeneity of test materials
Sample homogeneity was evaluated for Calibrant, U1 and U2 units. Eight technical replicates from ten units were analysed by one-step RT-qPCR for ERCC-00099 and HPRT1 (Supplementary information B, Fig. B.3) and data analysed using R version 2.13.1. A preliminary check for effects of RT-qPCR plate location (row and column) was performed using linear modelling [26]. One plate (U2/HPRT1) showed a statistically significant row effect (p = 0.003); another (U1/ERCC-99) showed a significant column effect (p = 0.025, increasing to 0.06 on outlier removal). Plate U1/HPRT1 showed a strongly significant column effect (p = 0.002) on removal of the outlier in the set, and a marginal effect (p = 0.0502) otherwise. Therefore within- and between-unit components of variance in Cq data were obtained by restricted maximum likelihood estimation using a mixed effects model in which RT-qPCR plate row and column were taken as fixed effects and sample ID (unit or tube) as random effects [27].
2.4. ERCC assigned values and uncertainties
2.4.1. RNA copy number
ERCC RNA copy number values and uncertainties for Calibrant and Unknown materials were calculated taking into account the following factors: stock concentration, material integrity (purity, homogeneity, stability) and volumetric dilution of the stock solution (for example calculation, see Supplementary information C, Table C.1).
The standard uncertainty for stock concentration was estimated based on replicate measurements of the specific ERCC stock solution together with an allowance for between-day variation based on previous findings. Nanodrop calibration was also included in the uncertainty budget for concentration-related effects.
Purity of each stock solution was estimated based on the Bioanalyzer profile using the proportion of the area under the curve corresponding to the fragment of the expected length. Fragments smaller than the expected size may arise from early termination of transcription or non-specific transcription from the plasmid backbone. Longer fragments could be produced due to concatenation of multiple transcripts or failure of the polymerase to terminate at the stop site. Therefore, non-specific fragment peaks may contain multiple copies of the target sequence, one copy of the target sequence or non-target sequence RNA. Considering this, best and worst case scenarios of non-specific fragments containing (a) one copy of the target sequence (or multiple copies in the case of longer fragment lengths) or (b) no copies of the target sequence were modelled. The purity was accordingly assigned as the mid-point of the interval between the highest and lowest possible content of the target sequence considering scenarios (a) and (b) for the material as a whole. The uncertainty was calculated as the standard uncertainty from the same range (treated as the limits of a rectangular distribution).
2.4.2. RNA copy number ratio
Since both Unknown samples were prepared from the same ERCC stock solutions, common factors such as stock concentration and purity did not contribute to the uncertainty budget of the U1/U2 RNA copy number ratio. Therefore, the assigned value of each ERCC copy number ratio is only the different volumes used to prepare the study Unknowns. The associated measurement uncertainty is composed of precision terms related to the independent dilution steps performed in the preparation for each Unknown (U1, U2), the calibration uncertainties associated with different volumes and sample homogeneity. An example of the calculation process for the assigned value and uncertainty of ERCC-00013 U1/U2 copy number ratio is shown in Supplementary information C Table C.2 which illustrates the contribution of Unknown 1 (Table C.2A) and Unknown 2 (Table C.2B) to the combined uncertainties (Table C.2C).
2.5. Participation in CCQM-P103.1
Thirteen NMIs participated in pilot study CCQM-P103.1 and reported results for the compulsory measurement of the six ERCC targets, including one NMI (CENAM) which submitted results after the disclosure of the study results (Table 1). Of the participating laboratories, ten NMIs also submitted results for the optional measurement of the endogenous GOI targets (Table 1).
Table 1.
List of BAWG CCQM-P103.1 pilot study participants.
| Institute/Organisation | Country | Endogenous target measurement |
|---|---|---|
| AIST | Japan | No |
| CENAM | Mexico | No |
| INMETRO | Brazil | Yes |
| KRISS | R. of S. Korea | Yes |
| LGC | United Kingdom | Yes |
| NIB | Slovenia | Yes |
| NIM | P. R. of China | Yes |
| NIMT | Thailand | Yes |
| NIST | USA | Yes |
| NMIA | Australia | Yes |
| NMIJ | Japan | No |
| TÜBİTAK UME | Turkey | Yes |
| VNIIM | Russian Federation | Yes |
For ERCC targets, a total of fourteen datasets were submitted by the thirteen participating NMIs, with one NMI submitting results using both RT-qPCR and RT-dPCR approaches. The fourteen datasets were assigned a laboratory ID number on a random basis. For GOI targets, a total of eleven datasets were submitted, with one NMI submitting results using both RT-qPCR and RT-dPCR approaches, with the exception of NES, where one laboratory did not submit a result (total 10 datasets).
2.6. Analytical methods and instrumentation
The analytical methods, instrumentation and reagents used by the participating laboratories are summarised in Table 2. The majority of laboratories (11 of 14 datasets) used an RT-qPCR approach, with two laboratories submitting results generated using RT-dPCR and one laboratory analysing the test materials using a NGS RNA-Seq approach.
Table 2.
Analytical methods and instrumental techniques used by the CCQM-P103.1 participants.
| Laboratory ID | Method | Instrument make & model | Diluent | Carrier | RT-PCR approach | RT-PCR Master-mix | RT priming1 | Thermal cycling | Primer/Probe concentration | Reaction (Sample) volumes2 |
|---|---|---|---|---|---|---|---|---|---|---|
| 1 | RT-qPCR | ABI HT 7900 FAST | Water | Yes | One-step | As protocol | One-step | As protocol | As protocol | (2 μL) |
| 2 | RT-qPCR | StepOne (ABI) | Yeast tRNA | Yes | One-step | As protocol | One-step | As protocol | As protocol | 15 μL |
| 3 | RT-qPCR | ABI 7500 | Water | No | One-step | As protocol | One-step | As protocol | As protocol | As protocol |
| 4 | RT-qPCR | ABI 7500 | Water | Yes | One-step | As protocol | One-step | As protocol | As protocol | As protocol |
| 5 | RT-qPCR | ABI 7900 HT | Water | Yes | One-step | As protocol | One-step | As protocol | As protocol | As protocol |
| 6 | RT-qPCR | LC480 (Roche) | Yeast tRNA (ERCCs only) | Yes (ERCCs only) | One-step | As protocol | One-step | As protocol | As protocol | 20 μL (2 μL) |
| 7 | RT-qPCR | ABI7900 | Water | Yes | One-step | Power SYBR Green RNA-to-Ct 1 Step Kit (ABI) | One-step | 40 cycles | As protocol (primers only) | 20 μL (2 μL) |
| 8 | RT-dPCR | Bio-Rad QX100 Droplet Digital PCR system | RNA storage solution (RSS) (Ambion) | Yes | One-step | One-Step RT-ddPCR kit for Probes (Bio-Rad) | One-step | RT: 60 °C 30 min Hold: 95 °C 5 min PCR: 40 cycles of (94 °C-30 s, 60 °C-1 min); Hold 98 °C 10 min; Hold 4 °C. |
As protocol | 20 μL (5 μL) |
| 9 | RT-qPCR | LC 480 (Roche) (ERCCs, 2 units) ABI 7900HT (ERCCs, 1 unit; GOI) |
Water (Calibrant) | Yes | One-step | As protocol | One-step | As protocol | As protocol | As protocol |
| 10 | RT-qPCR | ANK32, IAP RAS | Yeast tRNA | No | Two-step | RT: RevertAid First Strand cDNA Synthesis Kit (Fermentas) qPCR: Syntol Reagent Set with Buffer B for PCR |
Gene-specific (antisense primer 400 nM) | RT: 45 °C, 30 min qPCR: 95 °C, 10 min, (60 °C 45 s; 95 °C 15 s) × 40 cycles |
200 nM primer; 100 nM probe (LNA probes endogenous) | RT and qPCR: 20 μL (6 μL (RT); 2 μL (qPCR)) |
| 11 | RNA-Seq | SOLiD v4/5500xl | N/A3 | N/A | N/A | N/A | Random | N/A | N/A | N/A |
| 12 | RT-dPCR | BioMark 48.770 dPCR arrays (Fluidigm) | Water | Yes | One-step | As protocol | One-step | As protocol | As protocol | 5 μL (variable) |
| 13 | RT-qPCR | ABI7900 | Water | Yes | One-step | Power SYBR Green RNA-to-Ct 1 Step Kit (ABI) | One-step | 40 cycles | As protocol (primers only) | 20 μL (2 μL) |
| 14 | RT-qPCR | ABI HT 7900 FAST | RSS (Ambion) | Yes | One-step | As protocol | One-step | As protocol | As protocol | As protocol |
Gene-specific for one-step RT-qPCR.
If different from study protocol.
See Supplementary information D for details of RNA-Seq method.
The assays used by the 13 laboratories that employed a RT-qPCR or RT-dPCR-based approach utilised the primer sequences (and in the majority cases (10/13), probe sequences) specified in the Study Protocol (Supplementary information A). Therefore, differences between these laboratories’ results are unlikely to stem from differences in the specificity of the assays used, however as primers/probes were not supplied by the coordinating laboratory, differences in oligonucleotide synthesis such a purification and efficiency of dye incorporation are one factor which differed between laboratories. The majority of these laboratories used hydrolysis probe chemistry for signal detection, Other differences between laboratories included 2 sites (# 7 and 13) employing a SYBR Green intercalating dye qPCR approach and the probes for the endogenous gene target assays used by laboratory 10 were synthesised using locked nucleic acid (LNA)-bases as opposed to minor groove binding probes (Table A6).
Of the eleven laboratories performing RT-qPCR, ten laboratories employed a one-step method, where both RT and qPCR occur in a single reaction vessel. Eight laboratories used the AgPath One-Step RT-PCR mastermix specified in the Study Protocol (Supplementary information A), whilst the laboratories employing a SYBR Green approach used a one-step RT-PCR SYBR Green mastermix. One laboratory used a two-step RT-qPCR method, where complementary DNA (cDNA) is synthesised in a separate reaction prior to qPCR (Table 2).
Both laboratories performing RT-dPCR quantified target transcripts using a one-step RT-dPCR approach based on hydrolysis probe chemistry for end-point detection of amplified molecules. In terms of digital PCR instrumentation employed, a ddPCR platform (Bio-Rad) based on droplet PCR was used by laboratory 8 and a microfluidic chip approach (BioMark from Fluidigm) was employed by laboratory 12.
Laboratory 11 analysed the study samples using SOLiD (ABI) NGS method (Table 2). Further details of the NGS library preparation and instrumentation used are provided in Supplementary information D.
2.7. Quantification and normalisation strategies
Measurements of ERCC RNA copy number ratios by RT-qPCR were possible using either a standard curve (SC) approach by preparation of dilution series of the Calibrant material or a relative quantification (RQ) method based on differences in Cq values of the two Unknown samples [14]. Of the eleven laboratories performing RT-qPCR, seven measured ERCC copy number ratios using a SC approach whilst four used a RQ approach (Table 3). dPCR measures the number of DNA (in this case, cDNA) copies in a sample without the requirement for a SC [20], (Table 3).
Table 3.
Summary of quantification and normalisation approaches for reported valuesERC.
| Target | ERCC |
Endogenous GOI2 |
||||
|---|---|---|---|---|---|---|
| Laboratory ID | Approach | PCR efficiency correction | Approach | PCR efficiency correction | Genes used for normalisation | Normalisation factor3 |
| 1 | RQ | No | RQ | No | 3 | Geometric mean |
| 2 | SC | N/A1 | RQ | Yes (mean) | 3 | Geometric mean |
| 3 | SC | N/A | RQ | No | 1 (CASC3) | N/A |
| 4 | RQ | No | RQ | No | 2 (CASC3, HPRT1) | Geometric mean (Cq) |
| 5 | SC | N/A | RQ | Yes (mean) | 3 | Geometric mean |
| 6 | SC | N/A | RQ | No | 3 | Geometric mean (Cq) |
| 7 | SC | N/A | – | – | – | – |
| 8 | dPCR | N/A | dPCR | N/A | 3 | Geometric mean |
| 9 | RQ | No | RQ | No | 3 | Geometric mean |
| 10 | RQ | No | RQ (MMP1, SLC1A3 only) | No | 3 | Geometric mean |
| 11 | NGS | N/A | NGS | N/A | No | N/A |
| 12 | dPCR | N/A | dPCR | N/A | 3 | Geometric mean |
| 13 | SC | N/A | – | – | – | – |
| 14 | SC (ERCC-25 ND) | N/A | – | – | – | – |
N/A: not applicable.
Laboratories 7, 13 and 14 did not participate in the optional study of endogenous GOIs.
Geometric mean of copy number concentration values unless specified as Cq.
Eleven datasets were submitted with measurements of endogenous GOI targets, using RT-qPCR (eight laboratories), RT-dPCR (two laboratories) or RNA-Seq (one laboratory) (Table 3). Due to transcript abundance levels, the Calibrant study material was not suitable for the preparation of a SC for measurement of these transcripts; therefore, a RQ approach was required for analysis of the endogenous GOI targets by RT-qPCR. Two out of the eight laboratories using RT-qPCR applied correction for PCR efficiency in copy number ratio calculations (Table 3). All of the laboratories using RT-qPCR and RT-dPCR normalised their GOI ratio measurements using measurement(s) of one or more of the suggested reference genes (cancer susceptibility candidate 3; CASC3, HPRT1 and ubiquitin C; UBC), with the majority (seven datasets) applying a normalisation factor consistent with the GeNorM approach developed by Vandesompele et al. based on the geometric mean of the relative quantities of all three reference genes [28] and two laboratories applying the geometric mean of the Cq values (Table 3).
3. Results
3.1. Assigned values, homogeneity and stability of test materials
ERCC RNA transcripts were present in U1 and U2 at copy number ratios between 0.14 and 5.0 and at a range of concentrations between approximately 103 and 105 copies/μL, spiked into a complex background composed of total RNA from Hep-G2, Hs 683 and SaOS-2 cells. Table 4 gives the assigned copy number ratio and expanded measurement uncertainties. Expanded uncertainties reflect the probable range of ratio values (e.g. 0.14 ± 21%, i.e. range of 0.11–0.17) at a 95% level of confidence and are calculated by applying a coverage factor (k) to the standard measurement uncertainty [18].
Table 4.
Assigned U1/U2 RNA copy number ratio values and uncertainties of ERCC transcripts.
| ERCC- | Unknown 1 (copies/μL)1 | Unknown 2 (copies/μL)1 | U1/U2 RNA copy number ratio2 | Expanded Uncertainty (k = 2)2 | Expanded Relative Uncertainty (%) |
|---|---|---|---|---|---|
| 00013 | 60,000 | 90,000 | 0.67 | 0.14 | 21% |
| 00025 | 5000 | 5000 | 1.00 | 0.20 | 20% |
| 00042 | 1000 | 7000 | 0.143 | 0.029 | 20% |
| 00099 | 70,000 | 70,000 | 1.00 | 0.20 | 20% |
| 00113 | 21,000 | 7000 | 3.00 | 0.60 | 20% |
| 00171 | 100,000 | 20,000 | 5.0 | 1.0 | 20% |
Approximate values (for assigned RNA copy number values,see Supplementary information E).
Uncertainties are rounded to 2 significant figures (s.f.) and up to 3 decimal places (d.p.), with corresponding RNA copy number ratio values rounded to the equivalent decimal places.
Since the endogenous GOIs were present in the background cell line RNAs, it was not possible to assign a RNA copy number ratio to these three targets; therefore, the comparability of results for these targets was assessed relative to a consensus value (Section 3.2.3).
The STS study (Supplementary information B, Fig. B.1) showed no systematic effects on Cq for the two analysed targets (one ERCC, ERCC-00099, and one endogenous, HPRT1), with the exception of 40 °C for the Calibrant sample in assay ERCC-99 (p-value = 0.017), where an increase in Cq was noted. Therefore it was ensured that all study materials were shipped on dry ice and their condition checked upon receipt. No evidence of temperature-mediated instability was found based on comparison of RNA concentration values for the two targets during the LTS study (Supplementary information B, Fig. B.2), confirming that storage of the samples at −20 °C for the time period covering the duration of the study is acceptable. No allowance for sample stability was, therefore, made in the assigned values and uncertainties of the test materials (Supplementary information C).
Differences in the concentration of transcripts between tubes of the same study materials (“between-unit homogeneity”) were assessed by RT-qPCR measurements of the same two targets as the stability studies (Supplementary information B, Fig. B.3). Results showed that for ERCC-00099, the between-unit relative standard deviation (RSD) was 6.1%, 6.8% and 4.4% for Calibrant, U1 and U2, respectively. For HPRT1, the between-unit RSD (to 2 s.f.) was calculated to be 0.00%, 0.00% and 2.3% for Calibrant, U1 and U2, respectively. As ERCC-00099 is taken to be representative of the other ERCC transcripts in the study materials, a standard uncertainty of 7% (rounded to one significant digit) was included in the measurement uncertainty budget for all ERCC transcripts in all types of material (Supplementary information C). As assigned values were not calculated for the endogenous gene targets, the HPRT1 results were interpreted as confirmation of acceptable between-unit homogeneity with respect to the endogenous gene targets.
3.2. Participants’ results
3.2.1. RNA copy number ratio measurements
The CCQM-P103.1 participants’ results for ERCC RNA copy number ratios along with reported measurement uncertainties (MU) are given in Table 5. The reported values are displayed graphically in Fig. 1A–F for ERCC-00013, -00025, -00042, -00099, -00113 and -00171, respectively. The participants’ reported values of the measurand (U1/U2 RNA copy number ratio) for each ERCC target are also plotted on log2-transformed scales (Supplementary information F, Fig. F.1), with the purpose of reflecting the magnitude of the fold differences between Unknowns. In this study, ERCC-00042, which is present at a much lower level in U1 than in U2 can be seen as ‘down-regulated’ in U1, as assigned U1/U2 RNA copy number ratio of 0.143 corresponds to a 7-fold decrease in ‘expression’ in U1 compared to U2. The difference between the reported RNA copy number ratio result for each laboratory and the assigned value in the case of ERCC targets was assessed for significance, taking into account the reported uncertainty and uncertainty of the assigned value (Supplementary information G, Table G.1).
Table 5.
ERCC U1/U2 RNA copy number ratios: participants’ results and assigned values.1
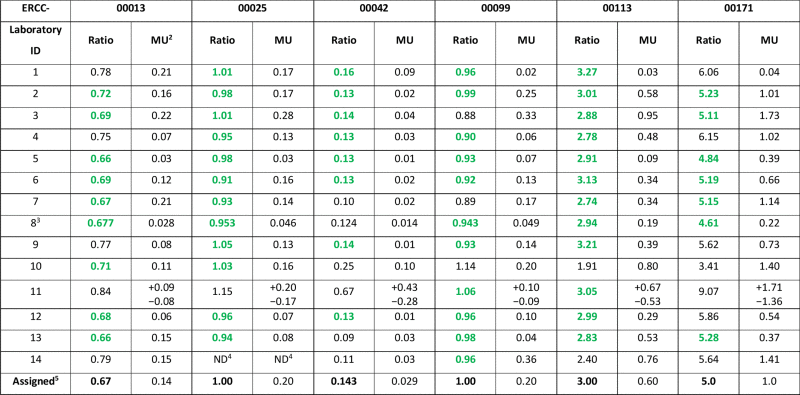 |
1Participants’ U1/U2 RNA copy number ratio and uncertainties were reported to 2 d.p. unless stated otherwise. Values are coloured  if they fall within 10% of the assigned value.
2Expanded measurement uncertainty (for coverage factors (k), see Supplementary Table H2).
3MU was reported to 2 s.f. and U1/U2 RNA copy number ratio was reported to same d.p. as MU.
4ND: Not done.
5Assigned value uncertainties are rounded to 2 s.f. and up to 3 d.p., with assigned U1/U2 RNA copy number ratio values rounded to the equivalent decimal places.
Fig. 1.

ERCC RNA copy number ratios: Participants’ results and assigned values. Reported U1/U2 RNA copy number ratios for ERCC-00013, -00025, -00042, -00099, -00113 and -00171 (denoted ERCC-13, -25, -42, -99, -113 and -171 in A–F respectively) and expanded uncertainties are shown as reported (linear) values. Approximate copy number concentration in U1 (as Table 1) are shown in brackets below ERCC target. Log2-transformed values can be found in the Supplementary information, Fig. F1 . Results are displayed according to method (RT-qPCR (SC,  ); RT-qPCR (RQ, circle); RT-dPCR (
 ) and NGS (
 )) and then ordered numerically by laboratory ID. Solid and dashed horizontal lines indicate assigned value and expanded uncertainty (k = 2).
ERCC-00013 reported values ranged from 0.66 to 0.84 (Fig. 1A), and all results with the exception of laboratory 11 (p = 0.03) were consistent with the assigned value (Supplementary Table G1) and nine participants reporting values falling within 10% of the assigned ratio (0.67) (Table 5). For ERCC-00025, U1 and U2 materials were designed to generate no fold change (an assigned U1/U2 copy number ratio value of 1.0) (Fig. 1B). All 13 participants’ results (laboratory 14 did not submit a result for this target) were consistent with the assigned value (Supplementary Table G1), with the 12 RT-qPCR and RT-dPCR participants reporting ratios within 10% of the assigned value for ERCC-00025 (Table 5). Reported values for ERCC-00042 ranged from 0.09 to 0.67 (Fig. 1C) and all results with the exception of laboratory 11 were consistent with the assigned value of 0.143 (Supplementary Table G1). Five of the participants (laboratories 2, 3, 5, 6 and 9) reported values within 10% of the assigned ratio (Table 5). Like ERCC-00025, ERCC-00099 transcript levels in U1 and U2 were also designed to produce no fold change (an assigned U1/U2 copy number ratio value of 1.0); reported values ranged from 0.88 to 1.14 (Fig. 1D) with all 14 reported results being consistent with this assigned value (Supplementary Table G1). Eleven of the reported ratios fell within 10% of the assigned value (Table 5). The assigned ratio for ERCC-00113 was 3.0 with reported values ranging from 1.91 to 3.27 (Fig. 1E), with all results being consistent with the assigned value with the exception of laboratory 10 (Supplementary Table G2) whilst 12 of the participants’ reported values falling within 10% of this (Table 5). ERCC-00171 U1/U2 RNA copy number ratio had an assigned value of 5.0; reported values ranged from 3.41 to 9.07 (Fig. 1F) with two results not being consistent with the assigned value (laboratories 1 and 11) (Supplementary Table G2). Seven of the participants’ reported ratios were within 10% of the assigned value (Table 5).
3.2.2. Participants’ results: endogenous gene of interest targets
The CCQM-P103.1 participants’ results for endogenous GOI RNA copy number ratios with reported uncertainties are given in Table 6 and Fig. 2. When compared with the consensus values and uncertainties for these targets (Section 3.2.3), results from the majority of laboratories were consistent with the consensus range (Supplementary information G, Table G.2).
Table 6.
Endogenous GOI U1/U2 RNA copy number ratios: participants’ results and consensus values.1
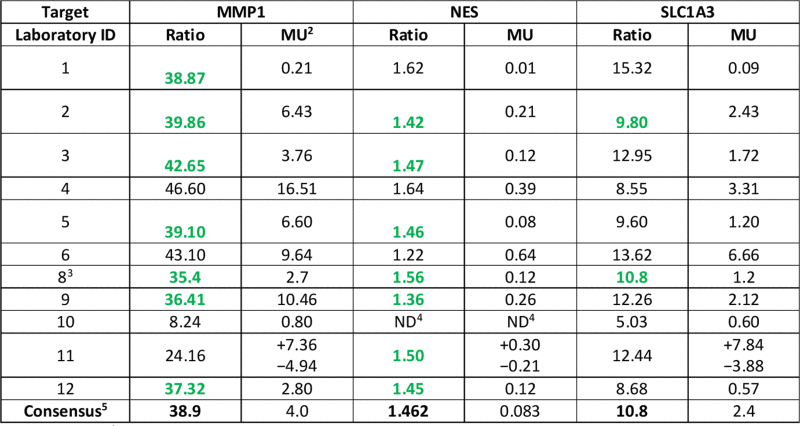 |
1Participants’ U1/U2 RNA copy number ratio and expanded uncertainties reported to 2 d.p. unless otherwise stated. Values are coloured  if they fall within 10% of the consensus value.
2Expanded measurement uncertainty (for coverage factor (k) see Supplementary information Table H2).
3MU was reported to 2 s.f. and U1/U2 RNA copy number ratio was reported to same d.p. as MU.
4ND: not done.
5Consensus value uncertainties are rounded to 2 s.f. and up to 3 d.p., with consensus values rounded to the equivalent number.
Fig. 2.

Endogenous GOI U1/U2 RNA copy number ratios: Participants’ results and consensus values. Reported U1/U2 RNA copy number ratios for MMP1, NES and SLC1A3 (A–C respectively) and expanded uncertainties shown as reported (linear) values. Log2-transformed values can be found in the Supplementary information F Fig. F.2 . Results are grouped according to method (RT-qPCR (RQ, circle), RT-qPCR (with PCR efficiency correction,  ), RT-dPCR (
 ) and NGS (
 )) and then ordered numerically by laboratory ID. Solid and dashed horizontal lines indicate consensus value (Section 3.2.3) and expanded uncertainty (k = 2), respectively. Note Laboratory 10 did not submit a result for NES (Table 6).
Of three GOI targets, MMP1 displayed the largest fold-difference in transcript level between U1 and U2 (median reported U1/U2 copy number ratio value 38.9). The majority of participants reported values within approximately 10% of this value (the ratio of between 35 and 43), although results from laboratories 10 and 11 were outside this range (Fig. 2A). NES displayed the smallest U1/U2 copy number ratio (median reported value 1.46), with values ranging from 1.22 to 1.64 (−17% and +12% of the median value) (Fig. 2B). SLC1A3 showed an intermediate U1/U2 copy number ratio (median value 10.8) compared to MMP1 and NES, with reported ratio values ranging from 5.0 to 15.3 (−53% and +41.9% of the median value) (Fig. 2C).
3.2.3. Consensus value estimation
The reported participant laboratories’ estimates of the GOI U1/U2 RNA copy number ratios and associated uncertainties have a number of features which make the choice of statistical method important if a reliable estimate of the consensus U1/U2 RNA copy number ratio value is to be determined:
-
i.
The MMP1 data do not appear to follow a normal distribution due to the presence of two low RNA copy number ratio values. This means that a robust method is needed in order to avoid creating a bias in the result and overestimating the uncertainty.
-
ii.
The reported uncertainties vary considerably between laboratories using the same RT-qPCR method (for example, laboratories 1 and 9 (Table 1)). This suggests that laboratories either did not take into account the same sources of error or did not treat the data consistently in evaluating uncertainties (for further comment see Discussion), therefore, methods based on weighting by uncertainty are not suitable.
-
iii.
The laboratory uncertainties relative to their respective estimated ratios do not account fully for the observed dispersion between laboratories. This suggests that the uncertainties themselves are unreliable or that other sources of between-laboratory variance are present. This is confirmed by χ2 analysis (Table 7): observed χ2 values exceed the critical χ2 indicating overdispersion of the laboratories’ results.
Table 7.
Analysis of dispersion of participants’ results.
| Target | n | χ2 | Critical χ20.95,n |
|---|---|---|---|
| MMP1 | 11 | 5902 | 19.7 |
| NES | 10 | 1554 | 18.3 |
| SLC1A3 | 11 | 9760 | 19.7 |
χ2 statistics were performed for participants’ results (n) for each of the endogenous GOIs. The critical χ2 value at the 95% confidence interval is displayed in column 4.
The median of the laboratory estimates was calculated and a standard uncertainty u is based on the median absolute deviation (MAD) as follows (Eq. (1)):
| (1) |
where is the MADe (an estimate of the standard deviation based on applying a conversion factor of 1.483 to the MAD to provide a consistent estimator of standard deviation assuming normality [29]), the factor √(π/2) is a correction for the asymptotic efficiency of the median and n is the number of laboratories (Table 8). The calculated median/MADe values were compared with three other statistical methods for consensus value estimation, both weighted and unweighted, in order to illustrate the effect of different choices of method on the outcome (Table 8). The weighted methods require a standard uncertainty for each laboratory; however, laboratory 11 provided estimates with asymmetric 95% confidence intervals, rather than a standard uncertainty. For this case, the mean of the upper and lower error bar lengths was used to estimate the expanded uncertainty; this was then divided by 2 to obtain an effective standard uncertainty. (Laboratory uncertainties are only required for weighted methods).
Table 8.
Calculation of consensus value and associated standard uncertainty using four methods.
| Method | Median/MADe |
Huber estimate Weighted robust estimate [30] |
DerSimonian-Laird Excess variance estimate [31] |
Huber M-estimate (Huber Proposal 2) Unweighted robust estimate |
||||
|---|---|---|---|---|---|---|---|---|
| Target | Estimate | u | Estimate | u | Estimate | u | Estimate | u |
| MMP1 | 38.9 | 2.0 | 38.81 | 0.23 | 35.4 | 5.9 | 37.7 | 1.8 |
| NES | 1.462 | 0.041 | 1.612 | 0.009 | 1.497 | 0.041 | 1.476 | 0.033 |
| SLC1A3 | 10.8 | 1.2 | 15.10 | 0.38 | 10.7 | 1.7 | 10.96 | 0.79 |
Standard uncertainties (u) are rounded to two s.f. and up to three d.p., with corresponding estimates rounded to the equivalent number.
The weighted Huber method [30] is highly influenced by the laboratory with the smallest uncertainty, underestimating the consensus value uncertainty and, perhaps, creating bias in the consensus value in cases where a laboratory deviates substantially from the majority with respect to its uncertainty. Where there is substantial over dispersion between laboratories, or outlying results, the DerSimonian-Laird excess variance approach [31] produces a larger uncertainty as expected; this is particularly evident in the MMP1 data. The median/MADe and unweighted Huber Proposal 2 values are quite consistent with each other (Table 8). For these reasons, the median of the laboratory estimates is recommended as the consensus value with a recommended coverage factor to cover an approximately 95% interval of k = 2.
4. Discussion
In the current study, CCQM-P103.1, six synthetic ERCC and three endogenous GOI transcripts were analysed in two blinded samples (U1 and U2) by 13 NMI laboratories (10 for GOI targets) who reported the U1/U2 RNA copy number ratio for each target. The aim of the study was to evaluate intra- and inter-laboratory comparability of methods for mRNA quantification, in order to support the future development of molecular diagnostic tests based on the gene expression of multiple mRNA biomarkers. Concordance of participants’ U1/U2 RNA copy number ratio results were assessed by comparison with assigned values (for the six ERCC transcripts, mixed at defined ratios) and consensus values (for the three endogenous GOI transcripts where the ‘true’ value was unknown).
The majority of laboratories reported ERCC results which were found to be consistent with assigned range of copy number ratio values. Likewise, >80% 9 of the 11 of participants results (27 of 32) submitted results for the GOI targets were within the consensus value uncertainty range (Supplementary information G). Of the ten outlying results, seven were associated with substantial differences in the technique (laboratory 11) or RT-qPCR protocol (laboratory 10) used. The three other outlying results were associated with lower than average reported measurement uncertainty (relative expanded uncertainty <1%), suggesting that underestimation of the measurement uncertainty was the cause of these disagreements (laboratory 1). However the majority of laboratories reported results were consistent with the assigned values (associated with an uncertainty range of ±∼20%, Table 4). Furthermore >50% of reported values were within 10% of the ERCC assigned values. A previous study evaluating the within-laboratory reproducibility of the 21 genes assayed by the Oncotype Dx test demonstrated variability of between 0.06 and 0.15 normalised Cq units (corresponding to% variation of 4–11% based on assay efficiency of 100%) which took into account between-operator, -instrument (of the same make and model) and -days effects [19]. The current study CCQM-P103.1 took into account additional major sources of variation including laboratory, technique, make/model of instrument, reaction chemistry, carrier and diluent (Table 2). Therefore the 10–20% variation in results compared to the assigned or consensus values indicate that RNA copy number ratio measurements for multiple gene targets can be performed reproducibly by NMI laboratories using a validated and established protocol.
The majority of participating laboratories submitted results using an RT-qPCR approach and the method suggested in the Study Protocol (Supplementary information A), including the choice of a one-step RT-qPCR approach and use of carrier tRNA (Table 2). The main difference in ERCC copy number ratio measurement between these laboratories was the choice of a data analysis (SC- or RQ-based) approach (Table 3). Whilst the two different approaches did not appear to influence the reported ratios for some ERCCs (ERCC-00025, ERCC-00042, ERCC-00099), there was a trend for results from SC-based measurements to be closer to the assigned values for ERCC-00013 and -00171 (Fig. 1A and F). This could be due to variation in the PCR efficiency of the assays for the six targets as the PCR efficiencies of assays for ERCC-00013 (92%) and -00171 (87%) (Supplementary Table A6) were further from the ideal value of 100% than the other 4 targets. A SC approach controls for possible differences in PCR efficiency, whilst a RQ method which assumes PCR efficiency of 100% (i.e. doubling of the amount of target in every cycle in the delta Cq calculation [14]) may overestimate the magnitude of the fold change if the actual assay efficiency is <100%.
There were also differences between the laboratories performing a SC or RQ approach in terms of their uncertainty calculations (Supplementary information H). Of the sites performing a SC-based approach for analysis of ERCC transcripts, some included the assigned uncertainty of ERCC copy number in the Calibrant material and SC regression uncertainty in calculating the combined uncertainty whilst other laboratories did not. Of the eight sites performing a RQ-based approach for some or all targets (Table 3), some laboratories calculated uncertainty for the U1/U2 copy number ratio by combining measures of the variation in individual U1 and U2Cq values (laboratories 1, 4, 5, 6). Others considered the variation in the U1/U2 ratio as the primary source of uncertainty (laboratories 2 (GOI), 9, 10). Using a typical RQ approach [14], the difference between the Cq values of a pair of Unknowns (delta Cq, related to the U1/U2 copy number ratio) is calculated for each qPCR experiment. However, in the case that only three ratio values are available, this limits the degrees of freedom to 2 and necessitates a large coverage factor k of 4.3. It is also important for both SC and RQ-based approaches to understand that factors contributing to the uncertainty in the RNA copy number concentration of each sample may not influence the reported RNA copy number ratio between samples. For example, the uncertainty in the assigned concentration of a calibration material should be considered if the reported result is a RNA copy number concentration value; however, if the calibration curve is identical for measurements of two samples within an experiment, this source of uncertainty does not influence uncertainty in U1/U2 copy number ratio. Furthermore, correlation between the two variables (RNA copy number concentration or Cq of U1 and U2) should also be taken into account in the calculation of uncertainty for RNA copy number ratio values [32]. This is particularly important when the measurement design uses blocking to compare different samples directly under repeatability conditions, as it results in more reliable comparison and, therefore, smaller uncertainties. In this study, not all laboratories took proper account of this correlation and consequently reported unnecessarily large uncertainties.
Two of the laboratories performing a RQ approach included an allowance for variation in the assays’ PCR efficiency in the MU budget. As noted in the preceding paragraph, deviation of efficiency from the theoretical value of 100% will impact on the accuracy of the ratio calculated using a delta Cq approach [33], therefore, an allowance for variation in PCR efficiency based on dilution series or expected assay performance parameters should be included in measurement uncertainty budgets for laboratories using a RQ approach. For development of RT-qPCR as a higher order measurement procedure, best practice guidelines should be developed with regard to how different sources of uncertainty should be considered in value assignment of RNA copy number concentration and ratio measurements.
The eleven RT-qPCR datasets provide a representative cross-section of results obtained by this established technique to compare with more recently developed approaches, namely RT-dPCR and NGS. RT-dPCR results fell within the assigned range for all six ERCC transcripts (Fig. 1) and were also close to the consensus values for the endogenous GOI targets (Fig. 2). A high level of agreement was also apparent between the two sets of RT-dPCR results using alternative platforms (BioMark and QX100). Good comparability between dPCR technologies has been demonstrated for measurements of DNA [34], [35], however, this study is the first showing good agreement between dPCR platforms for RNA measurements. It has recently been shown that definition of the DNA copy number concentration of a plasmid reference material by dPCR enabled better inter-laboratory comparability in the results of copy number ratio measurements (BCR-ABL1/ABL1, % in [36]). The results of P103.1 provide evidence that RT-dPCR is an accurate method for value assignment of RNA-based materials in terms of copy number ratio, with such controls enabling RT efficiency to be monitored in routine applications [7]. RT-dPCR tended to have smaller reported uncertainties compared to RT-qPCR results (Supplementary information H). This may be due to the fact that dPCR does not require a standard curve and is not influenced overtly by variation in PCR efficiency, factors which could increase between-run variability [37], [38]. The RT-dPCR results from CCQM P103.1 for mRNA measurements are also consistent with a recent study reporting improved precision of dPCR for microRNA quantification [39].
The analysis of the CCQM-P103.1 test materials by NGS (laboratory 11) provides a useful test of this technology for quantitative transcript profiling. The NGS RNA-Seq approach measures sequencing reads from the entire transcript length whilst RT-qPCR and-dPCR based assays measure only approximately 100 bases within the transcript sequence. Whilst the NGS measurements of some ERCCs and endogenous targets were close to the assigned and consensus values, some U1/U2 copy number ratio measurements, such as for ERCC-00042, -00171 and MMP1, were less concordant. Analysis of the total number of reads (Fig. 3) reveals that limiting read depth and associated imprecision may be attributable for discordance in the results for low abundance targets such as ERCC-00042. In addition, positional effects are apparent in the distribution of reads across the length of transcript, which may have contributed to the differences between the NGS and RT-qPCR results for ERCC-00171 and MMP1 (Fig. 3). These may be due to biases in coverage of some regions of the transcript due to elements of library preparation, such as sequence-related differences in RT-priming and sequencing efficiency [4].
Fig. 3.

Comparison of U1 and U2 NGS read counts with transcript position. Raw NGS read counts are plotted vs. nucleotide position for ERCC transcripts (A); and tabulated according to exon number (B) for GOI transcripts. Total reads for all exons and unprocessed U1/U2 ratios are shown for each GOI (Further analysis of raw read counts (Supplementary information D) was performed for values reported in Table 5, Table 6). Position of the RT-qPCR amplicon is indicated in shaded grey (A) and red (B) areas.
The uncertainties reported for NGS results were within a similar range to the RT-PCR-based results for the majority of targets. The calculation of uncertainties associated with RNA-Seq results needs to take into account error associated with the sampling of reads from within the length of the transcript, for which multiple statistical models exist [40], [41]. In addition, technical sources of variation such as library preparation, which has been found to be associated with increased variation in read counts [4], should also be considered.
5. Conclusions
Pilot study CCQM-P103.1 sets a benchmark in terms of the technical performance of analytical methods for mRNA quantification and provides a foundation for the development of a reference system to support molecular diagnostic tests utilising changes in gene expression. By preparing ERCC controls at defined ratios between the tested samples, concordance of NMI laboratories’ results could be assessed with the true values as an indication of methodological biases. The majority of reported results (>90%) were in agreement with the assigned ERCC values, with close to 100% concordance observed for laboratories performing a validated RT-qPCR protocol. The good inter-laboratory reproducibility of the ERCC results was also observed with reported values for endogenous GOI transcripts within ∼20% of the consensus values for the majority of NMIs who participated in these optional measurements. The RT-qPCR datasets provide evidence that both SC and RQ approaches demonstrate the required accuracy and precision for development as reference methods [17] and highlight considerations for uncertainty calculations for RT-qPCR-based copy number ratio measurements.
While RT-qPCR is recognised as a gold standard for validation of gene expression platforms [42], this study provides evidence that the high accuracy, precision and robustness of dPCR for quantification of DNA can be translated to measurements of mRNA. While RT-qPCR and -dPCR methodologies targeted specific regions of a transcript, results using RNA-Seq provided complementary information on copy number differences for the full length of the transcript and highlighted that controlling for technical biases is required in order to improve the accuracy of this technique. As the study materials were composed of purified RNA, the study did not incorporate RNA purification from biological matrices. Sources of pre-analytical variation undoubtedly contribute significantly to variability in a complete methodological workflow [43], [44], [45], [46], therefore, future studies are required to assess the impact of pre-analytical factors on measurements of RNA biomarkers. Development of the capabilities of NMI and reference laboratories to perform independent certification of reference materials and internal controls for gene expression tests will enable verification of the analytical validity of molecular tests for cancer prognosis and personalised prediction of treatment efficacy [9] and support regulation of novel in vitro diagnostic devices [47].
Conflict of interest
None.
Acknowledgement
The work described in this paper was funded in part by the UK National Measurement System.
Handled by Jim Huggett
Footnotes
Abbreviations: cancer susceptibility candidate 3 (CASC3), Consultative Committee for Amount of Substance (CCQM), decimal places (d.p.), droplet-dPCR (ddPCR), External RNA Controls Consortium (ERCC), gene of interest (GOI), hypoxanthine guanine phosphoribosyltransferase 1 (HPRT1), long-term stability (LTS), matrix metallopeptidase 1 (MMP1), measurement uncertainty (MU), median absolute deviation (MAD), National Institute of Standards (NIST), National Measurement Institute (NMI), nestin (NES), next generation sequencing (NGS), quantification cycle (Cq), relative quantification (RQ), relative standard deviation (RSD), reverse transcription-digital polymerase chain reaction (RT-dPCR), reverse transcription-quantitative polymerase chain reaction (RT-qPCR), RNA integrity number (RIN), short-term stability (STS), significant figures (s.f.), solute carrier family 1 (glial high affinity glutamate transporter) member 3 (SLC1A3), standard curve (SC), ubiquitin C (UBC), Unknown 1 (U1), Unknown 2 (U2).
Supplementary data associated with this article can be found, in the online version, at http://dx.doi.org/10.1016/j.bdq.2016.05.003.
Appendix A. Supplementary data
The following are Supplementary data to this article:
References
- 1.Baker S.C. The external RNA controls consortium: a progress report. Nat. Methods. 2005;2(10):731–734. doi: 10.1038/nmeth1005-731. [DOI] [PubMed] [Google Scholar]
- 2.External RNA Controls Consortium Proposed methods for testing and selecting the ERCC external RNA controls. BMC Genomics. 2005;6:150. doi: 10.1186/1471-2164-6-150. [DOI] [PMC free article] [PubMed] [Google Scholar]
- 3.Devonshire A.S., Elaswarapu R., Foy C.A. Evaluation of external RNA controls for the standardisation of gene expression biomarker measurements. BMC Genomics. 2010;11:662. doi: 10.1186/1471-2164-11-662. [DOI] [PMC free article] [PubMed] [Google Scholar]
- 4.Jiang L. Synthetic spike-in standards for RNA-seq experiments. Genome Res. 2011;21(9):1543–1551. doi: 10.1101/gr.121095.111. [DOI] [PMC free article] [PubMed] [Google Scholar]
- 5.Blomquist T.M. Targeted RNA-sequencing with competitive multiplex-PCR amplicon libraries. PLoS One. 2013;8(11):e79120. doi: 10.1371/journal.pone.0079120. [DOI] [PMC free article] [PubMed] [Google Scholar]
- 6.Ding B. Normalization and noise reduction for single cell RNA-seq experiments. Bioinformatics. 2015;31(13):2225–2227. doi: 10.1093/bioinformatics/btv122. [DOI] [PMC free article] [PubMed] [Google Scholar]
- 7.White H.E. Establishment and validation of analytical reference panels for the standardization of quantitative BCR-ABL1 measurements on the international scale. Clin. Chem. 2013;59(6):938–948. doi: 10.1373/clinchem.2012.196477. [DOI] [PubMed] [Google Scholar]
- 8.Kim C., Paik S. Gene-expression-based prognostic assays for breast cancer. Nat. Rev. Clin. Oncol. 2010;7(6):340–347. doi: 10.1038/nrclinonc.2010.61. [DOI] [PubMed] [Google Scholar]
- 9.Kos Z., Nielsen T. Developing a new generation of breast cancer clinical gene expression tests. Breast Cancer Res. 2014;16(4):103. doi: 10.1186/bcr3688. [DOI] [PMC free article] [PubMed] [Google Scholar]
- 10.Sveen A. Anticipating the clinical use of prognostic gene expression-based tests for colon cancer stage II and III: is godot finally arriving? Clin. Cancer Res. 2013;19(24):6669–6677. doi: 10.1158/1078-0432.CCR-13-1769. [DOI] [PubMed] [Google Scholar]
- 11.Herman L. Utility of a genomic-based: personalized medicine test in patients presenting with symptoms suggesting coronary artery disease. J. Am. Board Fam. Med. 2014;27(2):258–267. doi: 10.3122/jabfm.2014.02.130155. [DOI] [PubMed] [Google Scholar]
- 12.Wazir U., Mokbel K. Emerging gene-based prognostic tools in early breast cancer: first steps to personalised medicine. World J. Clin. Oncol. 2014;5(5):795–799. doi: 10.5306/wjco.v5.i5.795. [DOI] [PMC free article] [PubMed] [Google Scholar]
- 13.Denkert C. Decentral gene expression analysis for ER+/Her2- breast cancer: results of a proficiency testing program for the EndoPredict assay. Virchows Arch. 2012;460(3):251–259. doi: 10.1007/s00428-012-1204-4. [DOI] [PMC free article] [PubMed] [Google Scholar]
- 14.Livak K.J., Schmittgen T.D. Analysis of relative gene expression data using real-time quantitative PCR and the 2(-Delta Delta C(T)) method. Methods. 2001;25(4):402–408. doi: 10.1006/meth.2001.1262. [DOI] [PubMed] [Google Scholar]
- 15.Denkert C. Molecular pathology for breast cancer: importance of the gene expression profile. Pathologe. 2015;36(2):145–153. doi: 10.1007/s00292-015-0009-z. [DOI] [PubMed] [Google Scholar]
- 16.(JCGM), J.C.f.G.i.M., International Vocabulary of Metrology—Basic and General Concepts and Associated Terms (VIM 3rd edition), 2012.
- 17.ISO, ISO/WD 15193 In vitro diagnostic medical devices – measurement of quantities in samples of biological origin – presentation of reference measurement procedures (2005).
- 18.Joint Committee for Guides in Metrology (JCGM), Evaluation of measurement data—Guide to the expression of uncertainty in measurement JCGM 100, 2008 (2008).
- 19.Cronin M. Analytical validation of the oncotype DX genomic diagnostic test for recurrence prognosis and therapeutic response prediction in node-negative: estrogen receptor-positive breast cancer. Clin. Chem. 2007;53(6):1084–1091. doi: 10.1373/clinchem.2006.076497. [DOI] [PubMed] [Google Scholar]
- 20.Vogelstein B., Kinzler K.W. Digital PCR. Proc. Natl. Acad. Sci. U. S. A. 1999;96(16):9236–9241. doi: 10.1073/pnas.96.16.9236. [DOI] [PMC free article] [PubMed] [Google Scholar]
- 21.Sykes P.J. Quantitation of targets for PCR by use of limiting dilution. Biotechniques. 1992;13(3):444–449. [PubMed] [Google Scholar]
- 22.Warren L. Transcription factor profiling in individual hematopoietic progenitors by digital RT-PCR. Proc. Natl. Acad. Sci. U. S. A. 2006;103(47):17807–17812. doi: 10.1073/pnas.0608512103. [DOI] [PMC free article] [PubMed] [Google Scholar]
- 23.Beer N.R. On-chip: real-time, single-copy polymerase chain reaction in picoliter droplets. Anal. Chem. 2007;79(22):8471–8475. doi: 10.1021/ac701809w. [DOI] [PubMed] [Google Scholar]
- 24.Cloonan N. Stem cell transcriptome profiling via massive-scale mRNA sequencing. Nat. Methods. 2008;5(7):613–619. doi: 10.1038/nmeth.1223. [DOI] [PubMed] [Google Scholar]
- 25.R Core Team . R Foundation for Statistical Computing; Vienna, Austria: 2013. R: A Language and Environment for Statistical Computing.http://www.R-project.org/ [Google Scholar]
- 26.Fox J., Weisberg S. second ed. Sage; Thousand Oaks CA: 2011. An R Companion to Applied Regression. [Google Scholar]
- 27.J. Pinheiro et al., nlme: Linear and Nonlinear Mixed Effects Models. R package version 3.1-102 (2011).
- 28.Vandesompele J. Accurate normalization of real-time quantitative RT-PCR data by geometric averaging of multiple internal control genes. Genome Biol. 2002;3(7) doi: 10.1186/gb-2002-3-7-research0034. RESEARCH0034. [DOI] [PMC free article] [PubMed] [Google Scholar]
- 29.Staudte R.G., Sheather S.J. John Wiley and Sons; New York: 1990. Robust Estimation and Testing. [Google Scholar]
- 30.Analytical Methods Committee Robust statistics—how not to reject outliers, part 1, basic concepts. Analyst. 1989;114:1693–1698. [Google Scholar]
- 31.DerSimonian R., Laird N. Meta-analysis in clinical trials. Control Clin. Trials. 1986;7(3):177–188. doi: 10.1016/0197-2456(86)90046-2. [DOI] [PubMed] [Google Scholar]
- 32.Joint Committee for Guides in Metrology (JCGM/WG 1), Section 5.2 Correlated input quantities, in Evaluation of measurement data -Guide to the expression of uncertainty in measurement, JCGM, 100 (2008).
- 33.Pfaffl M.W. A new mathematical model for relative quantification in real-time RT-PCR. Nucleic Acids Res. 2001;29(9):e45. doi: 10.1093/nar/29.9.e45. [DOI] [PMC free article] [PubMed] [Google Scholar]
- 34.Devonshire A.S. Highly reproducible absolute quantification of mycobacterium tuberculosis complex by digital PCR. Anal. Chem. 2015;87(7):3706–3713. doi: 10.1021/ac5041617. [DOI] [PubMed] [Google Scholar]
- 35.Pinheiro L.B. Evaluation of a droplet digital polymerase chain reaction format for DNA copy number quantification. Anal. Chem. 2012;84(2):1003–1011. doi: 10.1021/ac202578x. [DOI] [PMC free article] [PubMed] [Google Scholar]
- 36.White H. A certified plasmid reference material for the standardisation of BCR-ABL1 mRNA quantification by real-time quantitative PCR. Leukemia. 2015;29(2):369–376. doi: 10.1038/leu.2014.217. [DOI] [PMC free article] [PubMed] [Google Scholar]
- 37.Bhat S. Single molecule detection in nanofluidic digital array enables accurate measurement of DNA copy number. Anal. Bioanal. Chem. 2009;394(2):457–467. doi: 10.1007/s00216-009-2729-5. [DOI] [PubMed] [Google Scholar]
- 38.Sanders R. Evaluation of digital PCR for absolute DNA quantification. Anal. Chem. 2011;83(17):6474–6484. doi: 10.1021/ac103230c. [DOI] [PubMed] [Google Scholar]
- 39.Hindson C.M. Absolute quantification by droplet digital PCR versus analog real-time PCR. Nat. Methods. 2013;10(10):1003–1005. doi: 10.1038/nmeth.2633. [DOI] [PMC free article] [PubMed] [Google Scholar]
- 40.Costa V. Uncovering the complexity of transcriptomes with RNA-Seq. J. Biomed. Biotechnol. 2010;2010:853916. doi: 10.1155/2010/853916. [DOI] [PMC free article] [PubMed] [Google Scholar]
- 41.Harati S., Phan J.H., Wang M.D. Investigation of factors affecting RNA-seq gene expression calls. Conf. Proc. IEEE Eng. Med. Biol. Soc. 2014;2014:5232–5235. doi: 10.1109/EMBC.2014.6944805. [DOI] [PMC free article] [PubMed] [Google Scholar]
- 42.The MicroArray Quality Control (MAQC) project shows inter- and intraplatform reproducibility of gene expression measurements. Nat. Biotechnol. 2006;24(9):1151–1161. doi: 10.1038/nbt1239. [DOI] [PMC free article] [PubMed] [Google Scholar]
- 43.Malentacchi F. SPIDIA-RNA: second external quality assessment for the pre-analytical phase of blood samples used for RNA based analyses. PLoS One. 2014;9(11):e112293. doi: 10.1371/journal.pone.0112293. [DOI] [PMC free article] [PubMed] [Google Scholar]
- 44.Pazzagli M. SPIDIA-RNA: first external quality assessment for the pre-analytical phase of blood samples used for RNA based analyses. Methods. 2013;59(1):20–31. doi: 10.1016/j.ymeth.2012.10.007. [DOI] [PubMed] [Google Scholar]
- 45.Ramsden S.C. EQUAL-quant: an international external quality assessment scheme for real-time PCR. Clin. Chem. 2006;52(8):1584–1591. doi: 10.1373/clinchem.2005.066019. [DOI] [PubMed] [Google Scholar]
- 46.Tichopad A. Design and optimization of reverse-transcription quantitative PCR experiments. Clin. Chem. 2009;55(10):1816–1823. doi: 10.1373/clinchem.2009.126201. [DOI] [PubMed] [Google Scholar]
- 47.NICE . 2013. NICE guidance recommends new test to guide breast cancer treatment decisions.http://www.nice.org.uk/newsroom/pressreleases/NICERecommendsTestBreastCancerTreatmentDecisions.jsp [Google Scholar]
Associated Data
This section collects any data citations, data availability statements, or supplementary materials included in this article.