Abstract
Objectives:
The present study was conducted with the aim to compare the sodium (Na) and potassium (K) results on arterial blood gas (ABG) and electrolyte analyzers both of which use direct ion selective electrode technology.
Materials and Methods:
This was a retrospective study in which data were collected for simultaneous ABG and serum electrolyte samples of a patient received in Biochemistry Laboratory during February to May 2015. The ABG samples received in heparinized syringes were processed on Radiometer ABL80 analyzer immediately. Electrolytes in serum sample were measured on ST-100 Sensa Core analyzer after centrifugation. Data were collected for 112 samples and analyzed with the help of Excel 2010 and Statistical software for Microsoft excel XLSTAT 2015 software.
Results:
The mean Na level in serum sample was 139.4 ± 8.2 mmol/L compared to 137.8 ± 10.5 mmol/L in ABG (P < 0.05). The mean difference between the results was 1.6 mmol/L. Mean K level in serum sample was 3.8 ± 0.9 mmol/L as compared to 3.7 ± 0.9 mmol/L in ABG sample (P < 0.05). The mean difference between the results was 0.14 mmol/L. Statistically significant difference was observed in results of two instruments in low Na (<135 mmol/L) and normal K (3.5-5.2 mmol/L) ranges. The 95% limit of agreement for Na and K on both instruments was 9.9 to −13.2 mmol/L and 0.79 to −1.07 mmol/L respectively.
Conclusions:
The clinicians should be cautious in using the electrolyte results of electrolyte and ABG analyzer in inter exchangeable manner.
Keywords: Arterial blood gas analyzer, direct ion selective electrode, electrolyte analyzer, electrolytes
Introduction
Electrolytes are measured in the clinical laboratories In both serum and whole blood sample received for arterial blood gas (ABG) analysis. Although the routine practice is to measure electrolytes in serum, it takes relatively more time due to requirement of separation of serum. Emergency and critical care physicians prefer measurement of electrolytes along with blood gas analysis, which helps them in diagnosis and monitoring of electrolyte imbalance in a short turnaround time. It can play vital role in timely patient management by saving precious minutes.
Ion selective electrodes (ISEs) are the most routinely used method for electrolytes estimation in clinical laboratories. There are two types of ISE measurements based on sample preparation. Devices based on direct measurement provide an undiluted sample to interact with ISE membrane.[1] These direct ISE based devices are typical of point of care testing analyzers, both bench top and portable.[2] The devices based on indirect ISE use preanalytic dilution and are often employed in high throughput central laboratory running automated analyzer.[3]
There is no consensus on inter exchangeability of results of these analyzers as studies using different devices have reported different results.[2,3,4,5,6] It is, therefore, important to determine the concordance of electrolyte values obtained by ABG and serum sample for each hospital as analyzer type and calibration methods may differ among different laboratories.[3] Moreover, there is paucity of literature comparing the results of electrolytes in an arterial sample processed on ABG analyzer and serum sample processed on a bench top electrolyte analyzer both of which use direct ISE method without any need of predilution of sample.
The present study was planned with the objective to investigate whether electrolyte levels assessed using ABG analyzer and electrolyte analyzer were equivalent. Data on sodium (Na+) and potassium (K+) ion concentrations were examined on whole blood arterial, and serum samples received simultaneously in laboratory.
Materials and Methods
This was a retrospective observational study conducted for the period February to May 2015 in the Biochemistry Laboratory of a tertiary care hospital. The study was approved by Institutional Ethical Committee (Gian Sagar Medical College and Hospital, Punjab, India). A record of simultaneous ABG and serum electrolytes samples of a patient received in the laboratory was collected. The samples received from emergency and Intensive Care Units (ICU) were included in the study. The samples from pediatric and neonatal ICUs were excluded from the data. The serum sample was obtained by withdrawing 3 ml of venous blood in BD plain vacutainer (Becton Dickinson and Company, Franklin Lakes, USA) under aseptic conditions. The arterial sample was collected in a 2 ml Dispovan syringe (Hindustan Syringes and Medical Devices, Ballabgarh, India) under sterile environment using standard sampling protocol. The syringe was flushed thoroughly with 1 ml solution of liquid heparin (Zydus Cadila Healthcare Limited, Gujarat, India) which was removed completely before drawing of the sample. Quality control was ensured by having the blood samples collected by trained staff of emergency and ICU in the hospital and analyzed on two analyzers located in the central laboratory under similar environmental conditions. ABG samples received in heparinized syringes were processed on Radiometer ABL 80 analyzer (Diamond Diagnostics, USA) immediately for electrolytes along with blood gases.
The samples received in BD vacutainer for serum were centrifuged within 20-30 min after clotting of blood. Electrolytes were measured on ST 100 electrolyte analyzer (Sensacore medical Instrumentation Pvt Ltd, India). Both these instruments work on the principle of direct ISE technology. The inter instrument comparison of electrolytes done on 30 serum samples in February 2015 had produced comparable results. The mean bias was 0.5 mmol/L and 0.01 mmol/L for Na+ and K+ respectively on Radiometer analyzer as compared to Sensa Core electrolyte analyzer. The internal quality control was run daily on both the instruments during the study period. The mean Na was 123.5 mmol/L and 147.1 mmol/L for the concentration of 124 mmol/L (112-136 mmol/L) and 148 mmol/L (133-163 mmol/L) respectively on electrolyte analyzer and 122.9 mmol/L and 146.7 mmol/L on ABG analyzer. The mean K was 3.5 mmol/L and 6.7 mmol/L for concentrations of 3.68 mmol/L (3.22-4.04 mmol/L) and 6.85 (6.17-7.53) mmol/L, respectively, on electrolyte analyzer and 3.5mmol/L and 6.72 mmol/L on ABG analyzer. The measurement uncertainty of Sensa Core electrolyte analyzer was 1.9 mmol/L and 0.16 mmol/L for Na+ and K+, respectively. The measurement uncertainty values were 2.3 mmol/L and 0.25 mmol/L, respectively, for Na+ and K+ for ABG analyzer.
The reference ranges for Na+ and K+ were 135-145 mmol/L and 3.5-5.2 mmol/L, respectively. Data were rearranged as low, normal, and high according to the reference range and comparison of results was done on both the analyzers.
Statistical analysis
A total of 112 simultaneous ABG and serum samples were received during the study period. The data were collected and arranged in tables using Microsoft Excel 2010. Mean, standard deviation and two-tailed P value was calculated. P < 0.05 was considered statistically significant. Bland-Altman plots were used for inter instrument comparison of results.
Results
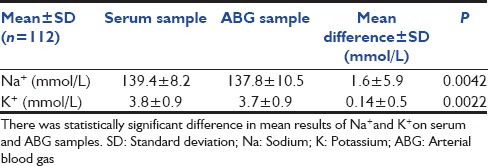
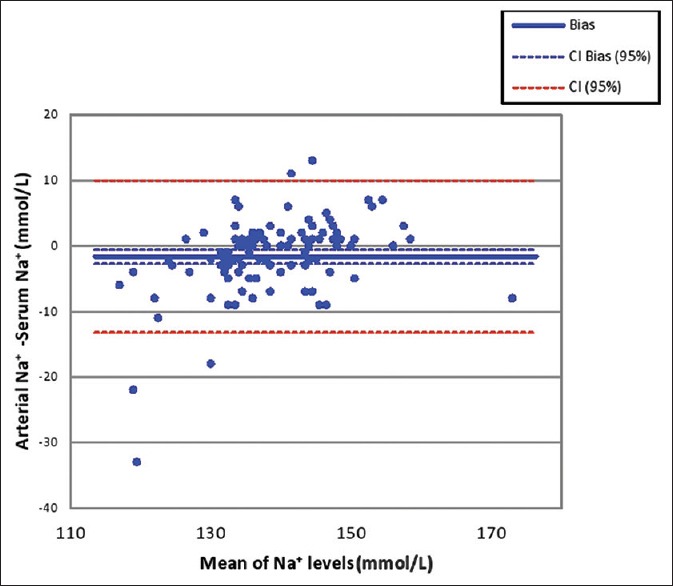
The mean age of the patients was 49.5 years. There were 86 male and 26 female patients in the study. The mean level of Na in serum samples was 139.4 ± 8.2 mmol/L compared to137.8 ± 1 0.5 mmol/L in ABG (P < 0.05) [Table 1]. The mean difference among the results was 1.6 mmol/L showing a negative bias in arterial sample. Wide variations in Na results among individual samples were observed which ranged from 13 to −33 mmol/L [Figure 1]. There were 75 samples with variation up to 4 mmol/L which is acceptable limit for Na+ as per Clinical Laboratories Improvement Amendment (CLIA) guidelines.[7]
Table 1.
Comparison of results in arterial and serum samples

Figure 1.

Bland–Altman plot for Na+ results in serum and arterial sample. The bias in arterial Na+ measurement is −1.63 mmol/L. The 95% limit of agreement is 9.9 to −13.2 mmol/L. Na: Sodium
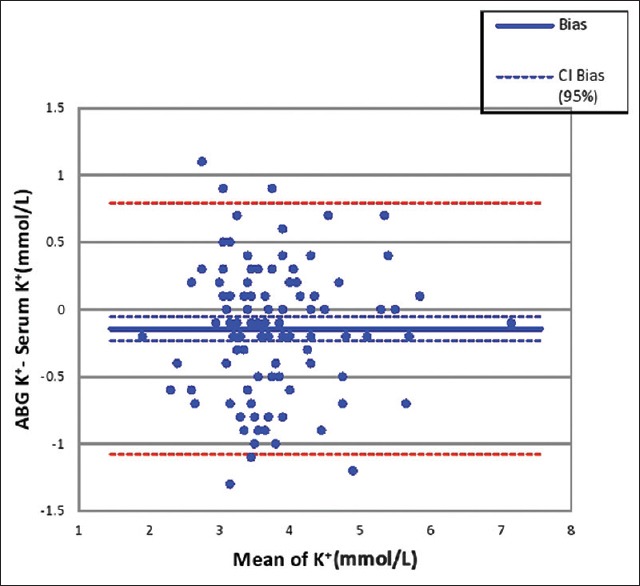
Mean K in serum sample was 3.8 ± 0.9 mmol/L as compared to 3.7 ± 0.9 mmol/L in ABG sample (P < 0.05) [Table 1]. The mean difference was 0.14 mmol/L and ranged from − 1.1 to 1.3 mmol/L [Figure 2]. There were 72 samples in the study with acceptable variation of up to 0.5 mmol/L as per CLIA recommendations for K.
Figure 2.

Bland-Altman plot for K+ results in serum and arterial sample. The bias in arterial K+ measurement is −0.14 mmol/L. The 95% limit of agreement is 0.79 to −1.07 mmol/L. K: Potassium
There was statistically significant difference in results among two instruments in low range of Na+ (<135 mmol/L) and normal K+ values (3.5-5.5 mmol/L) [Table 2].
Table 2.
Comparison of results in low, normal and high range of sodium and potassium

Discussion
Electrolyte abnormalities are one of the common reversible causes of morbidity and mortality in patients admitted in ICUs. The levels of electrolytes need to be monitored on regular basis in these patients which are ordered in ABG or serum sample as per the convenience of sampling and requirement. The results of both types of measurement are used in inter exchangeable manner with the assumption that they are equivalent. Na and K levels measured in whole blood and plasma have been shown to be essentially same[8] though release of K from platelets during clotting may cause statistically insignificant increase of levels in serum.[5]
The most important factor which leads to difference in the results of Na+ on ABG and laboratory autoanalyzer is predilution of sample in latter. The studies have reported statistically significantly higher results with indirect ISE based laboratory auto analyzers as compared to ABG analyzer.[2,3,4,9,10,11,12] This overestimation is clearly linked to serum protein and albumin levels. Story et al. have reported that indirect ISE leads to overestimation of Na in hypoalbuminemia. The difference between direct and indirect ISE results was found to correlate with serum albumin and total protein concentrations.[9,13]
The use of different techniques was not a limitation in the present study as we compared results of two instruments using direct ISE method. We found statistically significant difference in mean values for Na+ results with a negative bias of 1.63 mmol/L in arterial sample. The bias for Na+ was reported to be 4.9 and 5.96 mmol/L, respectively, in other studies which is higher than the acceptable limit of 4 mmol/L.[3,4] Another study comparing the result of two direct ISE based instruments has reported the mean difference in Na results as 3 mmol/L and found the correlation coefficient of 0.787.[6] In the present study, both instruments had acceptable Spearman's correlation coefficient of rs = 0.846 for Na but the Bland-Altman plot shows the inter analyzer agreement unacceptable with limit of agreement of 9.9 to −13.2 mmol/L [Figure 1].
Analysis of two instruments’ results only by mean difference and correlation coefficient can be misleading due to wide individual sample variation. The study by Nanda et al. seems to be flawed on this account.[6] Method comparison by mean versus difference plot helps to understand the comparison of results better. King et al. point toward this important observation. They compared two Radiometer ABG analyzers with laboratory auto analyzer for electrolytes. The mean difference in Na+ results was 1.7 mmol/L but the limit of agreement was −2.9 to 6.4 mmol/L. They suggest that though the mean difference is small, but the wide limit of agreement indicate that the individual sample differences may be large.[14]
The mean between assay differences for K+ was 0.16 mmol/L with the 95% limit of agreement 0.79 to −1.07 mmol/L in the present study. Bias of more than 0.5 mmol/L was observed in 36% of samples. Budak et al. have reported the mean difference of 0.25mmol/L with the bias in the range of 0.15-0.35 in their study. They found 15% of samples with difference of more than 0.5 mmol/L and did not find the results to be equivalent on two instruments.[3] Similar conclusion was drawn by Razavi et al. and Chhapola et al.[11,12] Some other studies have reported the equivalence of results between ABG analyzer and auto analyzer.[4,5,15] Flegar-Mestric and Perkov who otherwise found the results equivalent have observed that in spite of a good correlation between the assays, the constant analytical errors and proportional differences between the methods indicate that two different technologies were used.[5]
Many factors may be responsible for the observed difference in Na and K results on ABG analyzer and electrolyte analyzer. Electrolytes results on ABG can be significantly affected by preanalytical variables such as hemolysis (especially K concentrations), fibrin clots within the specimen, inadequate mixing of the specimen with anticoagulant and varying the ratio of blood sample to anticoagulant. Other possible reasons could be use of conventional syringes flushed with liquid heparin which could lead to dilution of sample volume and thus underestimation of electrolytes on ABG.[4,12] It has also been reported that the use of different types of heparin in blood gas syringes can introduce a preanalytical bias in electrolyte concentrations. Heparin itself binds the positively charged ions and can introduce different negative biases when the levels of electrolytes are measured.[3,16]
Errors in sampling technique can lead to dilution and centrifugation of samples before proper clot formation can lead to hemolysis in serum sample affecting the results of electrolytes. We did not have any control over these preanalytical variables though these errors seem unlikely as the samples were drawn by well-trained ICU staff following the standard sampling protocol. The use of different instruments with different electrodes and difference in use of calibrators could also be responsible for the observed difference in results.[12] It is known that ISE-based instruments from different manufactures yield Na+ and K+ results that differ by 2-5%.[3] Since it is a retrospective study, we are unable to correlate the results with the clinical course of patient and thus cannot comment that results of which analyzer represent it. This is another limitation of this study.
Conclusions
We conclude that the results of electrolytes on ABG and electrolyte analyzer cannot be used in inter-exchangeable manner and should be interpreted with caution. We would like to emphasize that the results obtained are specific to the instruments used. The use of dried heparin syringes may lead to better equivalence of results.
Financial support and sponsorship
Nil.
Conflicts of interest
There are no conflicts of interest
References
- 1.Polandic JE. Electrolytes. In: Bishop ML, Fody EP, Schoeff LE, editors. Clinical Chemistry Techniques, Principles and Correlation. 6th ed. New Delhi: Wolters Kluwer; 2012. pp. 357–83. [Google Scholar]
- 2.Dimeski G, Morgan TJ, Presneill JJ, Venkatesh B. Disagreement between ion selective electrode direct and indirect sodium measurements: Estimation of the problem in a tertiary referral hospital. J Crit Care. 2012;27:326.e9–16. doi: 10.1016/j.jcrc.2011.11.003. [DOI] [PubMed] [Google Scholar]
- 3.Budak YU, Huysal K, Polat M. Use of a blood gas analyzer and a laboratory autoanalyzer in routine practice to measure electrolytes in intensive care unit patients. BMC Anesthesiol. 2012;12:17. doi: 10.1186/1471-2253-12-17. [DOI] [PMC free article] [PubMed] [Google Scholar]
- 4.Jain A, Subhan I, Joshi M. Comparison of the point-of-care blood gas analyzer versus the laboratory auto-analyzer for the measurement of electrolytes. Int J Emerg Med. 2009;2:117–20. doi: 10.1007/s12245-009-0091-1. [DOI] [PMC free article] [PubMed] [Google Scholar]
- 5.Flegar-Mestric Z, Perkov S. Comparability of point-of-care whole-blood electrolyte and substrate testing using a stat profile critical care xpress analyzer and standard laboratory methods. Clin Chem Lab Med. 2006;44:898–903. doi: 10.1515/CCLM.2006.148. [DOI] [PubMed] [Google Scholar]
- 6.Nanda SK, Ray L, Dinakaran A. Agreement of arterial sodium and arterial potassium levels with venous sodium and venous potassium in patients admitted to intensive care unit. J Clin Diagn Res. 2015;9:BC28–30. doi: 10.7860/JCDR/2015/12418.5602. [DOI] [PMC free article] [PubMed] [Google Scholar]
- 7.Medicare, Medicaid and CLIA programs; regulations implementing the clinical laboratory improvement amendments of 1988 (CLIA) - HCFA. Final rule with comment period. Fed Regist. 1992;57:7002–186. [PubMed] [Google Scholar]
- 8.Ladenson JH. Direct potentiometric measurement of sodium and potassium in whole blood. Clin Chem. 1977;23:1912–6. [PubMed] [Google Scholar]
- 9.Story DA, Morimatsu H, Egi M, Bellomo R. The effect of albumin concentration on plasma sodium and chloride measurements in critically ill patients. Anesth Analg. 2007;104:893–7. doi: 10.1213/01.ane.0000258015.87381.61. [DOI] [PubMed] [Google Scholar]
- 10.Chacko B, Peter JV, Patole S, Fleming JJ, Selvakumar R. Electrolytes assessed by point-of-care testing - Are the values comparable with results obtained from the central laboratory? Indian J Crit Care Med. 2011;15:24–9. doi: 10.4103/0972-5229.78219. [DOI] [PMC free article] [PubMed] [Google Scholar]
- 11.Razavi S, Jafari A, Zaker H, Sadeghi A. Plasma and serum electrolytes levels correlation in the pediatric ICU. Tanaffos. 2010;9:34–8. [Google Scholar]
- 12.Chhapola V, Kanwal SK, Sharma R, Kumar V. A comparative study on reliability of point of care sodium and potassium estimation in a pediatric intensive care unit. Indian J Pediatr. 2013;80:731–5. doi: 10.1007/s12098-013-0977-z. [DOI] [PubMed] [Google Scholar]
- 13.Chow E, Fox N, Gama R. Effect of low serum total protein on sodium and potassium measurement by ion-selective electrodes in critically ill patients. Br J Biomed Sci. 2008;65:128–31. doi: 10.1080/09674845.2008.11732815. [DOI] [PubMed] [Google Scholar]
- 14.King R, Campbell A. Performance of the radiometer OSM3 and ABL505 blood gas analysers for determination of sodium, potassium and haemoglobin concentrations. Anaesthesia. 2000;55:65–9. doi: 10.1046/j.1365-2044.2000.01166.x. [DOI] [PubMed] [Google Scholar]
- 15.Wongyingsinn M, Suksuriyayothin S. Use of rapid ABG analyzer in measurement of potassium concentration: Does it agree with venous potassium concentration? J Med Assoc Thai. 2009;92:925–9. [PubMed] [Google Scholar]
- 16.van Berkel M, Scharnhorst V. Electrolyte-balanced heparin in blood gas syringes can introduce a significant bias in the measurement of positively charged electrolytes. Clin Chem Lab Med. 2011;49:249–52. doi: 10.1515/CCLM.2011.047. [DOI] [PubMed] [Google Scholar]


