Abstract
Clinical symptoms often reflect molecular correlations between mutated proteins. Alignment between interactome and phenome levels reveals new disease genes and connections between previously unrelated diseases. Despite a great potential for novel discoveries, this approach is still rarely used in genomics. In the present study, we analyzed the data of 6 syndromes belonging to the RASopathy class of disorders (RASopathies) and presented them as a model to study associations between genome, interactome, and phenome levels. Causative genes and clinical symptoms were collected from OMIM and NCBI GeneReviews databases for 6 syndromes: Noonan, Noonan syndrome with multiple lentigines, neurofibromatosis type 1, cardiofaciocutaneous, and Legius and Costello syndrome. The STRING tool was used for the identification of protein interactions. Six RASopathy syndromes were found to be associated with 12 causative genes. We constructed an interactome of RASopathy proteins and their neighbors and developed a database of 328 clinical symptoms. The collected data was presented at genome, interactome, and phenome levels and as an integrated network of all 3 data types. The present study provides a baseline for future studies of associations between interactome and phenome in RASopathies and could serve as a novel approach to analyze phenotypically and genetically related diseases.
Keywords: Gene network, Genetic diseases, Interactome, Noonan syndrome, Phenome, RASopathies
It has previously been shown that a phenotypic overlap indicates a genotypic overlap [Oti and Brunner, 2007; Oti et al., 2008; Wu et al., 2009]. A phenotypic or phenome overlap represents the occurrence of similar symptoms with different diseases. Based on the co-occurrence of those similar symptoms, the syndromes can be grouped to form a disease network or phenome [van Driel et al., 2006; Barabási, 2007]. A gene network is a group of functionally related genes leading to similar phenotypes when mutated [Oti and Brunner, 2007; Oti et al., 2008]. Genes can be united based on interactions of their protein products, gene ontology, shared molecular pathways, co-expression, sequence similarity, or shared protein domains [Oti et al., 2008]. This principle of aligning interactome to phenome can be applied to genetic disease research. It enables the identification of new genes and gene networks responsible for diseases [Oti and Brunner, 2007]. New candidate genes for diseases and associations between previously unrelated diseases could be discovered by investigating connections between the genome and phenome of a disease, since genes that are linked by physical interactions among their protein products contribute to the same phenome, causing the same syndrome [Wu et al., 2009]. The final objective in this research area is the construction of a complex interactomic map, connecting all the diseases on interactome and genome levels and explaining their relationship [Oti and Brunner, 2007]. The same approach has also been applied in the Diseasome project [Goh et al., 2007].
Clinical symptoms and genetic background of the RASopathy class of developmental disorders (RASopathies) represent a model for studying associations between interactome and phenome, since individual syndromes have been well described [Tidyman and Rauen, 2009; Digilio et al., 2011; Tartaglia and Gelb, 2010; Tartaglia et al., 2010]. Additionally, co-presence of symptoms in a syndrome could be explained using systems biology approach; molecular mechanisms underlying co-occurrence of cryptorchidism (undescended testicles) and cardiovascular diseases in RASopathies have been described in our previous study [Cannistraci et al., 2013].
Diseases belonging to the RASopathy syndrome family are a result of mutations in genes of the RAS/MAPK pathway. RAS stands for rat sarcoma, the name reflects the way the RAS protein family was discovered, and MAPK stands for miogen-activated protein kinase, explaining the types of proteins participating in the pathway [Tartaglia et al., 2010; Hernández-Martín and Torrelo, 2011]. The RAS/MAPK pathway is a crucial protein cascade for the transmission of signals and cell communication. Genes for cell proliferation, differentiation, survival, migration, and senescence are activated when a signal from extracellular receptors reaches the nucleus [Tartaglia and Gelb, 2010; Hernández-Martín and Torrelo, 2011]. Due to different mutations in genes of the RAS molecular regulatory pathway, compromised individuals develop different clinical symptoms, belonging to the syndromes of the RASopathy syndrome family, including: Noonan syndrome, Noonan syndrome with multiple lentigines (i.e. LEOPARD syndrome), neurofibromatosis type 1 (NF1), Legius syndrome, Costello syndrome, cardiofaciocutaneous syndrome (CFC), autoimmune lymphoproliferative syndrome, hereditary gingival fibromatosis type 1, and capillary malformation-arteriovenous malformation [Tidyman and Rauen, 2009].
Even though clinical symptoms of RASopathies are well described, molecular mechanisms responsible for the development of symptoms are much less researched. We chose 6 RASopathy syndromes for the analysis in the present study: Noonan, Noonan with multiple lentigines, Legius, NF1, CFC, and Costello. The aim of the study was (1) to collect genomics and phenomics data related to RASopathies; (2) to perform protein-interaction analysis and sort information according to different omics levels: genome, interactome, and phenome, and (3) to present the data as an integrated network of all 3 levels.
Materials and Methods
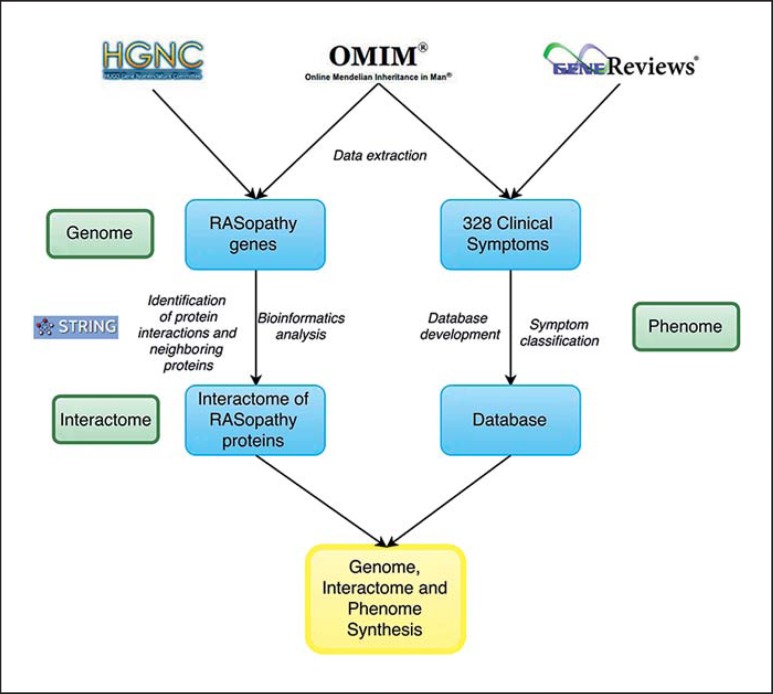
The workflow of the study and methodology is presented in figure 1. Information regarding causative genes and clinical symptoms was collected from OMIM (http://www.ncbi.nlm.nih.gov/omim) and NCBI GeneReviews (http://www.ncbi.nlm.nih.gov/books/NBK1116/) databases for 6 chosen syndromes belonging to the RASopathies: Noonan, Noonan with multiple lentigines, Legius, NF1, CFC, and Costello. Genes responsible for RASopathies were further analyzed. Gene names were unified according to the HGNC database (http://www.genenames.org/). Genomic location of RASopathy genes was found using the Genome Viewer tool (http://rgd.mcw.edu/rgdweb/gTool/Gviewer.jsp). We employed the STRING tool (Search Tool for the Retrieval of Interacting Genes/Proteins; http://string-db.org/) to identify the interactions between protein products of causative genes and the protein neighbors in the interactome. Associations between proteins in the STRING database were integrated from various sources: experimentally validated physical interactions, information of shared biochemical pathways, text mining to discover statistical links, computational predictions of interactions, and information from evolutionary close organisms [Szklarczyk et al., 2015]. Data related to clinical symptoms of the 6 chosen RASopathy syndromes was collected, and a database of clinical symptoms of RASopathies was developed. Clinical signs were sorted into categories according to organ systems and affected body parts.
Fig. 1.
Workflow of the study. Information regarding RASopathies was collected at 3 levels: genome, interactome, and phenome (for closer information, see text).
Results
Six syndromes belonging to RASopathies were examined at genome, interactome, and phenome levels. Available information on genomic (causative genes) and phenomic (clinical symptoms) levels was collected and integrated. We compiled an interactomic overview of the RASopathy proteins (protein interactions between causative and neighboring proteins) and an extensive database of the RASopathy clinical signs. The relationship between genome and syndromes, and genome and interactome is presented.
Genome Level
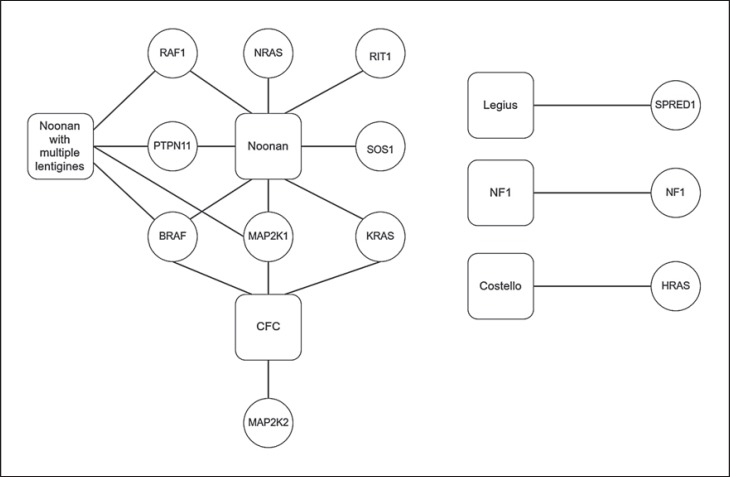
Genomics databases were examined to collect causative genes for RASopathies. Twelve genes were found to be associated with at least one of the examined syndromes, as assembled in the gene map in figure 2. Some syndromes are associated with one causative gene, while other genes and syndromes have several associations. For instance, the SPRED1 gene is only associated with Legius syndrome, while the BRAF gene is associated with 3 syndromes: Noonan, Noonan with multiple lentigines, and CFC (fig. 3).
Fig. 2.
Genomic location of 12 causative genes associated with 6 RASopathies.
Fig. 3.
Associations between 6 syndromes (square nodes) of the RASopathy syndrome family and 12 causative genes (circular nodes). The complex relationship between syndromes and genes is shown. Some syndromes are associated with a mutation of a single gene (Legius, NF1, and Costello), while other syndromes (Noonan, CFC, and Noonan with multiple lentigines) involve multiple genes that can be mutated in a single patient.
Interactome Level
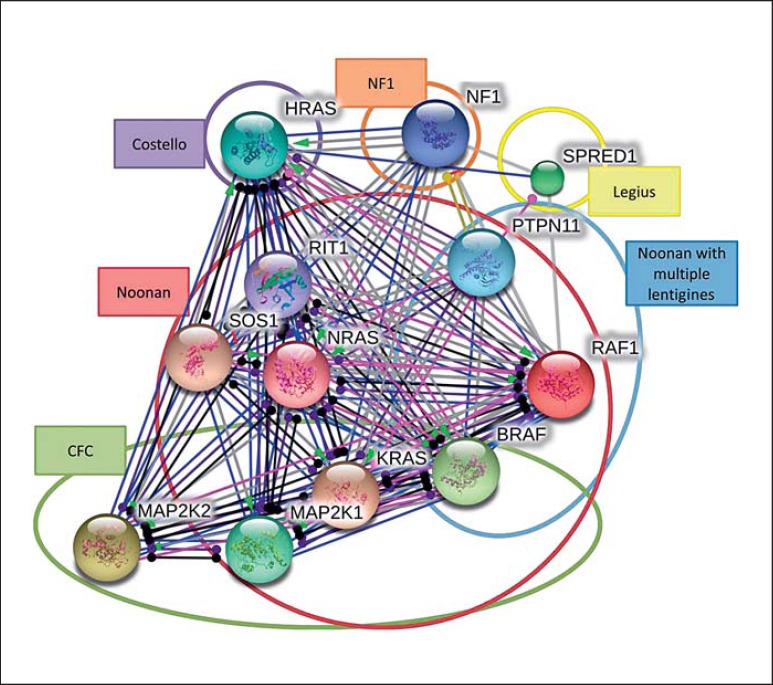
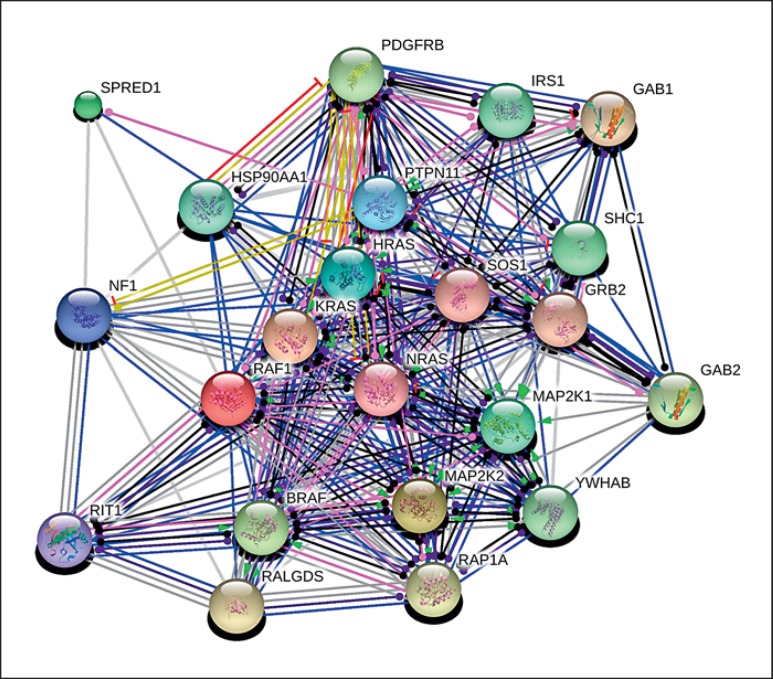
An analysis of protein interactions was performed using RASopathy associated genes. We created an interactomic network based on interactions among proteins: BRAF, HRAS, KRAS, MAP2K1, MAP2K2, NRAS, PTPN11, RAF1, SOS1, SPRED1, NF1, and RIT1. The interactions are presented as links between 2 proteins and are described as: activation (upregulation), inhibition (downregulation), binding, catalysis, post-translational modifications, reaction, and expression (fig. 4). Pairwise interactions between the causative proteins are shown in detail in online supplementary table 1 (see www.karger.com/doi/10.1159/000445733, for all online suppl. material). We expanded the original interactome network by adding the first-level protein neighbors. We searched for the proteins that are associated with RASopathy proteins at interactome level, using the same criteria as for the interactions between RASopathy proteins. As shown in figure 5, ten proteins have been found to be connected with the causative proteins. GRB2, GAB1, RALGDS, RAP1A, GAB2, PDGFRB, YWHAB, SHC1, IRS1, and HSO90AA1.
Fig. 4.
Interactions between 12 proteins of the RASopathies (PTPN11, SOS1, RAF1, BRAF, KRAS, NRAS, HRAS, MAP2K1, MAP2K2, SPRED1, NF1, and RIT1) associated with 6 RASopathy syndromes. Figure colors represent the following: black = reaction; blue = binding; green = activation; light green = expression; pink = post-translational modification; red = inhibition; violet = catalysis.
Fig. 5.
Interactions between 12 proteins associated with RASopathies (PTPN11, SOS1, RAF1, BRAF, KRAS, NRAS, HRAS, MAP2K1, MAP2K2, SPRED1, NF1, and RIT1) and 10 first neighbors in interactome (GRB2, GAB1, RALGDS, RAP1A, GAB2, PDGFRB, YWHAB, SHC1, IRS1, and HSO90AA1). The nodes represent proteins and the lines represent the relations between them. The colors of the lines and the arrows show different types of interactions among the proteins. For color legend see figure 4.
Phenome Level
A database of clinical symptoms of 6 RASopathies has been developed (online suppl. table 2). We searched the literature, extracted data, and collected 328 diverse clinical signs and symptoms for the chosen syndromes. The symptoms were edited to avoid duplications. The database was divided into 10 categories and 10 subcategories, according to organic systems or affected body parts: cardiovascular system, hematologic system, lymphatic system, gastrointestinal system, genitourinary system, neurological system, mental development, prenatal development, physical development (musculoskeletal system, puberty, body and limbs, head, hair, eyes, nose, ears and hearing, mouth and voice, and skin), and the tendency for developing tumors. The database was then analyzed to compare the frequency of the clinical symptoms with different syndromes. The study revealed several characteristics, which are common to all 6 analyzed syndromes: craniofacial abnormalities, cardiac abnormalities, skin abnormalities, and an increased risk for the development of tumors.
Integrated Network of 3 Omics Levels: Genomics, Interactomics, and Phenomics
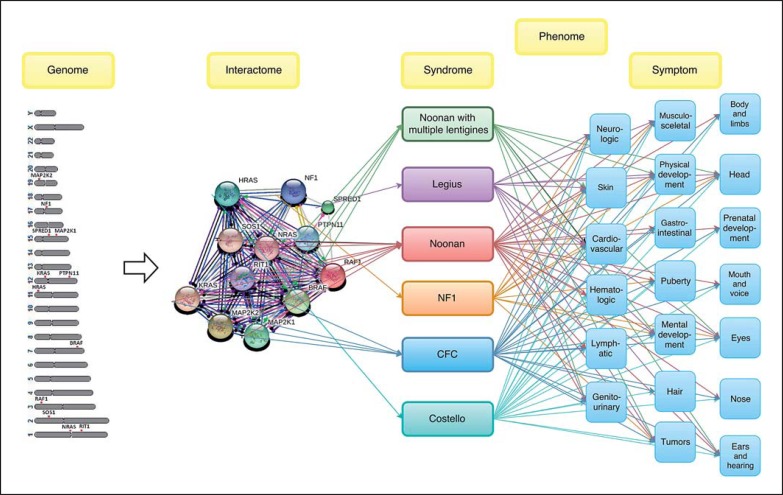
In our final step, relations between different omics levels were depicted (fig. 6). The first level represents a human genomic map of locations of 12 RASopathy genes. The interactome connects causative genes with symptoms of the syndromes at the phenomic level. The data synthesis presents an integrated network of 3 omics types, associated with RASopathies at the genomic, interactomic, and phenomic levels and reveals their interactions.
Fig. 6.
Associations between genome, interactome, and phenome in RASopathies.
Discussion
In the present study, we focused on 6 syndromes belonging to RASopathies as a model to present associations between genome, interactome, and phenome levels. The genetic location of 12 causative genes of 6 RASopathies was composed in a genetic map. Furthermore, the types of interactions between protein products of mutated genes at the interactome level were shown. A network of causative proteins of RASopathies was extended by adding their closest protein neighbors, which represent candidate genes for further studies of other phenotypically and genetically related diseases because it has been suggested previously that close neighbors in an interactome could represent possible candidate genes for associated diseases and symptoms [Oti and Brunner, 2007].
Certain RASopathy syndromes are caused by only one mutated gene; however, some syndromes are associated with mutations in several genes (fig. 3). Studying the mutated proteins and their interactions could shed light on the differences in the severity of the phenotype between patients; it has been proposed that a joint presence of 2 or more mutations or copy number variations (CNVs) in a single biological pathway could lead to a more severe phenotype as a result of cumulative effects of both mutations or CNVs [Girirajan and Eichler, 2010; Poot et al., 2011]. Finally, data related to clinical symptoms of the 6 chosen RASopathies was collected, and a database of 328 clinical symptoms of RASopathies was developed. The database is most probably not complete; however, it is a baseline for further clinical studies and for adding data from upcoming publications.
It has previously been reported that gene/protein and phenotype networks could be assembled into an integrated network [Wu et al., 2009]. With this in mind, we developed a network for RASopathies. Collected information related to RASopathies is shown in figure 6, where the interactome level represents the protein network and the symptoms represent the phenome network of RASopathies. These levels provide information on known genotype-phenotype associations. This integrated network can now be extended by additional genomics and clinical data and enables testing potential novel genotype-phenotype associations. This genotype-phenotype alignment is a model for studying a modular view of genetic diseases and, as such, enables detecting novel genes responsible for diseases similar to RASopathies as well as the identification of associations between previously unrelated diseases. This network/modular approach of examining complex diseases was suggested previously by Barabási [2007] and Oti and Bunner [2007].
In recent years, large-scale studies evaluated a genetic overlap between distant genetic diseases, e.g. Rzhetsky et al. [2007], while others, e.g. van Driel et al. [2006], evaluated a phenotypic overlap between genetic diseases. Some evidence suggests that human genetic diseases are organized in a modular landscape [Oti and Brunner, 2007]. Therefore, interactions between interactome and phenome have been extensively studied, mainly to develop a bioinformatics tool to predict novel candidate genes from correlations between interactome and phenome [Wu et al., 2008, 2009; Chen et al., 2013]. However, these studies primarily focus on common genetic diseases, such as diabetes and Crohn's disease. Even though the disorders of the RASopathy syndrome family have been broadly studied, e.g. by Aoki and Matsubara [2013], Tartaglia and Gelb [2010], and Tidyman and Rauen [2009], to our knowledge the present study is the first that investigates the interactions among the different omics levels in RASopathies. Additionally, Kiel and Serrano [2014] extended our understanding of the molecular mechanisms underlying the differences in missense mutations of the same protein causing either cancer or RASopathies, using structure-energy-based predictions and network modeling.
The developed database gives an overview of the RASopathy disease family and allows easier distinction between different syndromes belonging to RASopathies. The results of this study contribute to better understand the molecular mechanisms of RASopathies and serve as a model to study interactions between interactome and phenome in other syndrome families. The Diseasome network has been developed previously [Goh et al., 2007], and the present study contributes new information to the network.
Furthermore, the results represent the baseline for studying the associations between interactome and phenome at the RASopathy class of disorders and represent a model for other syndromes. Further studies of associations between genome and phenome could contribute to develop specific molecular markers for different syndromes and enable diagnosis of a disease in early childhood.
Disclosure Statement
The authors have no conflicts of interest to declare.
Acknowledgment
This work was supported by the Slovenian Research Agency (ARRS) through the Research program Comparative genomics and genome biodiversity (P4-0220).
References
- 1.Aoki Y, Matsubara Y. Ras/MAPK syndromes and childhood hemato-oncological diseases. Int J Hematol. 2013;97:30–36. doi: 10.1007/s12185-012-1239-y. [DOI] [PubMed] [Google Scholar]
- 2.Barabási AL. Network medicine - from obesity to the ‘Diseasome’. N Engl J Med. 2007;357:404–407. doi: 10.1056/NEJMe078114. [DOI] [PubMed] [Google Scholar]
- 3.Cannistraci CV, Ogorevc J, Zorc M, Ravasi T, Dovc P, Kunej T. Pivotal role of the muscle-contraction pathway in cryptorchidism and evidence for genomic connections with cardiomyopathy pathways in RASopathies. BMC Med Genomics. 2013;6:5. doi: 10.1186/1755-8794-6-5. [DOI] [PMC free article] [PubMed] [Google Scholar]
- 4.Chen Y, Wu X, Jiang R. Integrating human omics data to prioritize candidate genes. BMC Med Genomics. 2013;6:57. doi: 10.1186/1755-8794-6-57. [DOI] [PMC free article] [PubMed] [Google Scholar]
- 5.Digilio MC, Lepri F, Baban A, Dentici ML, Versacci P, et al. RASopathies: clinical diagnosis in the first year of life. Mol Syndromol. 2011;1:282–289. doi: 10.1159/000331266. [DOI] [PMC free article] [PubMed] [Google Scholar]
- 6.Girirajan S, Eichler EE. Phenotypic variability and genetic susceptibility to genomic disorders. Hum Mol Genet. 2010;19:R176–R187. doi: 10.1093/hmg/ddq366. [DOI] [PMC free article] [PubMed] [Google Scholar]
- 7.Goh K, Cusick M, Valle D, Childs B, Vidal M, Barabási AL. The human disease network. Proc Natl Acad Sci USA. 2007;104:8685–8690. doi: 10.1073/pnas.0701361104. [DOI] [PMC free article] [PubMed] [Google Scholar]
- 8.Hernández-Martín A, Torrelo A. Rasopathies: developmental disorders that predispose to cancer and skin manifestations (in Spanish) Actas Dermosifiliogr. 2011;102:402–416. doi: 10.1016/j.ad.2011.02.010. [DOI] [PubMed] [Google Scholar]
- 9.Kiel C, Serrano L. Structure-energy-based predictions and network modelling of RASopathy and cancer missense mutations. Mol Syst Biol. 2014;10:727. doi: 10.1002/msb.20145092. [DOI] [PMC free article] [PubMed] [Google Scholar]
- 10.Oti M, Brunner HG. The modular nature of genetic diseases. Clin Genet. 2007;71:1–11. doi: 10.1111/j.1399-0004.2006.00708.x. [DOI] [PubMed] [Google Scholar]
- 11.Oti M, Huynen MA, Brunner HG. Phenome connections. Trends Genet. 2008;24:103–106. doi: 10.1016/j.tig.2007.12.005. [DOI] [PubMed] [Google Scholar]
- 12.Poot M, van der Smagt JJ, Brilstra EH, Bourgeron T. Disentangling the myriad genomics of complex disorders, specifically focusing on autism, epilepsy, and schizophrenia. Cytogenet Genome Res. 2011;135:228–240. doi: 10.1159/000334064. [DOI] [PubMed] [Google Scholar]
- 13.Rzhetsky A, Wajngurt D, Park N, Zheng T. Probing genetic overlap among complex human phenotypes. Proc Natl Acad Sci USA. 2007;104:11694–11699. doi: 10.1073/pnas.0704820104. [DOI] [PMC free article] [PubMed] [Google Scholar]
- 14.Szklarczy D, Franceschini A, Wyder S, Forslund K, Heller D, et al. String v10: protein-protein interaction networks, integrated over the tree of life. Nucleic Acids Res. 2015;43:D447–D452. doi: 10.1093/nar/gku1003. Database issue. [DOI] [PMC free article] [PubMed] [Google Scholar]
- 15.Tartaglia M, Gelb BD. Disorders of dysregulated signal traffic through the RAS-MAPK pathway: phenotypic spectrum and molecular mechanisms. Ann NY Acad Sci. 2010;1214:99–121. doi: 10.1111/j.1749-6632.2010.05790.x. [DOI] [PMC free article] [PubMed] [Google Scholar]
- 16.Tartaglia M, Zampino G, Gelb BD. Noonan syndrome: clinical aspects and molecular pathogenesis. Mol Syndromol. 2010;1:2–26. doi: 10.1159/000276766. [DOI] [PMC free article] [PubMed] [Google Scholar]
- 17.Tidyman WE, Rauen KA. The RASopathies: developmental syndromes of Ras/MAPK pathway dysregulation. Curr Opin Genet Dev. 2009;19:230–236. doi: 10.1016/j.gde.2009.04.001. [DOI] [PMC free article] [PubMed] [Google Scholar]
- 18.van Driel MA, Bruggeman J, Vriend G, Brunner HG, Leunissen JAM. A text-mining analysis of the human phenome. Eur J Hum Genet. 2006;14:535–542. doi: 10.1038/sj.ejhg.5201585. [DOI] [PubMed] [Google Scholar]
- 19.Wu X, Jiang R, Zhang MQ, Li S. Network-based global inference of human disease genes. Mol Syst Biol. 2008;4:189. doi: 10.1038/msb.2008.27. [DOI] [PMC free article] [PubMed] [Google Scholar]
- 20.Wu X, Liu Q, Jiang R. Align human interactome with phenome to identify causative genes and networks underlying disease families. Bioinformatics. 2009;25:98–104. doi: 10.1093/bioinformatics/btn593. [DOI] [PubMed] [Google Scholar]


