

Abstract
Background
This proof-of-principle study examines whether postnatal, low-dose exposure to environmental chemicals modifies the composition of gut microbiome. Three chemicals that are widely used in personal care products—diethyl phthalate (DEP), methylparaben (MPB), triclosan (TCS)—and their mixture (MIX) were administered at doses comparable to human exposure to Sprague-Dawley rats from birth through adulthood. Fecal samples were collected at two time points: postnatal day (PND) 62 (adolescence) and PND 181 (adulthood). The gut microbiome was profiled by 16S ribosomal RNA gene sequencing, taxonomically assigned and assessed for diversity.
Results
Metagenomic profiling revealed that the low-dose chemical exposure resulted in significant changes in the overall bacterial composition, but in adolescent rats only. Specifically, the individual taxon relative abundance for Bacteroidetes (Prevotella) was increased while the relative abundance of Firmicutes (Bacilli) was reduced in all treated rats compared to controls. Increased abundance was observed for Elusimicrobia in DEP and MPB groups, Betaproteobacteria in MPB and MIX groups, and Deltaproteobacteria in TCS group. Surprisingly, these differences diminished by adulthood (PND 181) despite continuous exposure, suggesting that exposure to the environmental chemicals produced a more profound effect on the gut microbiome in adolescents. We also observed a small but consistent reduction in the bodyweight of exposed rats in adolescence, especially with DEP and MPB treatment (p < 0.05), which is consistent with our findings of a reduced Firmicutes/Bacteroidetes ratio at PND 62 in exposed rats.
Conclusions
This study provides initial evidence that postnatal exposure to commonly used environmental chemicals at doses comparable to human exposure is capable of modifying the gut microbiota in adolescent rats; whether these changes lead to downstream health effects requires further investigation.
Electronic supplementary material
The online version of this article (doi:10.1186/s40168-016-0173-2) contains supplementary material, which is available to authorized users.
Keywords: Phthalate, Paraben, Triclosan, Microbiota
Background
Microbes that live on and inside the human body (microbiota) comprise about 100 trillion microbial cells [1–3]; the ratio of human to bacterial cells in the body is estimated to be approximately 1 to 1 [4]. Commensal bacteria provide a wide range of metabolic functions that the human body lacks. They facilitate diverse processes such as digestion of the nutrients and production of short-chain fatty acids and offer protection against pathogen colonization through competition for nutrients, secretion of antimicrobial substances, and microniche exclusion [5]. Commensal bacteria in the gut also promote angiogenesis and development of the intestinal epithelium; these bacteria have been shown to be essential for the normal development and function of the immune system [5]. However, the mechanistic relationship between microbiota diversity and biological function under different settings of host genetics or environmental factors remains obscure. Accumulating evidence suggests that the identity and relative abundance of many taxa in microbial communities are associated with environmental factors including diet and antibiotics [6–10]. How exposure to exogenous chemicals may influence the microbiome remains to be studied.
Human exposure to environmental chemicals is ubiquitous, and one major exposure source is through the use of personal care products. The most recent NHANES survey of environmental chemical exposure demonstrates measurable concentrations of diethyl phthalate (DEP), methylparaben (MPB), and triclosan (TCS) in the vast majority of the US population [11]. These three chemicals are frequently added to personal care products; DEP is used to stabilize fragrances and increase plastic flexibility, while MPB and TCS are commonly added as preservatives and microbicides [11]. Exposure to these chemicals has been linked to various health effects including obesity and other metabolic diseases [12–15] as well as breast cancer [16]. However, the underlying mechanism of these associations has not been clearly elucidated. Although the term “endocrine disruptors” has often been used to describe these chemicals, the evidence demonstrating such properties is conflicting and far from conclusive.
Emerging evidence suggest that the gut microbiome plays a critical role in human metabolism [17]. Importantly, the core microbiome is believed to be established over the first few years of life in humans, and its composition is susceptible to exogenous factors including diets and antibiotics [18, 19]. Early exposures are important, as denoted in the Developmental Origins of Health and Disease (DOHaD) paradigm. In particular, the adolescent period represents a narrow but profoundly critical window of susceptibility to myriad environmental exposures and conditions with potentially lifelong impacts on health and disease. Because MPB and TCS are commonly used as bactericides or fungicides, these chemicals have the potential to modify the microbiota, which, in turn, may influence human health. However, little direct evidence has been reported to suggest any interplay between environmental chemical exposure and the microbiome in human health, especially in adolescence in humans or in animal models exposed to chemical doses relevant to humans.
Herein, we employed a rodent model to determine whether exposure to chemicals found frequently in personal care products, i.e., DEP, MPB, TCS, and their mixture, administered at doses that result in urinary biomarker levels comparable to humans [20], affect the diversity of the gut microbiome at two developmental stages. This study stems from a parent study on windows of susceptibility to environmental chemical exposure on mammary gland development; therefore, only female rats were included in this investigation. We utilized the resources and animals of the parent study and collected fecal samples from adolescent (postnatal day (PND) 62) and adult (PND 181) female rats. This proof-of-principle study was designed to examine the potential impact of low-dose environmental toxicants on the composition of the gut microbiome.
Results
The gut microbiota in SD rats
16S ribosomal RNA (rRNA) gene PCRs were performed on 150 Sprague-Dawley (SD) rat fecal samples, 100 PND, 62 samples and 50 PND, 181 samples. In total, 17 samples (3 in OIL, 6 in DEP, 4 in MPB, 1 in TCS, and 3 in mixture (MIX)) were excluded because they showed no or poor DNA amplification. The rats for each treatment groups were housed in multiple cages to minimize the cage effect. We used a dual-barcoding sequencing approach to obtain high-quality sequencing data while minimizing the sequencing cost (illustrated in Additional file 1: Figure S1A). From a single Illumina MiSeq 250 × 2 pair-end sequencing run, and we generated ~3.7 million merged high-quality reads (quality score >30 at any position of the single read). After splitting by the barcodes, we obtained ~30 k high-quality reads per sample on average. The technical repeats were used to validate the reproducibility of the 16S rRNA gene sequencing. The taxonomy assignment showed that the mean correlation among the quadruplicates was within the range of 0.991 to 0.994 from phylum to genus level (Additional file 1: Figure S1B), while the mean correlation across all samples was 0.79 at the phylum level and 0.63 at the genus level.
Female SD rats were exposed to three chemicals (DEP, MPB, and TCS) and their mixtures as well as the vehicle alone (olive oil) from birth to adulthood (PND 1–181). The fecal droppings were collected from individual rat at two time points, PND 62 and PND 181. The experimental scheme is illustrated in Fig. 1a. Oral doses were selected to recapitulate human exposure levels; the urinary biomarker levels in our experiments were comparable to those observed in the US population [20, 21]. The unique feature of our study is the extreme low dose of exposure; these doses were between 1000 and 10,000-fold less than the reported NOAEL (no observed adverse effect level). Figure 1b shows the bacterial composition and the relative abundance at the phylum level of each individual sample grouped by treatment at these two time points. The difference with respect to chemical and time was apparent. Additional file 1: Figure S2 presents the bacterial composition and the relative abundance of individual samples at family levels. Consistent with previous studies [22], the dominant phyla in the rat gut microbiota were Firmicutes, Bacteroidetes, Proteobacteria, and TM7.
Fig. 1.
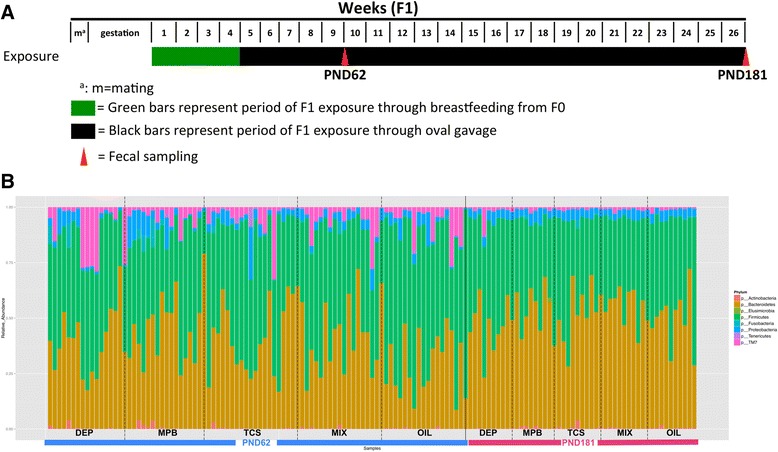
Composition of the rat microbiota at the phylum level. Samples were divided by ages (PND 62 or PND 181) and treatments. OIL oil control, DEP diethyl phthalate, MPB methylparaben, TCS triclosan, MIX mixture of equal quantities of the three environmental chemicals. a Illustration of the timeline of the environmental chemical treatments and fecal sample collection. b The bar plots present the relative abundance of phylum of each individual sample within each treatment group
Comparing PND 62 to PND 181, we observed a significant reduction in relative abundance of Firmicutes (41 vs. 47 %; p = 0.005) and TM7 (1 vs. 6 %, p < 0.001) and increase in Bacteroidetes (48 vs. 37 %, p < 0.001), regardless of the exposure. There was considerable separation of the overall microbiota diversity between the fecal samples collected at these two time points (p = 0.001, by permutational multivariate analysis of variance (PerMANOVA) test) (Fig. 2a); the mean sample-to-sample dissimilarity of gut microbiota was much higher at PND 62 than at PND 181 (Fig. 2a and Additional file 1: Figure S3A). Compared to PND 62, the samples collected at PND 181 showed higher bacterial community richness and lower variability within each treatment group (Additional file 1: Figure S3B).
Fig. 2.
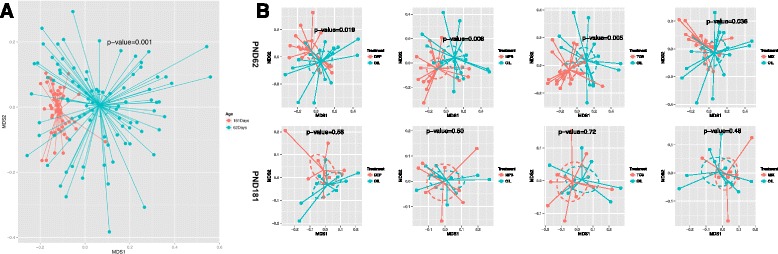
Comparison of overall microbiota from rats exposed to varied environmental chemical using nMDS ordination. The Bray-Curtis distance matrices generated from taxa composition and relative abundance at genus level were visualized in nMDS plot. The ellipses were drawn to represent the standard error. The texts of the group names were positioned at the center of each group. The significance of the dissimilarity of overall microbiota between two groups was tested using PerMANOVA. a Comparison of overall microbiota between PND 62 and PND 181. b Comparison of overall microbiota between each treatment and oil control at PND 62 (upper panel) or at PND 181 days (lower panel)
Chemical-induced changes of gut microbiota in SD rats
When comparing the chemical-treated to control rats, at phylum level, a significant reduction in abundance of Firmicutes (47 vs. 60 %, p = 0.004) and an increase of Bacteroidetes (41 % vs. 29 %, p = 0.003) were observed at PND 62 but not at PND 181 (Fig. 1b, Additional file 1: Figure S2). The Firmicutes/Bacteroidetes ratio, a metrics that is positively associated with obesity in mammals [23], was significantly lower in every chemical-treated group than the control at PND 62. Moreover, the exposed rats exhibited distinct microbiota from the control rats at PND 62 (Fig. 2b); the PerMANOVA test using the taxonomic composition at the genus level revealed significant separation of microbiota diversity in rats treated with DEP, MPB, TCS, and MIX from that of the controls (p = 0.02, 0.006,0.005, and 0.04, respectively). None of these treatments resulted in significant changes in the microbiota diversity at PND 181. No changes of average community richness were observed in any treatment group at either time point (Additional file 1: Figure S3B). We further compared the overall microbiota dissimilarity between the treatments (Additional file 1: Figure S4), and the PerMANOVA tests (Additional file 1: Table S1) suggested there were no significant differences.
We performed the linear discriminant analysis (LDA) effect size (LEfSe) analysis to compare the bacterial composition from phylum to genus levels between the chemical-treated and control groups. Results from PND 62 rats are shown in Fig. 3. At the phylum level, Bacteroidetes were increased and Firmicutes were reduced in all treated rats. Within the Bacteroidetes phylum, all treatments resulted in an increase in abundance of Prevotella species at the genus level (Fig. 3). Interestingly, in comparing the taxa composition associated with the three individual chemicals and their mixture, MPB and TCS, the two chemicals most commonly used as antimicrobial agent, showed similar microbiome shifts. TCS resulted in increase of Lachnospiraceae, which was also the major taxon increased in newborn mice exposed to low-dosage antibiotics in previous studies [9]. Compared to both MPB and TCS, DEP treatment showed more modest microbiome shifts. However, at the family level, the increases of Streptococcaceae and Elusimicrobiaceae were only observed in the DEP-treated animals, not in the MPB, TCS, or MIX groups. In addition, all treatments showed a reduction of Lactobacillus. The Betaproteobacteria at the class level was increased in the MPB or mixture groups, but not in the DEP- or TCS-treated rats. Importantly, no taxon was found to significantly differ by chemical exposure in the fecal samples collected at PND 181.
Fig. 3.
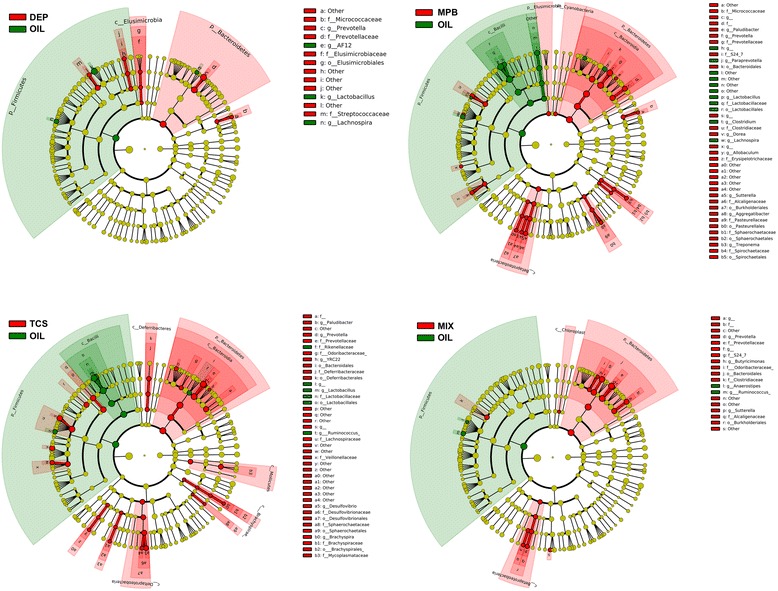
Taxonomic representation of statistically and biologically consistent differences between each environmental chemical treatment and controls at PND 62 rats. Cladogram plots present the LEfSe results on gut microbiome of environmental chemical-treated rats and controls at PND 62. Differences are represented in the color for the most abundant class (red indicating increase, green indicating reduction). Each circle’s diameter is proportional to the taxon’s relative abundance
Using the conventional criterion of 97 % sequence similarity (equal to the species level), we clustered the sequencing reads and identified a total of 2980 operational taxonomic units (OTUs). Compared to their corresponding controls, the treatment groups at PND 62 resulted in more differential OTUs (p < 0.05, false discovery rate (FDR) adjusted) than at PND 181 (Additional file 1: Table S2). At PND 62 (Additional file 1: Figure S5), samples from the DEP and MPB treatment groups showed an increase in OTUs from Fusobacteria (Fusobacterium and Leptotrichia genera); this was not apparent in samples from the TCS- or MIX-treated groups. We also observed an increase in OTUs from Bacteroidetes/Prevotella genus with DEP, MPB, or TCS treatment along but not with MIX. In comparison to the controls, we identified varying OTUs with DEP, MPB, TCS, MIX treatments (9, 11, 4, and 5, respectively, p < 0.05, FDR adjusted; Additional file 1: Table S2); these OTUs correspond to coverages of ~25, 28, 11, and 6 % of the total bacterial population in the controls. In agreement with our observation at the genus level, environmental chemical treatment increased the relative abundance of OTUs from the Prevotella genus and reduced the relative abundance of OTUs from the Lactobacillus genus. However, at PND 181, only three OTUs were statistically significant (p value <0.05), covering 1 % of the population in the MIX treatment group, while none were found in the other treatment groups.
The mean bodyweight of the experimental rats was calculated at PND 62 and PND 181; the results are presented in Table 1. At PND 62, the mean bodyweight of the exposed rats was consistently lower than that of the controls; however, the reduction was small and not all groups reached statistical significance. For example, the MPB-treated rats had a mean bodyweight of 199.4 g compared to 209.4 g for the controls; the 10-g difference (p = 0.0083) represents a bodyweight reduction of <5 %, with unknown health consequences. At PND 181, the reduction in the mean bodyweight was much less prominent; although the mean bodyweight in all treated groups was lower than the controls, the reduction was 1–3 %.
Table 1.
Mean bodyweights of environmental chemicals treated SD rats at PND 62 and PND 181
| Treatment | PND 62 | PND 181 | ||||
|---|---|---|---|---|---|---|
| Mean bodyweights (g) | Standard errors | p value* | Mean bodyweights (g) | Standard errors | p value | |
| DEP | 202.9 | 1.9 | 0.046 | 322.0 | 4.5 | 0.13 |
| MPB | 199.4 | 2.5 | 0.0083 | 327.2 | 5.3 | 0.39 |
| TCS | 206.5 | 2.7 | 0.43 | 328.5 | 4.8 | 0.46 |
| MIX | 207.2 | 2.7 | 0.56 | 331.0 | 3.1 | 0.63 |
| OIL | 209.4 | 2.5 | Reference | 334.5 | 6.3 | Reference |
*p value from Student’s t test
Discussion
Humans are commonly exposed to a broad spectrum of environmental chemicals at a wide range of doses; concern over such exposure continues to rise because of suspected or potential adverse health effects. A recent Centers for Disease Control and Prevention report indicates that all Americans harbor significant levels of many chemicals in their bodies, many are universally detected and many have concentration levels above the part-per-billion level [11]. There is a small but growing body of evidence supporting a role for such exposure in metabolic dysregulation, exhibited as body size changes [13, 24–26], insulin resistance, or altered thyroid hormone levels [15, 27].
In the meantime, the gut microbiome has emerged as a key player in human metabolism [17, 28, 29]. It is thus reasonable to hypothesize that the exposure to environmental chemicals may modify the gut microbiome and ultimately influence human health. A recent study by Narrowe et al. showed the low-level triclosan exposure altered the gut microbiome of the fathead minnow [30]. For this study, we selected phthalates, parabens, and triclosan for investigation because they are ubiquitous in the human environment as well as antimicrobial activities. Cho et al. demonstrated that exposure of low-dose antibiotics in mice resulted in substantial taxonomic changes in the microbiome and associated changes in the metabolism of carbohydrates to short-chain fatty acids, as well as the regulation of hepatic metabolism of lipids and cholesterol [9]. Schubert et al. also reported that the different structural shifts in the mouse microbiome resulting from various antibiotic exposures altered susceptibility to Clostridium difficile colonization [31]. We therefore postulate that low-dose exposure to these prevalent environmental chemicals may also modulate the composition of the gut microbiome. Results from this study demonstrate such capacity when exposed early in life, even at very low doses that are comparable to the human exposure.
Several studies supported by the Human Microbiome Project report differences in microbiota between children and adults [32–36]. Studies also suggest that variation of microbiota is highest during childhood and gradually decreases with age [33, 34, 37]. Similar to the findings in human studies, samples from the adolescent rats (PND 62) in our experiment also showed distinctive overall microbiota compared to the adult rats (PND 181), with higher relative abundance of Firmicutes and lower relative abundance of Bacteroidetes. However, how these two time points translate into human developmental stages is not totally clear; thus, caution is warranted in interpreting our findings. Compared to humans, rats have an abbreviated and accelerated childhood; they develop rapidly during infancy and become sexually mature at about 6 weeks of age (PND 42) or at 40 to 60 days [38]. Humans, on the other hand, develop slowly and do not reach puberty until the age of 11–12 years [39]. In rats, the period of PND 55–66 often represents the adolescent period and the transition to adulthood begins after the eighth week of postnatal life [40].
Compared to the adult rats, the gut microbiome of adolescent rats in our experiment showed lower taxon richness but higher variance within sample and higher sample-to-sample dissimilarity. Furthermore, our results revealed that all three chemicals, at levels comparable to those humans would likely encounter, significantly altered the overall microbiota diversity and resulted in more prominent changes at multiple taxon levels in the adolescent rats. However, the effects were diminished in the adult rats. We also observed a subtle yet consistent reduction in the bodyweight of the young rats, which corresponded with the observed shift in gut microbiota, in particular the reduced Firmicutes/Bacteroidetes ratio. It is known that the gut microbiota is continually subject to a wide variety of perturbations, including various environmental factors [41, 42]. However, even with these insults, the gut microbiota is generally stable over time due to the resilience of commensal microbes to survive under continuous challenge. In our experiment, the rats underwent treatment continuously from birth. Although the gut microbiome showed significant changes by treatment at the earlier age (adolescent), the gut microbiota appeared to be able to converge or recover at a later (adult) stage when the environmental-induced changes were minimized. These data suggest that the commensal gut microbiota can develop resistance to the low-dose environmental chemical exposure during development.
Low-dose antibiotic exposure, likely from environmental sources, showed no significant effect on the bacterial diversity within the samples [9]. Similar to antibiotics, in our study, exposure to low-dose environmental chemicals did not reduce the biodiversity of the gut microbiota. Nevertheless, environmental chemical exposures at such low doses were still capable of altering the overall composition of the gut microbiota. We observed an increase in abundance of Lachnospiraceae in TCS-treated rats, similar to that previously described in low-dose antibiotic-treated rodents [9]. However, in contrast to the increased Firmicutes/Bacteroidetes ratio in antibiotic-treated mice, we noted an increase in the relative abundance of Bacteroidetes compared to Firmicutes in the exposed adolescent rats, correlated with an observed reduction in bodyweight. These results may suggest different functional mechanisms between the low-dose antibiotics and the environmental chemicals used in this study; it may also reflect the inherent differences between rodents and humans. Such complexity of the association between environmental exposure and obesity-related outcomes has been recognized [43]. However, results on Firmicutes/Bacteroidetes ratio and obesity from other studies are inconsistent and warrant further validations [44, 45].
The combined effect of multiple exposures is rarely considered in environmental investigations. Considering that many chemicals, like the ones investigated in this study, are commonly used together in personal care products, it is unlikely that we encounter environmental chemicals one at a time. Recent investigations into the low-dose mixture effects of endocrine disruptors [46] demonstrate not only additive but also synergistic or antagonistic effects [47]. In the current study, treatment with mixture resulted in a distinct microbiome shift that differed from that of individual chemical or a simple additive effect, suggesting possible biological interactions of these chemicals.
The major limitation of the investigation is the lack of health-related outcomes in the animal model. This study stemmed from a parent study on the effects of environmental chemicals on normal mammary gland development, in which established microbiome-related outcomes, such as obesity or colitis, were not induced. Nevertheless, by utilizing the resources of the parent study, we were able to demonstrate that commonly used environmental chemicals have the capacity to change gut microbiome composition at a dose that is comparable to human exposure in the US population. More importantly, our results suggested that the early-life exposure resulted in more observable changes in the microbiome composition. A recent study using a rodent model demonstrated that altering the gut microbiota during a critical developmental window might have lasting metabolic consequences [48]. We are in the process of conducting the follow-up studies on the potential health outcomes. Another limitation is the use oral gavage as the route of exposure. Given the ubiquitous nature of the study compounds, human exposure is likely to involve multiple routes, via skin absorption, ingestion, and inhalation [49]. Several studies showed that breast milk during lactation also contains these three chemicals or their metabolites [50, 51]. While is it almost impossible to recreate exact human exposure scenario, we tried to resolve this issue by calibrating the exposure dose to achieve similar urinary biomarker concentrations between rats and humans. Gavage is preferred over other routes of exposure for environmental chemicals when very low doses are used [52]. It is difficult to ascertain the true intake when chemicals are mixed into food or drinking water ad libitum. Although gavage does not perfectly represent a model of human dietary exposure, this route has been employed for numerous studies assessing potential carcinogenic hazards [53]. Lastly, because the parent study was designed to investigate the underlying mechanisms of environmental exposures and breast cancer, only data on female rats were available so that any gender-specific effects on microbiome cannot be addressed in this investigation.
Conclusions
In summary, our study provides the first evidence that postnatal exposure to commonly used environmental chemicals at levels comparable to human exposure is able to alter the gut microbiota in a rodent model. These findings enhance our understanding on the impact of environmental toxicants on the composition of gut microbiome and, potentially, on the human health.
Methods
Animal study
All animal study procedures were performed at the Cesare Maltoni Cancer Research Centre/Ramazzini Institute (CMCRC/RI) (Bentivoglio, Italy). The experiment was conducted following the rules established by the Italian law regulating the use and human treatment of animals for scientific purposes (Decreto legislativo N. 26, 2014. Attuazione della direttiva n. 2010/63/UE in materia di protezione degli animali utilizzati a fini scientifici. - G.U. Serie Generale, n. 61 del 14 Marzo 2014). Before starting the experiment, the protocol was examined by the Ethical Committee of Ramazzini Institute for approval. The protocol of the experiment was also approved and authorized by the ad hoc commission of the Italian Ministry of Health and the Mount Sinai IACUC. Because the original study focuses on windows of susceptibility in breast cancer, only female SD rats, belonging to the colony used in the laboratory of the CMCRC for over 40 years, were used. The experimental animals (F1) received the treatment from birth (PND 1) through milk of dams (F0) exposed to environmental chemicals from parturition. After weaning, the female offspring (F1) were exposed through gavage three times a week until euthanization at PND 181.
The timeline of the experimental animal treatment and fecal sample collection is shown in Fig. 1a. The breeder animals (F0) were weighed weekly, starting after parturition, and the dose to be administered during lactation was calculated on the basis of the weekly weight. All the pups (F1) were housed with their dam (F0) until weaning; then, they were separated and identified by ear punch; each litter contributed to the study with one female pup. The animals were randomized in the different groups of treatment in order to have minimal differences in bodyweight among them, with a standard deviation of no more than 10 % from the average. They were housed in Makrolon cages (cm 41 × 25 × 15) at two or three per cage, with a stainless steel wire top and a shallow layer of white firewood shavings as bedding. All animals were kept in a single room at 23 ± 3 °C and at 40–60 % relative humidity. Lighting was artificial and the light/dark cycles were tended to be 12 h each. The F1 generation received the treatment through breast milk from PND 1 to PND 28 (weaning). Young females were then separated from their mothers and weighed individually every week; they were dosed by gavage following the protocol, based on the weekly mean bodyweight of each group. The animals were given the same standard “Corticella” pellet diet (Piccioni Laboratory, Milan, Italy) for both breeders and offspring; both feed and tap water were available ad libitum. Feed and tap water were periodically analyzed to exclude biological and chemical contamination (mycotoxins, pesticides, arsenic, lead, mercury, selenium). During the experiment, the mean daily water and feed consumption were measured per cage; bodyweights were individually measured once a week for the first 13 weeks and every two weeks until the end of the experiment. The experimental protocol is outlined in Table 2.
Table 2.
Experimental plan of environmental chemicals treatment and stool sampling
| Group | Compound (dose in mg/kg bw)a | Animals at start | Monitored animals | |
|---|---|---|---|---|
| No. | PND 62 | PND 181 | ||
| I | DEP (0.1735) | 20 | 20 | 10 |
| II | MPB (0.1050) | 20 | 20 | 10 |
| III | TCS (0.050) | 20 | 20 | 10 |
| IV | MIX (mixture of DEP + MPB + TCS) | 20 | 20 | 10 |
| V | OIL | 20 | 20 | 10 |
| Total | 100 | 100 | 50 | |
DEP diethyl phthalate, CAS 84-66-2, MPB methylparaben, CAS 99-76-3, TCS triclosan, CAS 3380-34-5), MIX mixture of DEP + MPB + TCS in equal quantities, OIL olive oil control, vehicle alone
aAnimals were treated from PND 1 to PND 181. The newborns (F1) were first exposed to chemicals postnatally through milk from the exposed dams, from birth to weaning (PND 28). After weaning, these pups were exposed through oral gavage three times a week, from PND 28 to PND 181. Each compound was administered in olive oil as vehicle by gastric intubation (gavage), starting with 0.5 ml of olive oil from 4 to 9 weeks of age, and then with 1 ml once adult
Tested compounds
Three chemicals and their mixture were tested along with a control group exposed to vehicle only. These chemicals, i.e., diethyl phthalate (CAS # 84-66-2, lot # STBB0862V, 99 % purity), methylparaben (CAS # 99-76-3, lot # BCBG0852V, 99 % purity), and triclosan (CAS # 3380-34-5, lot # 1412854 V, 97 % purity) were supplied in plastic containers by Sigma-Aldrich (Milan, Italy). Olive oil, supplied in glass bottles (Montalbano Agricola Alimentare Toscana, Florence, lot # 111275, Italy), was used as the vehicle to prepare all dosing solutions. Olive oil was tested to be free of the tested chemicals. The solutions were prepared every week using glass pipettes, stored in glass bottles, continuously stirred throughout the study, and kept at room temperature and in the dark; the stability of the solutions was confirmed by gas chromatography-mass spectrometry (GC-MS) (Neotron Laboratory, Modena, Italy). Precautions were taken to minimize any plastic contamination: the compounds were administered using a 5-ml glass syringe, and the biological samples were collected in polypropylene vials.
Dosage of chemical exposure
With knowledge of the toxicokinetic properties of the tested chemicals, we determined oral doses of DEP, MPB, and TCS that resulted from urinary biomarker concentrations comparable to those reported for the US population [20, 21]. Specifically, the oral doses were: NOAEL/10,000 for DEP and MPB; NOAEL/1000 for TCS, resulting in 0.1735, 0.105, and 0.05 mg/kg/day final doses, respectively. The mixture solutions were prepared by mixing the three chemicals at the selected dose. The control group received gavage with olive oil alone, which was the vehicle selected.
The experiment started with 100 dams (F0), 20 in each experimental group (three chemicals, one mixture and control). Their newborns (F1) were first exposed to chemicals postnatally through milk from the exposed dams, from birth to weaning (PND 28). After weaning, these pups were exposed through oral gavage three times a week (on Monday, Wednesday, and Friday), at similar times of the morning, and adjusted weekly to maintain a constant dose level in terms of bodyweight, from PND 28 to PND 181.
Fecal collection
Fecal samples were collected from all animals of the F1 generation (20 from each test compound) at PND 62. Afterwards, due to budgetary constraints, 50 rats, 10 from each test compound, were randomly selected and carried on with the chemical treatment until PND 181 when the fecal samples were collected. After oral gavage with the test chemicals, each animal was single-caged for at least 4 h in order to avoid contamination of fecal droppings from other animals. About 2–3 droppings from each animal were collected and preserved in cryovials on an ice bed. Forceps were used for collecting droppings, which were washed and cleaned using sterile water and 1 % sodium bicarbonate between each sampling to avoid cross contamination. The cryovials were then stored at −20 °C until shipment to the Icahn School of Medicine at Mount Sinai.
Fecal DNA extraction and processing
Rat fecal DNA was extracted using the Qiagen DNA Stool Mini Kit following the protocol from the manufacturer (Qiagen, Valencia, CA). Total DNA concentration was determined by Qubit 2.0 Fluorometer (Life technologies, Norwalk, CT). The phylogenetically informative V3–V4 region of 16S rRNA gene was amplified using universal primer 347F/803R [54, 55]. We designed a dual-barcoding approach to label the 16S rRNA gene amplicons from each sample (illustrated in Additional file 1: Figure S1A). Briefly, the 6-mer barcodes were attached on the 5′ends of both forward and reverse PCR primers so that 16S rRNA gene PCR amplicons from each sample contained a unique dual barcode combination. PCR primers were designed against conserved sequences to amplify the flanking variable 16S rRNA gene regions. The primers were synthesized by IDT (Integrated DNA technology, Coralville, IA), and the sequences are shown in Additional file 1: Table S3.
16S rRNA gene sequencing and data analysis
The 16S rRNA gene was then amplified by PCR with double-barcoded primer pairs. The integrity of the amplicons was verified by agarose gel electrophoresis. The resulting ~460-bp sized amplicons were pooled and then sequenced with the Illumina MiSeq paired-end sequencing platform. The 2 × 250 pair-end sequence fastq data were merged. After removal of the merged sequencing reads with a length of <400 or the quality score of < Q30 at more than 1 % of bases, all sequencing reads were split by barcode and trimmed of primer regions using CLC Genomic workbench 6. Quadruplicate measurements of one sample and duplicate measurements of three samples were processed and sequenced using different barcodes and batches to test the sequencing reproducibility. The filtered and trimmed high-quality reads were further processed by QIIME 1.7.0 [56]. We used the command pick_de_novo_otus.py with the defaulted cutoff = 97 % to cluster of nearly identical sequencing reads as an OTU using Uclust. Representative sequences for each OTU were aligned using PyNAST. The program further assigned taxonomy with the Uclust consensus taxonomy assigner and filtered the alignment to remove positions, which are all gaps, and specified as 0 in the lanemask. Finally, the program built a biom-formatted OTU table. Using Chimera Slayer [57], chimera sequences arising from the PCR amplification were detected and excluded from the aligned representative sequences and the OTU table. All non-singleton OTUs were retained for performing the log likelihood ratio test (QIIME command group_significance.py using g_test statistics) to further identify significant differential OTUs between each treatment and the normal controls. The resulted p values were adjusted by the FDR methods.
The overall microbiome dissimilarities among all samples were accessed using the Bray-Curtis distance matrices [58, 59]. Non-metric multiple dimensional scaling (nMDS) were used to visualize the dissimilarities. The PerMANOVA procedure [60, 61], with the maximum number of permutations = 999, was performed to test the significance of the overall microbiome differences between the gut microbiota grouped by PNDs and chemical treatments. The PerMANOVA procedure using the [Adonis] function of the R package vegan 2.0–5 [62] partitions the distance matrix among sources of variation, fits linear models to distance matrices and uses a permutation test with pseudo-F ratios to obtain the p values. The diversity within each microbial community, so-called alpha-diversity, was calculated using the Shannon Index as metric and represented the measure of the diversity at the genus level [63, 64]. Using the LEfSe method [65], we further selected the microbiome features significantly associated to PNDs and environmental chemical treatment at various taxonomic ranks.
Abbreviations
DEP, diethyl phthalate; LEfSe, linear discriminant analysis (LDA) effect size; MIX, mixture; MPB, methylparaben; OTU, operational taxonomic units; PerMANOVA, permutational multivariate analysis of variance; PND, postnatal day; SD, Sprague-Dawley; TCS, triclosan
Acknowledgements
We thank the OCS genome technology center of New York University Langone Medical Center for the library preparation and sequencing service.
Funding
This work was funded by NIEHS/ NCI: 5U01ES019459 (JC, KG, LL, and ST), Mount Sinai Children’s Environmental Health Center Pilot Fund, Institution fund of Ramazzini Institute, Bologna, Italy (FB), and NIDDK: 1K01DK094986-01(JH).
Availability of data and materials
16S rRNA gene sequencing information has been deposited into EMBL Nucleotide Sequence Database (ENA) and can be publicly accessed at www.ebi.ac.uk/ena/data/view/PRJEB12306.
Authors’ contributions
JH supervised the overall experiment, implemented the bioinformatics, and drafted the manuscript. VR, KG, and HFH performed the sample processing and qPCR. LL participated in the design of the study and helped to draft the manuscript. FM, LF, LB, and FB performed the animal experiments and collected the samples. ST participated in the design of the study and helped to draft the manuscript. JC conceived of the overall study and participated in its design and coordination and helped to draft the manuscript. All authors read and approved the final manuscript.
Competing interests
The authors declare that they have no competing interests.
Additional file
The significance of the overall microbiota differences between treatment groups by PerMANOVA (permutational multivariate analysis of variance) procedure. Table S2. List of differential OTUs by treatment at 62 days and 181 days. Table S3. The sequences of dual-barcoding 16S PCR primers. Figure S1. Multiplex double-barcoding 16S rRNA sequencing. 1A. Illustration of multiplex double-barcoding 16S rRNA sequencing. Figure S2. Profiles of the rat microbiota at the family level. Figure S3. Microbiota diversity in environmental chemical treatment and control groups. Figure S4. Comparison of overall microbiota from rats exposed to varied environmental chemical at PND 62 and PND 181 using nMDS ordination. Figure S5. The differential OTUs by treatment at PND 62. (PDF 4.93 mb)
Contributor Information
Jianzhong Hu, Phone: +1 (212) 241-7592, Email: jianzhong.hu@mssm.edu.
Jia Chen, Phone: +1 (212) 241-7592, Email: jia.chen@mssm.edu.
References
- 1.Turnbaugh PJ, Ley RE, Hamady M, Fraser-Liggett CM, Knight R, Gordon JI. The human microbiome project. Nature. 2007;449:804–10. doi: 10.1038/nature06244. [DOI] [PMC free article] [PubMed] [Google Scholar]
- 2.Turnbaugh PJ, Stintzi A. Human health and disease in a microbial world. Front Microbiol. 2011;2:190. doi: 10.3389/fmicb.2011.00190. [DOI] [PMC free article] [PubMed] [Google Scholar]
- 3.Cho I, Blaser MJ. The human microbiome: at the interface of health and disease. Nat Rev Genet. 2012;13:260–70. doi: 10.1038/nrg3182. [DOI] [PMC free article] [PubMed] [Google Scholar]
- 4.Sender R, Fuchs S, Milo R. Are we really vastly outnumbered? Revisiting the ratio of bacterial to host cells in humans. Cell. 2016;164:337–40. doi: 10.1016/j.cell.2016.01.013. [DOI] [PubMed] [Google Scholar]
- 5.Artis D. Epithelial-cell recognition of commensal bacteria and maintenance of immune homeostasis in the gut. Nat Rev Immunol. 2008;8:411–20. doi: 10.1038/nri2316. [DOI] [PubMed] [Google Scholar]
- 6.Zarrinpar A, Chaix A, Yooseph S, Panda S. Diet and feeding pattern affect the diurnal dynamics of the gut microbiome. Cell Metab. 2014;20:1006–17. doi: 10.1016/j.cmet.2014.11.008. [DOI] [PMC free article] [PubMed] [Google Scholar]
- 7.Lukens JR, Gurung P, Vogel P, Johnson GR, Carter RA, McGoldrick DJ, Bandi SR, Calabrese CR, Vande Walle L, Lamkanfi M, Kanneganti TD. Dietary modulation of the microbiome affects autoinflammatory disease. Nature. 2014;516:246–9. doi: 10.1038/nature13788. [DOI] [PMC free article] [PubMed] [Google Scholar]
- 8.David LA, Maurice CF, Carmody RN, Gootenberg DB, Button JE, Wolfe BE, Ling AV, Devlin AS, Varma Y, Fischbach MA, Biddinger SB, Dutton RJ, Turnbaugh PJ. Diet rapidly and reproducibly alters the human gut microbiome. Nature. 2013;505:559–63. doi: 10.1038/nature12820. [DOI] [PMC free article] [PubMed] [Google Scholar]
- 9.Cho I, Yamanishi S, Cox L, Methe BA, Zavadil J, Li K, Gao Z, Mahana D, Raju K, Teitler I, Li H, Alekseyenko AV, Blaser MJ. Antibiotics in early life alter the murine colonic microbiome and adiposity. Nature. 2012;488:621–6. doi: 10.1038/nature11400. [DOI] [PMC free article] [PubMed] [Google Scholar]
- 10.Wu GD, Chen J, Hoffmann C, Bittinger K, Chen YY, Keilbaugh SA, Bewtra M, Knights D, Walters WA, Knight R, Sinha R, Gilroy E, Gupta K, Baldassano R, Nessel L, Li H, Bushman FD, Lewis JD. Linking long-term dietary patterns with gut microbial enterotypes. Science. 2011;334:105–8. doi: 10.1126/science.1208344. [DOI] [PMC free article] [PubMed] [Google Scholar]
- 11.CDC . Fourth report on human exposure to environmental chemicals, updated tables. Atlanta, GA: U.S. Department of Health and Human Services, Centers for Disease Control and Prevention; 2013. [Google Scholar]
- 12.Lankester J, Patel C, Cullen MR, Ley C, Parsonnet J. Urinary triclosan is associated with elevated body mass index in NHANES. Plos One. 2013;8:e80057. doi: 10.1371/journal.pone.0080057. [DOI] [PMC free article] [PubMed] [Google Scholar]
- 13.Teitelbaum SL, Mervish N, Moshier EL, Vangeepuram N, Galvez MP, Calafat AM, Silva MJ, Brenner BL, Wolff MS. Associations between phthalate metabolite urinary concentrations and body size measures in New York City children. Environ Res. 2012;112:186–93. doi: 10.1016/j.envres.2011.12.006. [DOI] [PMC free article] [PubMed] [Google Scholar]
- 14.Hatch EE, Nelson JW, Qureshi MM, Weinberg J, Moore LL, Singer M, Webster TF. Association of urinary phthalate metabolite concentrations with body mass index and waist circumference: a cross-sectional study of NHANES data, 1999-2002. Environ Health. 2008;7:27. doi: 10.1186/1476-069X-7-27. [DOI] [PMC free article] [PubMed] [Google Scholar]
- 15.Stahlhut RW, van Wijngaarden E, Dye TD, Cook S, Swan SH. Concentrations of urinary phthalate metabolites are associated with increased waist circumference and insulin resistance in adult U.S. males. Environ Health Perspect. 2007;115:876–82. doi: 10.1289/ehp.9882. [DOI] [PMC free article] [PubMed] [Google Scholar]
- 16.Lopez-Carrillo L, Hernandez-Ramirez RU, Calafat AM, Torres-Sanchez L, Galvan-Portillo M, Needham LL, Ruiz-Ramos R, Cebrian ME. Exposure to phthalates and breast cancer risk in northern Mexico. Environ Health Perspect. 2010;118:539–44. doi: 10.1289/ehp.0901091. [DOI] [PMC free article] [PubMed] [Google Scholar]
- 17.Nicholson JK, Holmes E, Kinross J, Burcelin R, Gibson G, Jia W, Pettersson S. Host-gut microbiota metabolic interactions. Science. 2012;336:1262–7. doi: 10.1126/science.1223813. [DOI] [PubMed] [Google Scholar]
- 18.Gritz EC, Bhandari V. The human neonatal gut microbiome: a brief review. Front Pediatr. 2015;3:17. doi: 10.3389/fped.2015.00017. [DOI] [PMC free article] [PubMed] [Google Scholar]
- 19.Madan JC, Farzan SF, Hibberd PL, Karagas MR. Normal neonatal microbiome variation in relation to environmental factors, infection and allergy. Curr Opin Pediatr. 2012;24:753–9. doi: 10.1097/MOP.0b013e32835a1ac8. [DOI] [PMC free article] [PubMed] [Google Scholar]
- 20.Teitelbaum SL, Li Q, Lambertini L, Belpoggi F, Manservisi F, Falcioni L, Bua L, Silva MJ, Ye X, Calafat AM, Chen J. Paired serum and urine concentrations of biomarkers of diethyl phthalate, methyl paraben, and triclosan in rats. Environ Health Perspect. 2015 doi: 10.1289/ehp.1409586. [DOI] [PMC free article] [PubMed] [Google Scholar]
- 21.Teitelbaum SL, Li Q, Lambertini L, Belpoggi F, Manservisi F, Falcioni L, Bua L, Silva MJ, Ye X, Calafat AM, Chen J. Paired serum and urine concentrations of biomarkers of diethyl phthalate, methyl paraben, and triclosan in rats. Environ Health Perspect. 2016;124:39–45. doi: 10.1289/ehp.1409586. [DOI] [PMC free article] [PubMed] [Google Scholar]
- 22.Manichanh C, Reeder J, Gibert P, Varela E, Llopis M, Antolin M, Guigo R, Knight R, Guarner F. Reshaping the gut microbiome with bacterial transplantation and antibiotic intake. Genome Res. 2010;20:1411–9. doi: 10.1101/gr.107987.110. [DOI] [PMC free article] [PubMed] [Google Scholar]
- 23.Turnbaugh PJ, Hamady M, Yatsunenko T, Cantarel BL, Duncan A, Ley RE, Sogin ML, Jones WJ, Roe BA, Affourtit JP, Egholm M, Henrissat B, Heath AC, Knight R, Gordon JI. A core gut microbiome in obese and lean twins. Nature. 2009;457:480–4. doi: 10.1038/nature07540. [DOI] [PMC free article] [PubMed] [Google Scholar]
- 24.Masuno H, Kidani T, Sekiya K, Sakayama K, Shiosaka T, Yamamoto H, Honda K. Bisphenol A in combination with insulin can accelerate the conversion of 3 T3-L1 fibroblasts to adipocytes. J Lipid Res. 2002;43:676–84. [PubMed] [Google Scholar]
- 25.Heindel JJ. Endocrine disruptors and the obesity epidemic. Toxicol Sci. 2003;76:247–9. doi: 10.1093/toxsci/kfg255. [DOI] [PubMed] [Google Scholar]
- 26.Rubin BS, Soto AM. Bisphenol A: perinatal exposure and body weight. Mol Cell Endocrinol. 2009;304:55–62. doi: 10.1016/j.mce.2009.02.023. [DOI] [PMC free article] [PubMed] [Google Scholar]
- 27.Meeker JD, Calafat AM, Hauser R. Di(2-ethylhexyl) phthalate metabolites may alter thyroid hormone levels in men. Environ Health Perspect. 2007;115:1029–34. doi: 10.1289/ehp.9852. [DOI] [PMC free article] [PubMed] [Google Scholar]
- 28.Roediger WE. Role of anaerobic bacteria in the metabolic welfare of the colonic mucosa in man. Gut. 1980;21:793–8. doi: 10.1136/gut.21.9.793. [DOI] [PMC free article] [PubMed] [Google Scholar]
- 29.Le Chatelier E, Nielsen T, Qin J, Prifti E, Hildebrand F, Falony G, Almeida M, Arumugam M, Batto JM, Kennedy S, Leonard P, Li J, Burgdorf K, Grarup N, Jorgensen T, Brandslund I, Nielsen HB, Juncker AS, Bertalan M, Levenez F, Pons N, Rasmussen S, Sunagawa S, Tap J, Tims S, Zoetendal EG, Brunak S, Clement K, Dore J, Kleerebezem M, Kristiansen K, Renault P, Sicheritz-Ponten T, de Vos WM, Zucker JD, Raes J, Hansen T, Meta HIT, Bork P, Wang J, Ehrlich SD, Pedersen O. Richness of human gut microbiome correlates with metabolic markers. Nature. 2013;500:541–6. doi: 10.1038/nature12506. [DOI] [PubMed] [Google Scholar]
- 30.Narrowe AB, Albuthi-Lantz M, Smith EP, Bower KJ, Roane TM, Vajda AM, Miller CS. Perturbation and restoration of the fathead minnow gut microbiome after low-level triclosan exposure. Microbiome. 2015;3:6. doi: 10.1186/s40168-015-0069-6. [DOI] [PMC free article] [PubMed] [Google Scholar]
- 31.Macaulay IC, Voet T. Single cell genomics: advances and future perspectives. PLoS Genet. 2014;10:e1004126. doi: 10.1371/journal.pgen.1004126. [DOI] [PMC free article] [PubMed] [Google Scholar]
- 32.Perez-Cobas AE, Gosalbes MJ, Friedrichs A, Knecht H, Artacho A, Eismann K, Otto W, Rojo D, Bargiela R, von Bergen M, Neulinger SC, Daumer C, Heinsen FA, Latorre A, Barbas C, Seifert J, dos Santos VM, Ott SJ, Ferrer M, Moya A. Gut microbiota disturbance during antibiotic therapy: a multi-omic approach. Gut. 2013;62:1591–601. doi: 10.1136/gutjnl-2012-303184. [DOI] [PMC free article] [PubMed] [Google Scholar]
- 33.Woyke T, Sczyrba A, Lee J, Rinke C, Tighe D, Clingenpeel S, Malmstrom R, Stepanauskas R, Cheng JF. Decontamination of MDA reagents for single cell whole genome amplification. PLoS One. 2011;6:e26161. doi: 10.1371/journal.pone.0026161. [DOI] [PMC free article] [PubMed] [Google Scholar]
- 34.Palm NW, de Zoete MR, Cullen TW, Barry NA, Stefanowski J, Hao L, Degnan PH, Hu J, Peter I, Zhang W, Ruggiero E, Cho JH, Goodman AL, Flavell RA. Immunoglobulin A coating identifies colitogenic bacteria in inflammatory bowel disease. Cell. 2014;158:1000–10. doi: 10.1016/j.cell.2014.08.006. [DOI] [PMC free article] [PubMed] [Google Scholar]
- 35.Lasken RS. Genomic sequencing of uncultured microorganisms from single cells. Nat Rev Microbiol. 2012;10:631–40. doi: 10.1038/nrmicro2857. [DOI] [PubMed] [Google Scholar]
- 36.Yatsunenko T, Rey FE, Manary MJ, Trehan I, Dominguez-Bello MG, Contreras M, Magris M, Hidalgo G, Baldassano RN, Anokhin AP, Heath AC, Warner B, Reeder J, Kuczynski J, Caporaso JG, Lozupone CA, Lauber C, Clemente JC, Knights D, Knight R, Gordon JI. Human gut microbiome viewed across age and geography. Nature. 2012;486:222–7. doi: 10.1038/nature11053. [DOI] [PMC free article] [PubMed] [Google Scholar]
- 37.Sjoberg F, Nowrouzian F, Rangel I, Hannoun C, MooreA E, Adlerberth I, Wold AE. Comparison between terminal-restriction fragment length polymorphism (T-RFLP) and quantitative culture for analysis of infants’ gut microbiota. J Microbiol Methods. 2013;94:37–46. doi: 10.1016/j.mimet.2013.04.002. [DOI] [PubMed] [Google Scholar]
- 38.Adams N, Boice R. A longitudinal-study of dominance in an outdoor colony of domestic rats. J Comp Psychol. 1983;97:24–33. doi: 10.1037/0735-7036.97.1.24. [DOI] [Google Scholar]
- 39.Sengupta P. The laboratory rat: relating its age with human’s. Int J Prev Med. 2013;4:624–30. [PMC free article] [PubMed] [Google Scholar]
- 40.Tentler JJ, LaPaglia N, Steiner J, Williams D, Castelli M, Kelley MR, Emanuele NV, Emanuele MA. Ethanol, growth hormone and testosterone in peripubertal rats. Journal of Endocrinology. 1997;152:477–87. doi: 10.1677/joe.0.1520477. [DOI] [PubMed] [Google Scholar]
- 41.Lozupone CA, Stombaugh JI, Gordon JI, Jansson JK, Knight R. Diversity, stability and resilience of the human gut microbiota. Nature. 2012;489:220–30. doi: 10.1038/nature11550. [DOI] [PMC free article] [PubMed] [Google Scholar]
- 42.Gibson MK, Pesesky MW, Dantas G. The yin and yang of bacterial resilience in the human gut microbiota. J Mol Biol. 2014;426:3866–76. doi: 10.1016/j.jmb.2014.05.029. [DOI] [PMC free article] [PubMed] [Google Scholar]
- 43.de Cock M, van de Bor M. Obesogenic effects of endocrine disruptors, what do we know from animal and human studies? Environ Int. 2014;70:15–24. doi: 10.1016/j.envint.2014.04.022. [DOI] [PubMed] [Google Scholar]
- 44.Gevers D, Kugathasan S, Denson LA, Vazquez-Baeza Y, Van Treuren W, Ren B, Schwager E, Knights D, Song SJ, Yassour M, Morgan XC, Kostic AD, Luo C, Gonzalez A, McDonald D, Haberman Y, Walters T, Baker S, Rosh J, Stephens M, Heyman M, Markowitz J, Baldassano R, Griffiths A, Sylvester F, Mack D, Kim S, Crandall W, Hyams J, Huttenhower C, Knight R, Xavier RJ. The treatment-naive microbiome in new-onset Crohn’s disease. Cell Host Microbe. 2014;15:382–92. doi: 10.1016/j.chom.2014.02.005. [DOI] [PMC free article] [PubMed] [Google Scholar]
- 45.Walters WA, Xu Z, Knight R. Meta-analyses of human gut microbes associated with obesity and IBD. FEBS Lett. 2014;588:4223–33. doi: 10.1016/j.febslet.2014.09.039. [DOI] [PMC free article] [PubMed] [Google Scholar]
- 46.Kortenkamp A. Ten years of mixing cocktails: a review of combination effects of endocrine-disrupting chemicals. Environ Health Perspect. 2007;115(Suppl 1):98–105. doi: 10.1289/ehp.9357. [DOI] [PMC free article] [PubMed] [Google Scholar]
- 47.Christiansen S, Scholze M, Dalgaard M, Vinggaard AM, Axelstad M, Kortenkamp A, Hass U. Synergistic disruption of external male sex organ development by a mixture of four antiandrogens. Environ Health Perspect. 2009;117:1839–46. doi: 10.1289/ehp.0900689. [DOI] [PMC free article] [PubMed] [Google Scholar]
- 48.Yang H, Taylor KD, Rotter JI. Inflammatory bowel disease. I. Genetic epidemiology. Mol Genet Metab. 2001;74:1–21. doi: 10.1006/mgme.2001.3199. [DOI] [PubMed] [Google Scholar]
- 49.Bendall ML, Luong K, Wetmore KM, Blow M, Korlach J, Deutschbauer A, Malmstrom RR. Exploring the roles of DNA methylation in the metal-reducing bacterium Shewanella oneidensis MR-1. J Bacteriol. 2013;195:4966–74. doi: 10.1128/JB.00935-13. [DOI] [PMC free article] [PubMed] [Google Scholar]
- 50.Hines EP, Calafat AM, Silva MJ, Mendola P, Fenton SE. Concentrations of phthalate metabolites in milk, urine, saliva, and serum of lactating North Carolina women. Environ Health Perspect. 2009;117:86–92. doi: 10.1289/ehp.11610. [DOI] [PMC free article] [PubMed] [Google Scholar]
- 51.Hines EP, Mendola P, von Ehrenstein OS, Ye X, Calafat AM, Fenton SE. Concentrations of environmental phenols and parabens in milk, urine and serum of lactating North Carolina women. Reprod Toxicol. 2015;54:120–8. doi: 10.1016/j.reprotox.2014.11.006. [DOI] [PMC free article] [PubMed] [Google Scholar]
- 52.Vandenberg LN, Welshons WV, Vom Saal FS, Toutain PL, Myers JP. Should oral gavage be abandoned in toxicity testing of endocrine disruptors? Environ Health. 2014;13:46. doi: 10.1186/1476-069X-13-46. [DOI] [PMC free article] [PubMed] [Google Scholar]
- 53.Peter I, Mitchell AA, Ozelius L, Erazo M, Hu J, Doheny D, Abreu MT, Present DH, Ullman T, Benkov K, Korelitz BI, Mayer L, Desnick RJ, New York Crohn’s Disease Working G. Evaluation of 22 genetic variants with Crohn’s disease risk in the Ashkenazi Jewish population: a case-control study. BMC Med Genet. 2011;12:63. doi: 10.1186/1471-2350-12-63. [DOI] [PMC free article] [PubMed] [Google Scholar]
- 54.Ahn JY, Yang LY, Paster BJ, Ganly I, Morris L, Pei ZH, Hayes RB. Oral microbiome profiles: 16S rRNA pyrosequencing and microarray assay comparison. Plos One. 2011;6:e22788. doi: 10.1371/journal.pone.0022788. [DOI] [PMC free article] [PubMed] [Google Scholar]
- 55.Nossa CW, Oberdorf WE, Yang L, Aas JA, Paster BJ, Desantis TZ, Brodie EL, Malamud D, Poles MA, Pei Z. Design of 16S rRNA gene primers for 454 pyrosequencing of the human foregut microbiome. World J Gastroenterol. 2010;16:4135–44. doi: 10.3748/wjg.v16.i33.4135. [DOI] [PMC free article] [PubMed] [Google Scholar]
- 56.Caporaso JG, Kuczynski J, Stombaugh J, Bittinger K, Bushman FD, Costello EK, Fierer N, Pena AG, Goodrich JK, Gordon JI, Huttley GA, Kelley ST, Knights D, Koenig JE, Ley RE, Lozupone CA, McDonald D, Muegge BD, Pirrung M, Reeder J, Sevinsky JR, Tumbaugh PJ, Walters WA, Widmann J, Yatsunenko T, Zaneveld J, Knight R. QIIME allows analysis of high-throughput community sequencing data. Nat Methods. 2010;7:335–6. doi: 10.1038/nmeth.f.303. [DOI] [PMC free article] [PubMed] [Google Scholar]
- 57.Qin J, Li R, Raes J, Arumugam M, Burgdorf KS, Manichanh C, Nielsen T, Pons N, Levenez F, Yamada T, Mende DR, Li J, Xu J, Li S, Li D, Cao J, Wang B, Liang H, Zheng H, Xie Y, Tap J, Lepage P, Bertalan M, Batto JM, Hansen T, Le Paslier D, Linneberg A, Nielsen HB, Pelletier E, Renault P, Sicheritz-Ponten T, Turner K, Zhu H, Yu C, Li S, Jian M, Zhou Y, Li Y, Zhang X, Li S, Qin N, Yang H, Wang J, Brunak S, Dore J, Guarner F, Kristiansen K, Pedersen O, Parkhill J, Weissenbach J, et al. A human gut microbial gene catalogue established by metagenomic sequencing. Nature. 2010;464:59–65. doi: 10.1038/nature08821. [DOI] [PMC free article] [PubMed] [Google Scholar]
- 58.Tong M, McHardy I, Ruegger P, Goudarzi M, Kashyap PC, Haritunians T, Li X, Graeber TG, Schwager E, Huttenhower C, Fornace AJ, Jr., Sonnenburg JL, McGovern DP, Borneman J, Braun J. Reprograming of gut microbiome energy metabolism by the FUT2 Crohn’s disease risk polymorphism. ISME J. 2014. doi:10.1038/ismej.2014.64. [DOI] [PMC free article] [PubMed]
- 59.Bray JR, Curtis JT. An ordination of the upland forest communities of Southern Wisconsin. Ecological Monographs. 1957;27:326–49. doi: 10.2307/1942268. [DOI] [Google Scholar]
- 60.Chen J, Bittinger K, Charlson ES, Hoffmann C, Lewis J, Wu GD, Collman RG, Bushman FD, Li HZ. Associating microbiome composition with environmental covariates using generalized UniFrac distances. Bioinformatics. 2012;28:2106–13. doi: 10.1093/bioinformatics/bts342. [DOI] [PMC free article] [PubMed] [Google Scholar]
- 61.Price LB, Liu CM, Johnson KE, Aziz M, Lau MK, Bowers J, Ravel J, Keim PS, Serwadda D, Wawer MJ, Gray RH. The effects of circumcision on the penis microbiome. PLoS One. 2010;5:e8422. doi: 10.1371/journal.pone.0008422. [DOI] [PMC free article] [PubMed] [Google Scholar]
- 62.Oksanen J. Multivariate analysis of ecological communities in R: vegan tutorial. 2013. [Google Scholar]
- 63.Morgan XC, Huttenhower C. Chapter 12: human microbiome analysis. PLoS Comput Biol. 2012;8:e1002808. doi: 10.1371/journal.pcbi.1002808. [DOI] [PMC free article] [PubMed] [Google Scholar]
- 64.Shannon CE. A mathematical theory of communication. Bell Syst Tech J. 1948;27:623–56. doi: 10.1002/j.1538-7305.1948.tb00917.x. [DOI] [Google Scholar]
- 65.Segata N, Izard J, Waldron L, Gevers D, Miropolsky L, Garrett WS, Huttenhower C. Metagenomic biomarker discovery and explanation. Genome Biol. 2011;12:R60. doi: 10.1186/gb-2011-12-6-r60. [DOI] [PMC free article] [PubMed] [Google Scholar]
Associated Data
This section collects any data citations, data availability statements, or supplementary materials included in this article.
Data Availability Statement
16S rRNA gene sequencing information has been deposited into EMBL Nucleotide Sequence Database (ENA) and can be publicly accessed at www.ebi.ac.uk/ena/data/view/PRJEB12306.