

Abstract
Background
Life expectancy is increasing in Europe, yet a substantial proportion of adults still die prematurely before the age of 70 years. We sought to estimate the joint and relative contributions of tobacco smoking, hypertension, obesity, physical inactivity, alcohol and poor diet towards risk of premature death.
Methods
We analysed data from 264,906 European adults from the EPIC prospective cohort study, aged between 40 and 70 years at the time of recruitment. Flexible parametric survival models were used to model risk of death conditional on risk factors, and survival functions and attributable fractions (AF) for deaths prior to age 70 years were calculated based on the fitted models.
Results
We identified 11,930 deaths which occurred before the age of 70. The AF for premature mortality for smoking was 31 % (95 % confidence interval (CI), 31–32 %) and 14 % (95 % CI, 12–16 %) for poor diet. Important contributions were also observed for overweight and obesity measured by waist-hip ratio (10 %; 95 % CI, 8–12 %) and high blood pressure (9 %; 95 % CI, 7–11 %). AFs for physical inactivity and excessive alcohol intake were 7 % and 4 %, respectively. Collectively, the AF for all six risk factors was 57 % (95 % CI, 55–59 %), being 35 % (95 % CI, 32–37 %) among never smokers and 74 % (95 % CI, 73–75 %) among current smokers.
Conclusions
While smoking remains the predominant risk factor for premature death in Europe, poor diet, overweight and obesity, hypertension, physical inactivity, and excessive alcohol consumption also contribute substantially. Any attempt to minimise premature deaths will ultimately require all six factors to be addressed.
Electronic supplementary material
The online version of this article (doi:10.1186/s12916-016-0630-6) contains supplementary material, which is available to authorized users.
Keywords: Premature death, Mortality, Modifiable risk factors, Attributable fraction, Absolute risk
Background
Life expectancy in all countries of Western Europe has increased substantially over recent decades, primarily due to important decreases in mortality rates for death in middle age [1]. Within the European Union (EU27, 27 countries in the European Union), male age expectancy at age 40 ranges from 71 in the Baltic countries to around 80 in Mediterranean Europe, UK, and Sweden [2]. For women at age 40, the range is from 79 years in Bulgaria and Romania, to 86 years in France and Spain. If we define the age range 40–69 as ‘middle age’ and death occurring in this range as being premature, then about 20 % of men and 11 % of women in Europe (15 countries in the European Union, EU15) who reach the age of 40 can be expected to die prematurely based on current mortality rates [2].
Studies of premature death require the analysis of very large population cohorts or intervention studies with extensive baseline exposure information on major risk factors and complete mortality data. An alternative is to use a modelling approach, such as that taken by the Global Burden of Diseases (GBD) initiative, whereby estimates of exposure and disease risk from multiple sources are combined and used to approximate the contribution of different exposures to overall mortality and morbidity [1]. The GBD has estimated that, for Europe, the primary causes of premature mortality, in order of importance, are smoking, dietary risks, high blood pressure, high body mass index (BMI), physical inactivity, and high alcohol consumption. Other important factors are thought to include high cholesterol, high fasting plasma glucose, ambient air pollution, and occupational risks [3, 4]. While this initiative has resulted in extremely important information, and is the only option for most populations, it has a number of limitations such as the inclusion of data of variable quality from many different sources, and the inability to adjust comprehensively and consistently for other mortality risk factors that may confound the observed relationships. The GBD modelling approach is also usually not able to provide estimates of absolute risk and attributable fractions for important subgroups, e.g. for smokers and non-smokers separately, or for sets of risk factors combined.
To overcome these limitations, we have calculated estimates of the contribution of primary risk factors for premature death in Europe based on individual level data using the European Prospective Investigation into Cancer and Nutrition (EPIC) cohort study, which includes extensive exposure data on all primary risk factors, as well as complete follow-up for vital status, from 265,000 adults in 10 European countries.
Methods
Selection of risk factors
Our primary focus was on risk factors that are modifiable at a personal level, which have all been consistently associated with elevated risks of major chronic diseases and subsequent premature death, namely smoking [4–9], unhealthy diet [4, 10–12], high blood pressure [4, 9, 13], overweight and obesity [4, 14–18], physical inactivity [4, 6, 16, 19–22], and alcohol intake [23–27]. Additionally, we considered total cholesterol to HDL ratio (TC:HDL) [28, 29] and glycated haemoglobin (HbA1c) [4, 30–32].
Study population
EPIC is an on-going multicentre prospective cohort study that recruited approximately 520,000 participants in 10 European countries (Denmark, France, Germany, Greece, Italy, The Netherlands, Norway, Spain, Sweden, and the United Kingdom) from 1992 to 2000. Approximately 70 % were women and most were aged between 35 and 70 years at baseline. A detailed description of the methods employed has previously been described [33, 34]. Blood samples were collected at baseline according to standardised procedures, and written informed consent for the baseline data collection and follow-up for vital status was provided by all study participants. For this analysis we excluded participants who were ≥ 75 or < 40 years old when recruited (n = 62,775); participants with missing questionnaire information (n = 30,048) or blood pressure measurements (n = 161,693); and participants with missing follow-up information (n = 1908). This analysis therefore included 264,906 participants (172,119 women and 92,787 men) from nine countries (as participants from Norway did not have their blood pressure measured). We also conducted sensitivity analyses including all participants with missing blood pressure to ensure that the estimates for the other covariates remained similar.
Diet, lifestyle and anthropometric information
At recruitment, lifestyle and dietary questionnaires were used to obtain detailed information on all risk factors. Participants were classified as being never, former or current smokers at the time of interview. Diet and alcohol intake over the previous 12 months were assessed at study baseline using validated country-/centre-specific dietary questionnaires [33, 34], and alcohol intake was converted into grams of alcohol per day (g/day) by applying empirically derived definitions of standard drinks for each beverage and country. Both occupational and recreational physical activity were assessed via questionnaire using a validated scoring system [35].
Weight was measured with participants not wearing shoes to the nearest 0.1 kg; while height was measured – dependent on the study centre – to the nearest 0.1, 0.5, or 1.0 cm. Waist circumference was measured either at the smallest torso circumference or at the midpoint between the lower ribs and iliac crest. Hip circumference was measured horizontally at the level of the largest lateral extension of the hips or over the buttocks.
Systolic (SBP) and diastolic (DBP) blood pressure was measured on the right arms of participants while in sitting positions by trained personnel at baseline. Two separate readings were performed for each participant using a standard mercury manometer or oscillometric device, except in Denmark and Sweden, where one single measurement was taken in the supine position. To avoid any possible “white-coat” effect, if available, the second reading was used.
Finally, the EPIC Biomarkers sub-cohort of 16,775 randomly-selected participants (10,524 with complete risk factor data for the present analysis) was used to measure levels of circulating cholesterol (TC:HDL ratio) and HbA1c as a marker of average plasma glucose concentration. Total cholesterol and HDL-C levels were measured from serum (plasma for Umea, Sweden) using the Cobas® homogeneous enzymatic colorimetric test assay. HbA1c was measured from red blood cell fraction using the Tosoh (HLC-723G8) ion exchange high-performance liquid chromatography assay.
Assessment of mortality
Data on vital status and the cause and date of death were collected at the EPIC study centres using record linkages with cancer registries, boards of health and death indices, or through active follow-up. End of follow-up was defined as the latest date of complete follow-up for vital status, which was between 2008 and 2010 dependent on study centre.
Definition of premature mortality
We provide estimates of the contribution for various risk factors to the risk of dying before 70 years of age, conditional on surviving to age 40 years. We additionally provide these estimates for death prior to ages 65 and 75 years in Additional file 1: Table S3 and Additional file 2: Table S4.
Statistical methods
Participants were classified as never, former, or current smokers. Alcohol consumption was modelled using the following categories (standard drinks/day, with a standard drink defined as 10 g of alcohol): 0, 0–0.5, 0.5–1, 1–2, 2–6, 6–10, and > 12 (men only). The dietary score used was an adapted version of the WCRF/AICR score [11], including the intakes of (1) energy dense foods/sugary drinks, (2) plant foods (fruits/vegetables/dietary fibre), and (3) animal foods (red and processed meat). The derived dietary score was categorised into four groups: unhealthy, moderately unhealthy, moderately healthy, and healthy. Full details of dietary score derivation can be found in the Additional file 3: Methods. Occupational and recreational physical activity were combined and categorised into four groups (“The Cambridge Index”) – inactive, moderately inactive, moderately active and active. BMI was calculated as kg/m2 and categorised as < 20, 20–21.9, 22–24.9 (reference), 25–29.9, 30–34.9, and ≥ 35. We constructed five categories of waist-hip ratio (WHR) by splitting the distribution at its sex-specific quintiles. Blood pressure was categorised into clinical cut-points: normal (SBP < 120 mm Hg and DBP < 80 mm Hg); pre-hypertension (SBP ≥ 120 mm Hg or DBP ≥ 80 mm Hg); hypertension 1 (SBP ≥ 140 mm Hg or DBP ≥ 90 mm Hg); and hypertension 2 (SBP ≥ 160 mm Hg or DBP ≥ 100 mm Hg) [36]. Sex-specific fourths were created for both TC:HDL and HbA1c.
Hazard ratios (HR) and 95 % confidence intervals (CI) for all-cause mortality were estimated using flexible parametric survival models on the cumulative hazards scale [37, 38], which – in addition to the HR – allow direct estimation of the conditional cumulative hazard function, and thus absolute risks of death. Within these models we employed restricted cubic splines with three internal knots to model the baseline hazard using attained age as the time-scale. Separate models were fitted for men and women, as well as for both sexes combined. All models included age at baseline, smoking status, dietary score, alcohol intake, physical activity, blood pressure, and either BMI or WHR. Finally, we considered models that also included the TC:HDL ratio or HbA1c in the sub-cohort which had these measures available. We present HRs and CIs for premature mortality estimated using models fit to follow-up data censored at 70 years of age. We investigated non-proportional hazards by fitting interactions between covariates and the time-scale (attained age), and the final models allowed the parameters for smoking status to vary over time. We also examined whether there were any important interactions between pairs of covariates by comparing models with and without interaction terms using the likelihood-ratio test.
Model-based survival functions and their CI were obtained from fitted models at specific combinations of covariate values. These survival functions were conditional on surviving until age 40 years. We also calculated attributable fractions (AFs) for each covariate based on the predicted survival functions evaluated at age 70. These AFs rely on the comparison between the expected survival at age 70 under the following scenarios: (1) the observed distribution of risk factors in the cohort and (2) an alternative, reference (counterfactual) distribution of risk factors corresponding to the removal of a specific risk factor or set of risk factors. For most risk factors, the reference distribution was simply set so each member of the cohort was “unexposed” to the risk factor, or in the category of the risk factor associated with the lowest risk of death. These attributable risks thus represent a “best-case”, in that they are calculated based on a hypothetical reference population with risk factors removed entirely. For smoking, the reference distribution was a cohort of never smokers. For most risk factors the reference distribution was similarly defined, i.e. normal blood pressure, most healthy diet, physically active, and lowest category of WHR. For BMI, the reference distribution was set to 22–25 for all participants with a BMI above 22, and left unchanged for those with a BMI < 22. The reference distribution for alcohol intake was a population that drinks no more than one or two standard drinks per day. Thus, the reference distribution removes the excess risk associated with drinking more than two drinks per day, without removing the apparent excess risk from consuming less than one drink per day or abstaining. See Additional file 3: Methods for technical details of the AF calculations. All statistical analyses were conducted using Stata version 12.1 and R version 3.1.2.
Results
Among the 264,906 EPIC participants (172,119 women and 92,787 men) with complete baseline and follow-up data who were included in this analysis, we identified 11,930 premature deaths (i.e. before the age of 70) during a median follow-up of 11.5 years. These deaths were predominantly due to cancer (5907, 50 %) and circulatory diseases (2580, 22 %). Survival functions for men and women in our study sample are presented in Additional file 4: Figure S1. Survival to age 70 was somewhat higher in EPIC (93 % for women and 86 % for men) than that expected based on the general European population (89 % for women and 80 % for men, calculated based on mortality rates from the EU15) [2]. After accounting for sex and smoking status, the survival functions were similar across all countries, with the exception of Italy and France, which had higher survival in each of the sex/smoking strata (Additional file 5: Figure S2). The distributions of the risk factors are presented in Table 1. The number of participants by country and sex are presented in Additional file 6: Table S1 and the distribution of covariates by country is presented in Additional file 7: Table S2.
Table 1.
Baseline and covariate distributions in the EPIC cohort: overall, for premature deaths (prior to age 70 years), and by sex
| All | Sex | ||||||||
|---|---|---|---|---|---|---|---|---|---|
| Total | Premature deaths | Male | Female | ||||||
| n = 264,906 | % | n = 11,930 | % | n = 92,787 | % | n = 172,119 | % | ||
| Age at baseline, years | 40–50 | 67,229 | 25 | 1597 | 13 | 21,270 | 23 | 45,959 | 27 |
| 50–60 | 124,557 | 47 | 7302 | 61 | 44,441 | 48 | 80,116 | 47 | |
| 60–70 | 64,640 | 24 | 3031 | 25 | 23,492 | 25 | 41,148 | 24 | |
| Smoking | Never smoker | 121,743 | 46 | 3365 | 28 | 26,462 | 29 | 95,281 | 55 |
| Former smoker | 79,391 | 30 | 3489 | 29 | 37,967 | 41 | 41,424 | 24 | |
| Current smoker | 63,772 | 24 | 5076 | 43 | 28,358 | 31 | 35,414 | 21 | |
| Blood pressure | Normal | 54,935 | 21 | 1793 | 15 | 11,253 | 12 | 43,682 | 25 |
| Pre-hypertension | 102,263 | 39 | 4023 | 34 | 35,844 | 39 | 66,419 | 39 | |
| Hypertension 1 | 72,429 | 27 | 3711 | 31 | 30,481 | 33 | 41,948 | 24 | |
| Hypertension 2 | 35,279 | 13 | 2403 | 20 | 15,209 | 16 | 20,070 | 12 | |
| BMI (kg/m2) | < 20 | 12,001 | 5 | 665 | 6 | 1447 | 2 | 10,554 | 6 |
| 20–21.9 | 30,376 | 11 | 1244 | 10 | 5443 | 6 | 24,933 | 14 | |
| 22–24.9 (reference) | 77,680 | 29 | 3127 | 26 | 24,984 | 27 | 52,696 | 31 | |
| 25–29.9 (overweight) | 103,379 | 39 | 4602 | 39 | 46,392 | 50 | 56,987 | 33 | |
| 30–34.9 (obese) | 32,270 | 12 | 1672 | 14 | 12,391 | 13 | 19,879 | 12 | |
| 35+ (very obese) | 9200 | 3 | 620 | 5 | 2130 | 2 | 7070 | 4 | |
| Waist-to-hip ratio (sex-specific fifths) |
1 | 57,336 | 22 | 1960 | 16 | 19,000 | 20 | 38,336 | 22 |
| 2 | 52,688 | 20 | 2102 | 18 | 21,985 | 24 | 30,703 | 18 | |
| 3 | 59,966 | 23 | 2372 | 20 | 18,517 | 20 | 41,449 | 24 | |
| 4 | 45,066 | 17 | 2200 | 18 | 14,844 | 16 | 30,222 | 18 | |
| 5 | 49,850 | 19 | 3296 | 28 | 18,441 | 20 | 31,409 | 18 | |
| Alcohol intake (drinks/day) | 0 | 32,826 | 12 | 1598 | 13 | 5941 | 6 | 26,885 | 16 |
| 0–0.5 | 78,871 | 30 | 3054 | 26 | 16,748 | 18 | 62,123 | 36 | |
| 0.5–1 | 42,158 | 16 | 1580 | 13 | 13,255 | 14 | 28,903 | 17 | |
| 1–2 | 50,904 | 19 | 2073 | 17 | 20,550 | 22 | 30,354 | 18 | |
| 2–6 | 52,468 | 20 | 2741 | 23 | 29,860 | 32 | 22,608 | 13 | |
| > 6 (women), 6–10 (men) | 6683 | 3 | 690 | 6 | 5437 | 6 | 1246 | 1 | |
| > 10 (men) | 996 | 0 | 194 | 2 | 996 | 1 | 0 | 0 | |
| Diet | Unhealthy | 22,346 | 8 | 1746 | 15 | 12,617 | 14 | 9729 | 6 |
| Moderately unhealthy | 112,965 | 43 | 5792 | 49 | 48,238 | 52 | 64,727 | 38 | |
| Moderately healthy | 77,110 | 29 | 2800 | 23 | 20,515 | 22 | 56,595 | 33 | |
| Healthy | 52,485 | 20 | 1592 | 13 | 11,417 | 12 | 41,068 | 24 | |
| Physical activity | Inactive | 61,771 | 23 | 3155 | 26 | 18,658 | 20 | 43,113 | 25 |
| Moderately inactive | 88,907 | 34 | 3753 | 31 | 29,062 | 31 | 59,845 | 35 | |
| Moderately active | 60,548 | 23 | 2531 | 21 | 22,015 | 24 | 38,533 | 22 | |
| Active | 53,680 | 20 | 2491 | 21 | 23,052 | 25 | 30,628 | 18 | |
| All | 10,524 | 100 | 469 | 100 | 3899 | 100 | 6625 | 100 | |
| Total to HDL cholesterol ratio (sex-specific fourths) |
< 3.79 (men), < 3.09 (women) | 2530 | 24 | 73 | 16 | 933 | 24 | 1597 | 24 |
| 3.79–4.64 (men), 3.09–3.76 (women) | 2531 | 24 | 96 | 20 | 921 | 24 | 1610 | 24 | |
| 4.64–5.73 (men), 3.76–4.69 (women) | 2517 | 24 | 118 | 25 | 920 | 24 | 1597 | 24 | |
| 5.73 + (men), 4.69 + (women) | 2503 | 24 | 159 | 34 | 923 | 24 | 1580 | 24 | |
| missing | 443 | 4 | 23 | 5 | 202 | 5 | 241 | 4 | |
| Glycated haemoglobin (%) (sex-specific fourths) | < 5.26 | 3121 | 30 | 120 | 26 | 1154 | 30 | 1967 | 30 |
| 5.26–5.54 (men), 5.26–5.44 (women) | 2543 | 24 | 100 | 21 | 1156 | 30 | 1387 | 21 | |
| 5.54–5.72 (men), 5.44–5.72 (women) | 2354 | 22 | 96 | 20 | 619 | 16 | 1735 | 26 | |
| 5.72 + | 2399 | 23 | 142 | 30 | 934 | 24 | 1465 | 22 | |
| missing | 107 | 1 | 11 | 2 | 36 | 1 | 71 | 1 | |
Hazard ratios
The HRs for premature mortality are presented in Table 2. After mutual adjustment for all risk factors, over a two-fold greater risk was observed for current smokers when compared with never smokers for both men (HR, 2.54; 95 % CI, 2.36–2.73) and women (HR, 2.14; 95 % CI, 2.01–2.29), with former smokers having an intermediate risk. When compared with the physically inactive group, being physically very active was associated with substantially lower mortality rates for men (HR, 0.73; 95 % CI, 0.68–0.78) and women (HR, 0.69; 95 % CI, 0.64–0.76). Men and women with a ‘healthy’ diet had 22 % (HR, 0.78; 95 % CI, 0.69–0.88) and 25 % (HR, 0.75; 95 % CI, 0.67–0.83) lower mortality rates, respectively, when compared with the ‘unhealthy’ diet groups. J-shaped relationships between alcohol consumption at baseline and mortality were observed for men and women, with the highest mortality rates found for the highest consumers (>6 drinks/day for women; HR, 1.63; 95 % CI, 1.31–2.04 and > 10 drinks/day for men; HR, 2.38; 95 % CI, 2.02–2.79) when compared with the moderate alcohol consumption reference group (1–2 drinks per day). For BMI (unadjusted for WHR), when compared with the 22–24.9 reference group, higher mortality rates were observed for the extreme high (35+: men, HR, 1.77; 95 % CI, 1.50–2.09; women, HR, 1.40; 95 % CI, 1.20–1.63) and low (<20: men, HR, 1.76; 95 % CI, 1.54–2.01; women, HR, 1.55; 95 % CI, 1.38–1.75) BMI groups. For WHR (unadjusted for BMI), when the highest and lowest fifths were compared, 39 % (HR, 1.39; 95 % CI, 1.28–1.51) and 52 % (HR, 1.52; 95 % CI, 1.39–1.65) higher premature mortality rates were observed for women and men, respectively. Participants with hypertension also had higher premature mortality rates than those with normal blood pressure levels, with an increasing gradient for hypertension level 1 (HR, 1.17; 95 % CI, 1.09–1.25) and level 2 (HR, 1.52; 95 % CI, 1.40–1.64).
Table 2.
Hazard ratios and confidence intervals for death prior to age 70 years in the EPIC cohort
| Overall | Women | Men | |||||||||||
|---|---|---|---|---|---|---|---|---|---|---|---|---|---|
| Model 1 | Model 2 | Model 1 | Model 2 | Model 1 | Model 2 | ||||||||
| HR | (95 % CI) | HR | (95 % CI) | HR | (95 % CI) | HR | (95 % CI) | HR | (95 % CI) | HR | (95 % CI) | ||
| Smoking status | Never | 1.00 | 1.00 | 1.00 | 1.00 | 1.00 | 1.00 | ||||||
| Former | 1.39 | (1.32–1.46) | 1.37 | (1.30–1.43) | 1.30 | (1.21–1.39) | 1.29 | (1.20–1.38) | 1.47 | (1.36–1.58) | 1.43 | (1.32–1.54) | |
| Smoker | 2.38 | (2.27–2.50) | 2.36 | (2.25–2.48) | 2.16 | (2.03–2.30) | 2.14 | (2.01–2.29) | 2.57 | (2.39–2.77) | 2.54 | (2.36–2.73) | |
| Physical activity | Inactive | 1.00 | 1.00 | 1.00 | 1.00 | 1.00 | 1.00 | ||||||
| Moderately inactive | 0.78 | (0.74–0.82) | 0.79 | (0.75–0.82) | 0.78 | (0.73–0.84) | 0.79 | (0.73–0.84) | 0.77 | (0.72–0.82) | 0.77 | (0.72–0.83) | |
| Moderately active | 0.75 | (0.71–0.79) | 0.75 | (0.71–0.79) | 0.72 | (0.66–0.78) | 0.72 | (0.67–0.78) | 0.76 | (0.70–0.82) | 0.77 | (0.71–0.83) | |
| Active | 0.71 | (0.67–0.75) | 0.72 | (0.68–0.76) | 0.69 | (0.64–0.75) | 0.69 | (0.64–0.76) | 0.72 | (0.67–0.77) | 0.73 | (0.68–0.78) | |
| Diet | Unhealthy | 1.00 | 1.00 | 1.00 | 1.00 | 1.00 | 1.00 | ||||||
| Moderately unhealthy | 0.87 | (0.82–0.92) | 0.88 | (0.83–0.93) | 0.85 | (0.77–0.93) | 0.85 | (0.77–0.93) | 0.88 | (0.82–0.94) | 0.89 | (0.83–0.95) | |
| Moderately healthy | 0.80 | (0.75–0.85) | 0.81 | (0.76–0.87) | 0.78 | (0.70–0.86) | 0.79 | (0.71–0.87) | 0.80 | (0.74–0.88) | 0.82 | (0.75–0.90) | |
| Healthy | 0.75 | (0.70–0.81) | 0.77 | (0.72–0.83) | 0.73 | (0.66–0.82) | 0.75 | (0.67–0.83) | 0.76 | (0.67–0.85) | 0.78 | (0.69–0.88) | |
| Alcohol intake (drinks/day) | 0 | 1.58 | (1.47–1.70) | 1.58 | (1.47–1.70) | 1.46 | (1.33–1.61) | 1.46 | (1.32–1.60) | 1.90 | (1.70–2.12) | 1.91 | (1.71–2.14) |
| 0–0.5 | 1.17 | (1.10–1.25) | 1.18 | (1.11–1.25) | 1.13 | (1.04–1.22) | 1.13 | (1.04–1.22) | 1.26 | (1.14–1.38) | 1.27 | (1.15–1.39) | |
| 0.5–1 | 1.00 | 1.00 | 1.00 | 1.00 | 1.00 | 1.00 | |||||||
| 1–2 | 0.97 | (0.91–1.04) | 0.97 | (0.91–1.04) | 0.98 | (0.90–1.08) | 0.98 | (0.89–1.08) | 0.97 | (0.89–1.07) | 0.97 | (0.88–1.07) | |
| 2–6 | 1.07 | (1.00–1.14) | 1.06 | (1.00–1.13) | 1.16 | (1.05–1.27) | 1.15 | (1.04–1.26) | 1.04 | (0.96–1.14) | 1.03 | (0.95–1.13) | |
| > 6 (women), 6–10 (men) | 1.51 | (1.38–1.66) | 1.47 | (1.34–1.62) | 1.72 | (1.38–2.15) | 1.63 | (1.31–2.04) | 1.48 | (1.32–1.65) | 1.45 | (1.29–1.62) | |
| > 10 (men) | 2.47 | (2.12–2.88) | 2.40 | (2.06–2.79) | 2.43 | (2.07–2.85) | 2.38 | (2.02–2.79) | |||||
| Blood pressure | Normal | 1.00 | 1.00 | 1.00 | 1.00 | 1.00 | 1.00 | ||||||
| Pre-hypertension | 1.03 | (0.97–1.09) | 0.99 | (0.93–1.04) | 1.04 | (0.96–1.11) | 1.00 | (0.93–1.07) | 1.04 | (0.95–1.14) | 0.99 | (0.90–1.08) | |
| Hypertension 1 | 1.19 | (1.12–1.26) | 1.12 | (1.06–1.19) | 1.16 | (1.07–1.26) | 1.10 | (1.02–1.19) | 1.24 | (1.13–1.37) | 1.15 | (1.05–1.27) | |
| Hypertension. 2 | 1.56 | (1.46–1.67) | 1.45 | (1.36–1.55) | 1.50 | (1.37–1.65) | 1.42 | (1.29–1.55) | 1.63 | (1.47–1.81) | 1.50 | (1.36–1.66) | |
| BMI (kg/m2) | < 20 | 1.62 | (1.48–1.76) | 1.47 | (1.33–1.63) | 1.98 | (1.70–2.30) | ||||||
| 20–21.9 | 1.17 | (1.09–1.25) | 1.10 | (1.01–1.20) | 1.25 | (1.13–1.40) | |||||||
| 22–24.9 (reference) | 1.00 | 1.00 | 1.00 | ||||||||||
| 25–29.9 (overweight) | 0.98 | (0.94–1.03) | 1.03 | (0.96–1.10) | 0.97 | (0.91–1.03) | |||||||
| 30–34.9 (obese) | 1.16 | (1.09–1.23) | 1.05 | (0.95–1.15) | 1.26 | (1.16–1.37) | |||||||
| 35+ (very obese) | 1.61 | (1.47–1.76) | 1.55 | (1.38–1.75) | 1.76 | (1.54–2.01) | |||||||
| Waist-to-hip ratio (fifths) | 1 | 1.00 | 1.00 | 1.00 | |||||||||
| 2 | 1.01 | (0.95–1.07) | 1.00 | (0.91–1.09) | 1.03 | (0.95–1.13) | |||||||
| 3 | 1.02 | (0.96–1.08) | 0.99 | (0.92–1.08) | 1.06 | (0.97–1.15) | |||||||
| 4 | 1.19 | (1.11–1.26) | 1.15 | (1.05–1.25) | 1.24 | (1.13–1.36) | |||||||
| 5 | 1.44 | (1.36–1.53) | 1.39 | (1.28–1.51) | 1.52 | (1.39–1.65) | |||||||
Estimates from flexible parametric survival models with attained age as the time-scale. Models included all listed covariates, as well as age at baseline attendance and country of recruitment. Overall estimates are also adjusted for sex. Model 1 includes BMI, whereas Model 2 includes waist-to-hip ratio as a measure of adiposity. Model 1 and Model 2 are otherwise identical
Attributable fractions
Attributable fractions (AF) for premature mortality were calculated overall and by sex, and also for never smokers and current smokers separately (Table 3). Given the monotonic association between mortality and WHR, this was used as the primary measure of overweight and obesity, although all results were calculated using BMI also. The AF calculations represent “best-case” estimates based on the hypothetical removal of risk-elevating factors from the population entirely.
Table 3.
Population attributable fractions of deaths prior to age 70 given the distribution of covariates in the EPIC cohort, using waist-to-hip ratio to assess for obesity
| All participants | Never smokers | Current smokers | |||||
|---|---|---|---|---|---|---|---|
| Covariatea | Overallb | Cumulativec | Overallb | Cumulativec | Overallb | Cumulativec | |
| Women and Men | Smoking | 0.31 (0.31–0.32) | 0.31 (0.31–0.32) | – | – | 0.56 (0.55–0.56) | 0.56 (0.55–0.56) |
| Diet | 0.14 (0.12–0.16) | 0.41 (0.39–0.43) | 0.12 (0.10–0.14) | 0.12 (0.10–0.14) | 0.16 (0.13–0.18) | 0.63 (0.62–0.64) | |
| Overweight and obesity (WHR) | 0.10 (0.08–0.12) | 0.47 (0.45–0.49) | 0.10 (0.08–0.11) | 0.21 (0.18–0.23) | 0.10 (0.08–0.12) | 0.67 (0.66–0.68) | |
| High blood pressure | 0.09 (0.07–0.11) | 0.52 (0.50–0.54) | 0.09 (0.08–0.11) | 0.28 (0.25–0.31) | 0.08 (0.07–0.10) | 0.70 (0.69–0.71) | |
| Physical inactivity | 0.07 (0.05–0.09) | 0.56 (0.54–0.57) | 0.08 (0.06–0.10) | 0.34 (0.31–0.36) | 0.07 (0.05–0.09) | 0.72 (0.71–0.74) | |
| Alcohol intake | 0.04 (0.03–0.04) | 0.57 (0.55–0.59) | 0.02 (0.01–0.02) | 0.35 (0.32–0.37) | 0.05 (0.04–0.06) | 0.74 (0.73–0.75) | |
| Combined | 0.57 (0.55–0.59) | 0.35 (0.32–0.37) | 0.74 (0.73–0.75) | ||||
| Women | Smoking | 0.26 (0.25–0.26) | 0.26 (0.25–0.26) | – | – | 0.55 (0.54–0.55) | 0.55 (0.54–0.55) |
| Diet | 0.14 (0.11–0.16) | 0.36 (0.33–0.38) | 0.12 (0.09–0.15) | 0.12 (0.09–0.15) | 0.16 (0.13–0.19) | 0.62 (0.60–0.63) | |
| Overweight and obesity (WHR) | 0.07 (0.05–0.09) | 0.40 (0.38–0.43) | 0.07 (0.05–0.09) | 0.18 (0.15–0.22) | 0.07 (0.05–0.10) | 0.65 (0.63–0.66) | |
| High blood pressure | 0.10 (0.07–0.12) | 0.46 (0.43–0.48) | 0.11 (0.08–0.13) | 0.27 (0.23–0.30) | 0.09 (0.07–0.11) | 0.68 (0.66–0.70) | |
| Physical inactivity | 0.06 (0.03–0.09) | 0.49 (0.46–0.52) | 0.07 (0.03–0.10) | 0.32 (0.28–0.35) | 0.06 (0.03–0.09) | 0.70 (0.68–0.72) | |
| Alcohol intake | 0.02 (0.01–0.03) | 0.50 (0.47–0.53) | 0.01 (0.01–0.02) | 0.32 (0.28–0.36) | 0.03 (0.02–0.04) | 0.71 (0.69–0.72) | |
| Combined | 0.50 (0.47–0.53) | 0.32 (0.28–0.36) | 0.71 (0.69–0.72) | ||||
| Men | Smoking | 0.37 (0.35–0.38) | 0.37 (0.35–0.38) | – | – | 0.57 (0.56–0.57) | 0.57 (0.56–0.57) |
| Diet | 0.13 (0.09–0.17) | 0.45 (0.43–0.48) | 0.13 (0.09–0.17) | 0.13 (0.09–0.17) | 0.14 (0.10–0.18) | 0.63 (0.61–0.65) | |
| Overweight and obesity (WHR) | 0.13 (0.11–0.16) | 0.53 (0.50–0.55) | 0.12 (0.09–0.14) | 0.23 (0.19–0.27) | 0.13 (0.11–0.16) | 0.69 (0.67–0.70) | |
| High blood pressure | 0.08 (0.05–0.12) | 0.57 (0.54–0.60) | 0.08 (0.05–0.12) | 0.29 (0.25–0.34) | 0.07 (0.04–0.11) | 0.71 (0.69–0.73) | |
| Physical inactivity | 0.07 (0.05–0.10) | 0.60 (0.57–0.63) | 0.07 (0.05–0.10) | 0.35 (0.30–0.39) | 0.07 (0.05–0.10) | 0.74 (0.72–0.75) | |
| Alcohol intake | 0.06 (0.05–0.07) | 0.63 (0.60–0.65) | 0.04 (0.02–0.05) | 0.37 (0.32–0.41) | 0.07 (0.06–0.09) | 0.76 (0.74–0.77) | |
| Combined | 0.63 (0.60–0.65) | 0.37 (0.32–0.41) | 0.76 (0.74–0.77) | ||||
aAttributable fractions were calculated based on the difference in expected cumulative risk given the observed covariate distributions in EPIC and the expected cumulative risk under the following scenarios. Smoking: A population of never smokers. Diet: A population of people in the healthy category. Blood pressure: A population of people with normal blood pressure. High alcohol intake: A population who drink at most 1–2 drinks per day. Physical activity: A population of people in the active category. Overweight and obesity: A population of people with WHR below the lowest sex-specific quintile. These attributable risks thus represent a “best-case”, in that they are calculated based on a hypothetical reference population with risk factors removed entirely
bEstimated using predictions from a model mutually adjusted for all listed covariates as well as age at baseline. Attributable fractions are based on modifying one covariate at a time, with the distribution of the remaining covariates left as observed in EPIC
cThe cumulative attributable fraction after the sequential addition of each covariate
The AF for smoking was 31 % (26 % among women, 37 % among men, and 56 % among current smokers overall; Table 3). For diet and WHR the AF was 14 % and 10 %, respectively. Overall, 9 % of premature deaths were attributed to high blood pressure, and the AFs for physical inactivity and high alcohol intake were 7 % and 4 %, respectively. The role of alcohol was more important among men than women (6 % vs. 2 %). When BMI was used instead of WHR, the effect of being overweight/obese was less apparent, with the AF estimated to be 3 % (Additional file 1: Table S3).
Because these risk factors co-vary to a large degree, it is not possible to sum up the AF estimates to come to an overall estimate. We can derive such an estimate by removing the effect of each risk factor consecutively, yielding a cumulative AF for a combination of risk factors. After accounting for the fraction of premature deaths attributable to smoking, an additional 10 % can be attributed to poor diet. Beyond this, an additional 6 % were attributed to overweight and obesity (WHR), and 5 % to high blood pressure (Table 3). Overall, 52 % of all premature deaths can be attributed to these four factors. The two remaining factors (physical activity and alcohol intake) added an additional 5 %, resulting in a total AF of 57 %. The AF for premature mortality for all six exposures was 74 % among current smokers (56 % smoking) and 35 % among never smokers. The attributable fractions were similar for deaths prior to age 65 (Additional file 2: Table S4) and 75 years (Additional file 8: Table S5), and remained similar in sensitivity analyses including all participants with missing blood pressure (Additional file 9: Table S6).
Survival curves
To estimate the effect that these risk factors can have on expected survival at an individual level, we compared survival curves for current smokers and non-smokers after further stratifying by whether they had otherwise “healthy” or “unhealthy” characteristics (Fig. 1). ‘Healthy’ was defined as a BMI of 22–25, having normal blood pressure, being moderately physically active, eating a healthy diet, and drinking one to two drinks per day. “Unhealthy” was defined as a BMI of 30–35, being physically inactive, eating an unhealthy diet, being hypertensive, and consuming more than two drinks per day. Comparison of the four groups indicated that 96 % of “healthy” non-smoking women (95 % CI, 96–97 %) and 95 % of “healthy” non-smoking men (95 % CI, 94–96 %) could be expected to survive to 70. Conversely, only 64 % (95 % CI, 60–67 %) and 79 % (95 % CI, 76–82 %) of smoking men and women with additional unhealthy characteristics, respectively, could be expected to live to this age. The two intermediate groups, smokers with otherwise healthy characteristics and ‘unhealthy’ non-smokers, had similar expected survival.
Fig. 1.
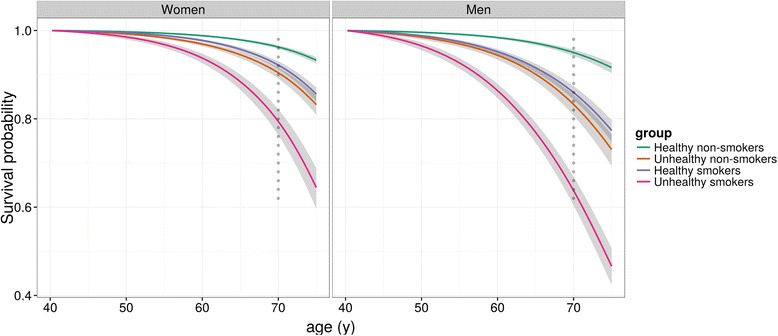
Model-based survival curves by smoking status and other individual factors. “Healthy” participants are those with a body mass index (BMI) of 22–25 who are moderately active, have normal blood pressure, eat a healthy diet, and drink one to two drinks per day. “Unhealthy” participants are those with a BMI of 30–35 who are inactive, hypertensive, eat an unhealthy diet, and consume more than two drinks per day
Cholesterol and glycated haemoglobin
Based on the EPIC-Biomarkers sub-cohort of 10,524 individuals, including 469 premature deaths, an increased risk of premature mortality was seen across all four categories of TC:HDL (Additional file 10: Table S7), reaching a 63 % increase in the fourth (highest) compared with the first (lowest) quartile. Based on this modest sample size, the AF for TC:HDL was estimated to be 15 % (95 % CI, 7–23 %). Conversely, no apparent increase in risk was observed for higher levels of HbA1c.
Discussion
Our analysis of the primary causes of premature death among more than 250,000 European adults indicates that the four major risk factors are tobacco smoking, poor diet, obesity, and high blood pressure, which together account for over 50 % of premature deaths. Two other risk factors, physical inactivity and excessive alcohol consumption, have AFs of 7 % and 4 % of premature deaths, respectively. Our study also provides preliminary evidence for an important AF for high cholesterol levels, although the sample size was limited.
The GBD has derived similar estimates for the role of each exposure using an alternative modelling approach, relying largely on published estimates of effect for each exposure and estimates of exposure prevalence in each population [1]. Their estimates of AFs for premature mortality for the European population provide broadly comparable estimates for smoking, poor diet and high blood pressure (Table 4). However, the GBD estimates are approximately twice as high for excessive alcohol consumption (8 % vs. 4 %), and substantially higher for excessive body mass (14 % vs. 3 % based on BMI). Using WHR as a measure of obesity made the estimates more comparable (10 % based on WHR).
Table 4.
Comparison of population attributable fractions (%, 95 % CI) from the Global Burden of Diseases analysis with those from the present EPIC analysis
| GBD | EPIC | |
|---|---|---|
| Tobacco smoking | 25 (22–27) | 31 (31–32) |
| Dietary risks | 23 (21–26) | 14 (12–16) |
| High blood pressure | 15 (13–17) | 9 (7–11) |
| High body mass index | 14 (12–15) | 3 (2–5) |
| High waist-to-hip ratio | – | 10 (8–12) |
| Physical inactivity and low physical activity | 9 (8–11) | 7 (5–9) |
| High alcohol use | 8 (7–9) | 4 (3–4) |
Estimates from the GBD are taken from the website http://vizhub.healthdata.org/gbd-compare. They are the estimated attributable fractions for death in Western Europe for the age range 50–69 years for each risk factor
There are three possible explanations for these differences. Firstly, the estimates of relative risk used in the calculations might differ – indeed, we estimated modest relative risks for overweight and obesity and physical inactivity. Secondly, the distribution of the risk factors used for the GBD computations might differ from the distribution in EPIC which, for example, includes relatively few very heavy consumers of alcohol or very obese participants. This is a well-known phenomenon in prospective cohort studies, also called “healthy volunteer” effect. Finally, the reference or counterfactual distributions used for the AF calculations might differ. For instance, the GBD used a “theoretical minimum-risk exposure distribution”. On the other hand, we have chosen to not necessarily use a theoretically “optimal” exposure distribution in all cases. For instance, using the lowest risk category for alcohol intake or BMI would involve an increase in alcohol intake or BMI in a proportion of the participants. Instead, we have focused on the AF for high alcohol intake and overweight and obesity per se. Low reported alcohol intake in particular is associated with substantially higher risk of death in EPIC, possibly due to the influence of former drinkers who quit for health reasons or misclassification of heavy drinkers [23, 27, 39]. This misclassification would lead to an underestimation of the AF for alcohol in the EPIC study, and – assuming that the GBD estimates do not suffer from the same problems – may explain the difference between the EPIC and GBD estimates in this case.
On an individual level, the estimated conditional survival curves suggest smoking could have a similar effect on survival to age 70 to that of all other factors combined. Men who were smokers but possessed otherwise healthy characteristics had expected survival of 86 %, similar to the 83 % expected survival for men with unhealthy characteristics but who never smoked. For women, both smokers with otherwise healthy characteristics and unhealthy non-smokers also had similar expected survival (92 % and 90 %, respectively). These estimates reinforce the critical importance of smoking in terms of preventing premature death, and suggest it is as important as the other five major risk factors combined.
A strength of our approach is the ability to estimate AFs for important sub-groups, such as smokers and never smokers, and also the direct estimation of AFs for combinations of risk allowing for their interdependence. Interestingly, our results indicate that, for both current and never smokers, an equivalent proportion of premature deaths can be attributed to poor diet, hypertension, overweight and obesity, and physically inactivity.
The principal limitation of our study is the relatively small number of participants with available cholesterol and HbA1c measurements, leading to imprecise estimates of relative risks, prevalence, and AF for these factors. Further, given that all exposures were assessed only once at recruitment to the study, we could not assess the potential effects of changing exposures over time, such as quitting smoking, gaining or losing weight, or increasing physical activity. As such, our estimated AFs and survival functions cannot be interpreted as the expected effects on mortality if individuals were to change their lifestyle or diet, but rather reflect comparisons of individuals with a given, constant pattern of exposures, or hypothetical scenarios in which no-one in the population is exposed to a given risk factor. Similarly, with only one assessment of exposure we cannot assess the potential effects of measurement error, which are unlikely to be equal across the six factors (e.g. BMI and blood pressure are subject to only modest measurement error, especially compared with self-reported diet and physical activity), and can lead to under- or overestimates of the risk associated with specific risk factors. Finally, the participants in EPIC are not representative of the general European population and may have a different distribution of risk factors than other target populations. In addition to the participants not being a representative sample of any population at baseline, during the follow-up period, the participants have aged, so estimates presented here do not strictly represent the age group 40 to 70.
We choose to include individuals who reported a prevalent chronic disease condition at baseline (e.g. diabetes, heart disease, angina, or a previous diagnosis of cancer), as such a sample would be more representative of the underlying population. Excluding the 7 % of the cohort who did report a prevalent chronic disease at baseline did not have any substantial effect on our results. As an additional sensitivity analysis to evaluate the possibility of sick individuals changing their lifestyle habits relatively recently prior to interview, we also excluded the first 4 years of follow-up. Again, this exclusion did not substantially affect the results.
Conclusions
In summary, we used individual level data from a large European prospective cohort study to estimate the relative contributions of various factors to premature mortality both on the population level and the individual level. While smoking remains the predominant risk factor for premature mortality in Europe, poor diet, obesity, and hypertension also have a substantial additional effect. We also provided an estimate of the incidence of death prior to age 70 years that could be expected among an otherwise healthy non-smoking population (about 4 %). Our results indicate that it is of public health importance to persist and extend the fight against smoking as well as to promote healthy behaviour, including better diet, avoidance of overweight/obesity, physical activity, and blood pressure and blood lipid control with the aim of minimising premature mortality.
Abbreviations
AF, attributable fraction; BMI, body mass index; CI, confidence interval; DBP, diastolic blood pressure; EPIC, European Prospective Investigation into Cancer and Nutrition; GBD, Global Burden of Diseases; HR, hazard ratio; SBP, systolic blood pressure; WHR, waist-to-hip ratio
ᅟ
ᅟ
Availability of data and materials
EPIC data are available for investigators who seek to answer important questions on health and disease in the context of research projects that are consistent with the legal and ethical standard practices of IARC/WHO and the EPIC Centres. The primary responsibility for accessing the data belongs to the EPIC centres that provided them. The use of a random sample of anonymised data from the EPIC study can be requested by contacting Dr Paul Brennan, gep@iarc.fr, who will issue the request to members of the EPIC Steering Committee for deliberation.
Authors’ contributions
Conception, design, analysis, and interpretation of data: DCM, NM, ER, PB. Acquisition of data: M-CB-R, RK, HB, KO, AA, K-TK, NJW, TJK, AT, CB, DP, RT, PV, SP, HBBdeM, PHP, EW, EL, ER. Writing or review of the manuscript: DCM, NM, ER, PB. MJ, PF, KKT, M-CB-R, FC-C, LD, KL, RK, CW, MB, HB, AT, KO, MLR, AA, EM-P, JMA, LC, EA, K-TK, NJW, TJK, RCT, CB, PO, AT, DP, VP, RT, PV, SP, HBB-d-M, EAS, PHP, GE, OM, MS, EW, GS, EL, TN, MG. All authors read and approved the final manuscript.
Competing interests
The authors declare that they no competing interests.
Ethics approval and consent to participate
This study complies with the Declaration of Helsinki. Ethical review boards of IARC and all local institutions where participants had been recruited gave approval for the study, and all participants gave written informed consent for data collection and storage, as well as individual follow-up.
Financial support
This work was supported by the French Social Affairs & Health Ministry, Department of Health (Direction Générale de la Santé). The work undertaken by David C Muller for this project was performed during the tenure of an IARC-Australia fellowship supported by Cancer Council Australia. Elio Riboli was supported by the Imperial College Biomedical Research Centre funded by the National Institute of Health Research of UK. The coordination of EPIC is financially supported by the European Commission (DG-SANCO) and the International Agency for Research on Cancer. The national cohorts are supported by Danish Cancer Society (Denmark); Ligue Contre le Cancer, Institut Gustave Roussy, Mutuelle Générale de l’Education Nationale, Institut National de la Santé et de la Recherche Médicale (INSERM) (France); Deutsche Krebshilfe, Deutsches Krebsforschungszentrum and Federal Ministry of Education and Research (Germany); the Hellenic Health Foundation (Greece); Associazione Italiana per la Ricerca sul Cancro-AIRC-Italy and National Research Council (Italy); Dutch Ministry of Public Health, Welfare and Sports (VWS), Netherlands Cancer Registry (NKR), LK Research Funds, Dutch Prevention Funds, Dutch ZON (Zorg Onderzoek Nederland), World Cancer Research Fund (WCRF), Statistics Netherlands (The Netherlands); Nordic Centre of Excellence programme on Food, Nutrition and Health. (Norway); Health Research Fund (FIS), PI13/00061 to Granada, Regional Governments of Andalucía, Asturias, Basque Country, Murcia (no. 6236) and Navarra, ISCIII RETIC (RD06/0020) (Spain); Swedish Cancer Society, Swedish Scientific Council and County Councils of Skåne and Västerbotten (Sweden); Cancer Research UK (14136 to EPIC-Norfolk; C570/A16491 to EPIC-Oxford), Medical Research Council (1000143 to EPIC-Norfolk) (United Kingdom).
The sponsors did not have any input into study design, study conduct, data collection, analysis, or interpretation nor did they influence the preparation, review, or approval of the manuscript.
Additional files
Population attributable fractions of deaths prior to age 65 years given the distribution of covariates in the EPIC cohort, using waist-to-hip ratio to assess for obesity. (PDF 75 kb)
Population attributable fractions of deaths prior to age 75 years given the distribution of covariates in the EPIC cohort, using waist-to-hip ratio to assess for obesity. (PDF 76 kb)
Supplementary Methods for “Modifiable causes of death in middle-age in Western Europe: results from the EPIC cohort study”. (PDF 100 kb)
Model-based survival functions for men and women in EPIC (coloured lines) and a random sample of Kaplan–Meier estimates of the survival function evaluated at failure times (grey dots). Survival to age 70 years in the EU in general was estimated to be 0.89 for women and 0.80 for men (using mortality rates from 2006–2010 obtained from http://ec.europa.eu/eurostat). (TIFF 402 kb)
Model -based survival functions for each country in EPIC, by sex and smoking status. (TIFF 824 kb)
Number of participants in the EPIC cohort: overall, for premature deaths (prior to age 70 years), by country of recruitment and sex. (PDF 32 kb)
Attributable fractions of deaths prior to age 70 years given the distribution of covariates in the EPIC cohort, using body mass index to assess overweight and obesity. (PDF 49 kb)
Hazard ratios and confidence intervals for death prior to age 70 years in the EPIC cohort. (PDF 76 kb)
Sensitivity analysis including all participants with missing blood pressure. Population attributable fractions of deaths prior to age 70 years given the distribution of covariates in the EPIC cohort, using waist-to-hip ratio to assess for obesity. (PDF 75 kb)
Hazard ratios and confidence intervals for death prior to age 70 years in the EPIC cohort. (PDF 42 kb)
References
- 1.GBD 2013 Mortality and Causes of Death Collaborators. Global, regional, and national age-sex specific all-cause and cause-specific mortality for 240 causes of death, 1990–2013: a systematic analysis for the Global Burden of Disease Study 2013. Lancet. 2015;385(9963):117–71. [DOI] [PMC free article] [PubMed]
- 2.Life expectancy by age and sex - Eurostat. http://ec.europa.eu/eurostat/web/products-datasets/-/proj_13nalexp. 29 April 2015.
- 3.GBD Data. http://www.healthdata.org/gbd/data. 29 April 2015.
- 4.Lim SS, Vos T, Flaxman AD, et al. A comparative risk assessment of burden of disease and injury attributable to 67 risk factors and risk factor clusters in 21 regions, 1990–2010: a systematic analysis for the Global Burden of Disease Study 2010. Lancet. 2012;380(9859):2224–2260. doi: 10.1016/S0140-6736(12)61766-8. [DOI] [PMC free article] [PubMed] [Google Scholar]
- 5.Peto R, Boreham J, Lopez AD, Thun M, Heath C. Mortality from tobacco in developed countries: indirect estimation from national vital statistics. Lancet. 1992;339(8804):1268–1278. doi: 10.1016/0140-6736(92)91600-D. [DOI] [PubMed] [Google Scholar]
- 6.Danaei G, Ding EL, Mozaffarian D, et al. The preventable causes of death in the United States: comparative risk assessment of dietary, lifestyle, and metabolic risk factors. PLoS Med. 2009;6(4):e1000058. doi: 10.1371/journal.pmed.1000058. [DOI] [PMC free article] [PubMed] [Google Scholar]
- 7.Doll R, Peto R, Boreham J, Sutherland I. Mortality in relation to smoking: 50 years’ observations on male British doctors. BMJ. 2004;328(7455):1519. doi: 10.1136/bmj.38142.554479.AE. [DOI] [PMC free article] [PubMed] [Google Scholar]
- 8.Pirie K, Peto R, Reeves GK, Green J, Beral V. The 21st century hazards of smoking and benefits of stopping: a prospective study of one million women in the UK. Lancet. 2013;381(9861):133–141. doi: 10.1016/S0140-6736(12)61720-6. [DOI] [PMC free article] [PubMed] [Google Scholar]
- 9.Ikeda N, Inoue M, Iso H, et al. Adult mortality attributable to preventable risk factors for non-communicable diseases and injuries in Japan: a comparative risk assessment. PLoS Med. 2012;9(1):e1001160. doi: 10.1371/journal.pmed.1001160. [DOI] [PMC free article] [PubMed] [Google Scholar]
- 10.Vergnaud A-C, Romaguera D, Peeters PH, et al. Adherence to the World Cancer Research Fund/American Institute for Cancer Research guidelines and risk of death in Europe: results from the European Prospective Investigation into Nutrition and Cancer cohort study. Am J Clin Nutr. 2013;97(5):1107–1120. doi: 10.3945/ajcn.112.049569. [DOI] [PubMed] [Google Scholar]
- 11.Romaguera D, Vergnaud A-C, Peeters PH, et al. Is concordance with World Cancer Research Fund/American Institute for Cancer Research guidelines for cancer prevention related to subsequent risk of cancer? Results from the EPIC study. Am J Clin Nutr. 2012;96(1):150–163. doi: 10.3945/ajcn.111.031674. [DOI] [PubMed] [Google Scholar]
- 12.Heidemann C, Schulze MB, Franco OH, van Dam RM, Mantzoros CS, Hu FB. Dietary patterns and risk of mortality from cardiovascular disease, cancer, and all causes in a prospective cohort of women. Circulation. 2008;118(3):230–237. doi: 10.1161/CIRCULATIONAHA.108.771881. [DOI] [PMC free article] [PubMed] [Google Scholar]
- 13.Prospective Studies Collaboration Age-specific relevance of usual blood pressure to vascular mortality: a meta-analysis of individual data for one million adults in 61 prospective studies. Lancet. 2002;360(9349):1903–1913. doi: 10.1016/S0140-6736(02)11911-8. [DOI] [PubMed] [Google Scholar]
- 14.Renehan AG, Tyson M, Egger M, Heller RF, Zwahlen M. Body-mass index and incidence of cancer: a systematic review and meta-analysis of prospective observational studies. Lancet. 2008;371(9612):569–578. doi: 10.1016/S0140-6736(08)60269-X. [DOI] [PubMed] [Google Scholar]
- 15.Prospective Studies Collaboration. Whitlock G, Lewington S, Sherliker P, et al. Body-mass index and cause-specific mortality in 900 000 adults: collaborative analyses of 57 prospective studies. Lancet. 2009;373(9669):1083–1096. doi: 10.1016/S0140-6736(09)60318-4. [DOI] [PMC free article] [PubMed] [Google Scholar]
- 16.Katzmarzyk PT, Janssen I, Ardern CI. Physical inactivity, excess adiposity and premature mortality. Obes Rev. 2003;4(4):257–290. doi: 10.1046/j.1467-789X.2003.00120.x. [DOI] [PubMed] [Google Scholar]
- 17.Berrington de Gonzalez A, Hartge P, Cerhan JR, et al. Body-mass index and mortality among 1.46 million white adults. N Engl J Med. 2010;363(23):2211–9. [DOI] [PMC free article] [PubMed]
- 18.Pischon T, Boeing H, Hoffmann K, et al. General and abdominal adiposity and risk of death in Europe. N Engl J Med. 2008;359(20):2105–2120. doi: 10.1056/NEJMoa0801891. [DOI] [PubMed] [Google Scholar]
- 19.Pekkanen J, Nissinen A, Marti B, Tuomilehto J, Punsar S, Karvonen M. Reduction of premature mortality by high physical activity: A 20-year follow-up of middle-aged Finnish men. Lancet. 1987;329(8548):1473–1477. doi: 10.1016/S0140-6736(87)92218-5. [DOI] [PubMed] [Google Scholar]
- 20.Loef M, Walach H. The combined effects of healthy lifestyle behaviors on all cause mortality: a systematic review and meta-analysis. Prev Med. 2012;55(3):163–170. doi: 10.1016/j.ypmed.2012.06.017. [DOI] [PubMed] [Google Scholar]
- 21.Byberg L, Melhus H, Gedeborg R, et al. Total mortality after changes in leisure time physical activity in 50 year old men: 35 year follow-up of population based cohort. BMJ. 2009;338:b688. doi: 10.1136/bmj.b688. [DOI] [PMC free article] [PubMed] [Google Scholar]
- 22.Ekelund U, Ward HA, Norat T, et al. Physical activity and all-cause mortality across levels of overall and abdominal adiposity in European men and women: the European Prospective Investigation into Cancer and Nutrition Study (EPIC) Am J Clin Nutr. 2015;101:613–621. doi: 10.3945/ajcn.114.100065. [DOI] [PMC free article] [PubMed] [Google Scholar]
- 23.Ferrari P, Licaj I, Muller DC, et al. Lifetime alcohol use and overall and cause-specific mortality in the European Prospective Investigation into Cancer and nutrition (EPIC) study. BMJ Open. 2014;4(7):e005245. doi: 10.1136/bmjopen-2014-005245. [DOI] [PMC free article] [PubMed] [Google Scholar]
- 24.Duffy JC. Alcohol consumption and all-cause mortality. Int J Epidemiol. 1995;24(1):100–105. doi: 10.1093/ije/24.1.100. [DOI] [PubMed] [Google Scholar]
- 25.Corrao G, Bagnardi V, Zambon A, La Vecchia C. A meta-analysis of alcohol consumption and the risk of 15 diseases. Prev Med. 2004;38(5):613–619. doi: 10.1016/j.ypmed.2003.11.027. [DOI] [PubMed] [Google Scholar]
- 26.Di Castelnuovo A, Costanzo S, Bagnardi V, Donati M, Iacoviello L, de Gaetano G. Alcohol dosing and total mortality in men and women: An updated meta-analysis of 34 prospective studies. Arch Intern Med. 2006;166(22):2437–2445. doi: 10.1001/archinte.166.22.2437. [DOI] [PubMed] [Google Scholar]
- 27.Bergmann MM, Rehm J, Klipstein-Grobusch K, et al. The association of pattern of lifetime alcohol use and cause of death in the European Prospective Investigation into Cancer and Nutrition (EPIC) study. Int J Epidemiol. 2013;42(6):1772–1790. doi: 10.1093/ije/dyt154. [DOI] [PMC free article] [PubMed] [Google Scholar]
- 28.Prospective Studies Collaboration Blood cholesterol and vascular mortality by age, sex, and blood pressure: a meta-analysis of individual data from 61 prospective studies with 55,000 vascular deaths. Lancet. 2007;370(9602):1829–1839. doi: 10.1016/S0140-6736(07)61778-4. [DOI] [PubMed] [Google Scholar]
- 29.Stamler J, Daviglus ML, Garside DB, Dyer AR, Greenland P, Neaton JD. Relationship of baseline serum cholesterol levels in 3 large cohorts of younger men to long-term coronary, cardiovascular, and all-cause mortality and to longevity. JAMA. 2000;284(3):311–318. doi: 10.1001/jama.284.3.311. [DOI] [PubMed] [Google Scholar]
- 30.Khaw K-T, Wareham N, Luben R, et al. Glycated haemoglobin, diabetes, and mortality in men in Norfolk cohort of European Prospective Investigation of Cancer and Nutrition (EPIC-Norfolk) BMJ. 2001;322(7277):15. doi: 10.1136/bmj.322.7277.15. [DOI] [PMC free article] [PubMed] [Google Scholar]
- 31.The Emerging Risk Factors Collaboration Diabetes mellitus, fasting blood glucose concentration, and risk of vascular disease: a collaborative meta-analysis of 102 prospective studies. Lancet. 2010;375(9733):2215–2222. doi: 10.1016/S0140-6736(10)60484-9. [DOI] [PMC free article] [PubMed] [Google Scholar]
- 32.Selvin E, Steffes MW, Zhu H, et al. Glycated hemoglobin, diabetes, and cardiovascular risk in nondiabetic adults. N Engl J Med. 2010;362(9):800–811. doi: 10.1056/NEJMoa0908359. [DOI] [PMC free article] [PubMed] [Google Scholar]
- 33.Riboli E, Kaaks R. The EPIC Project: rationale and study design. European Prospective Investigation into Cancer and Nutrition. Int J Epidemiol. 1997;26 Suppl 1:S6. [DOI] [PubMed]
- 34.Riboli E, Hunt K, Slimani N, et al. European Prospective Investigation into Cancer and Nutrition (EPIC): study populations and data collection. Public Health Nutr. 2002;5(6b):1113–1124. doi: 10.1079/PHN2002394. [DOI] [PubMed] [Google Scholar]
- 35.Wareham NJ, Jakes RW, Rennie KL, et al. Validity and repeatability of a simple index derived from the short physical activity questionnaire used in the European Prospective Investigation into Cancer and Nutrition (EPIC) study. Public Health Nutr. 2003;6(04):407–413. doi: 10.1079/PHN2002439. [DOI] [PubMed] [Google Scholar]
- 36.National High Blood Pressure Education Program. Classification of Blood Pressure - The Seventh Report of the Joint National Committee on Prevention, Detection, Evaluation, and Treatment of High Blood Pressure. U.S. Department of Health And Human Services, National Institutes of Health, National Heart, Lung, and Blood Institute. 2004. http://www.nhlbi.nih.gov/files/docs/guidelines/jnc7full.pdf. [PubMed]
- 37.Royston P, Parmar MKB. Flexible parametric proportional-hazards and proportional-odds models for censored survival data, with application to prognostic modelling and estimation of treatment effects. Stat Med. 2002;21(15):2175–2197. doi: 10.1002/sim.1203. [DOI] [PubMed] [Google Scholar]
- 38.Royston P, Lambert PC. Flexible parametric survival analysis using Stata: beyond the Cox model. College Station, TX: StataCorp LP; 2011. [Google Scholar]
- 39.Fillmore KM, Stockwell T, Chikritzhs T, Bostrom A, Kerr W. Moderate alcohol use and reduced mortality risk: systematic error in prospective studies and new hypotheses. Ann Epidemiol. 2007;17(5 Suppl):S16–S23. doi: 10.1016/j.annepidem.2007.01.005. [DOI] [PubMed] [Google Scholar]
Associated Data
This section collects any data citations, data availability statements, or supplementary materials included in this article.
Data Availability Statement
EPIC data are available for investigators who seek to answer important questions on health and disease in the context of research projects that are consistent with the legal and ethical standard practices of IARC/WHO and the EPIC Centres. The primary responsibility for accessing the data belongs to the EPIC centres that provided them. The use of a random sample of anonymised data from the EPIC study can be requested by contacting Dr Paul Brennan, gep@iarc.fr, who will issue the request to members of the EPIC Steering Committee for deliberation.