

Abstract
Background
Neuroimaging of drug-associated cue presentations has aided in understanding the neurobiological substrates of craving and relapse for cocaine, alcohol, and nicotine. However, imaging of cue-reactivity in methamphetamine addiction has been much less studied.
Method
Nine caucasian male methamphetamine-dependent subjects and nine healthy controls were scanned in a Phillips 3.0T MRI scan when they viewed a randomized presentation of visual cues of methamphetamine, neutral objects, and rest conditions. Functional Imaging data were analyzed with Statistical Parametric Mapping software 5 (SPM 5)
Results
Methamphetamine subjects had significant brain activation in the ventral striatum and medial frontal cortex in comparison to meth pictures and neutral pictures in healthy controls (p<0.005, threshold 15 voxels). Interestingly the ventral striatum activation significantly correlated with the days since the last use of meth (r=−0.76, p=0.017). No significant activity was found in healthy control group.
Conclusion
The preliminary data suggest that methamphetamine dependent subjects, when exposed to methamphetamine-associated visual cues, have increased brain activity in ventral striatum, caudate nucleus and medial frontal cortex which subserve craving, drug-seeking, and drug use.
Keywords: Methamphetamine, Cortex, Cue exposure, fMRI, Striatum
Introduction
Methamphetamine (meth) is a long-duration psychostimulant that acts primarily by reversal of monoamine transporters leading to sustained high levels of extracellular monoamines [1]. Meth use can rapidly lead to addiction, has been particularly linked to risky sexual behaviors and violence [2], and may result in varying degrees of neurotoxicity [3]. In the United States, 10.4 million individuals aged twelve and older have used meth.
Cue-induced drug-seeking is a critical feature of relapse to repetitive drug-taking behavior [4]. Cue activated brain circuits, linked primarily by dopamine and glutamate, include the ventral tegmental area, nucleus accumbens core, basolateral amygdala, and prefrontal cortex [5]. Cue exposure therapies to reduce relapse continue to be actively studied and applied in some clinical settings [6].
Our knowledge of the neurocircuitry of human cue activation has been advanced by functional neuroimaging studies [7–11]. Brain regions including the amygdala, anterior cingulate cortex, insula, thalamus, ventral striatum, hippocampus, and prefrontal cortex appear to have roles in regulating cue circuitry and craving, based on increased activation of these regions during exposure to various cue modalities [7, 11–15]. While considerable work in the area of cue-induced craving has been conducted with other substances of abuse, patterns of neural activation during meth-associated cue presentation have not been previously evaluated.
In the current study, we developed and applied procedures to assess cue-evoked activation of brain circuitry in chronic meth users. We studied individuals under conditions of visual cue-generated exposure using Blood Oxygen Level Dependent (BOLD) fMRI. Based on the previously characterized patterns reported with cues associated with other abused drugs, we hypothesized that during cue exposure in the scanner, non-treatment seeking meth subjects would have increased activation in prefrontal and cingulate cortex, ventral striatum, and amygdala.
Method
Participants
Nine healthy, non-treatment seeking individuals who met DSM IV TR [16] criteria for current meth dependence participated in this study. Nine control participants who had never used meth were also recruited for study participation. All were required to be in good health and have a history of moderate social drinking (less than 14 standard drinks/week). Control subjects were matched to the meth group for gender, race, and alcohol use. All control subjects had negative urine drug screens during screening and all days of scanning. No control subjects currently used tobacco products or had a lifetime history of any drugs of abuse.
Subjects were recruited through local television, radio advertisements, and word-of-mouth. Subjects underwent 1–2 weeks of telephone and in-person screening. The first in-person screening was preceded by oral and written informed consent approved by the Institutional Review Board (IRB) of the Medical University of South Carolina (MUSC). Screening included the MINI diagnostic psychiatric interview [17], general medical history, general physical and neurologic assessments, timeline follow back for multiple drugs and alcohol prior to informed consent, and concurrent medication history. Laboratory studies included hematology; comprehensive blood chemistries; routine urinalyses; hepatitis B, hepatitis C, HIV, and syphilis testing; and daily urine drug screens for amphetamine, meth, opiates, marijuana, benzodiazepines, cocaine and barbiturates. Subjects could not meet current dependence criteria on any psychoactive substance other than meth, nicotine, or caffeine. To be included, subjects could not have significant hepatic, renal, cardiac, or neurologic (including stroke, seizure, migraine, head trauma), or other disorders that might interfere with MRI scanning. Subjects could not have a history of implanted ferrous materials or devices. Subjects could not be on any medication during the last thirty days that might alter CNS function or CNS blood supply (e.g., calcium channel agonists, sedative-hypnotics, over-the-counter CNS agents). Individuals could not have a history of major Axis I disorders such as lifetime bipolar disorder, schizophrenia, dementia, or current depressive disorder. Control subjects were outpatients who did not use meth or other drugs of abuse during the study as verified by daily urine drug screens and breathe alcohol levels. Eight meth subjects were nicotine dependent. They did not alter their smoking pattern during the study period and were allowed one cigarette 30 min prior to scanning. None of the controls were nicotine dependent.
Imaging procedures
The cue-induced MRI scanning procedures were similar to those used in prior work by our group [7, 15, 18].
MRI image acquisition
Participants wore earplugs and head movement was restricted using cushions surrounding the head. MRI scans were performed in a Philips 3.0 T MR scanner (Intera, Philips Medical System, The Netherlands) with an eight-channel SENSE head coil. Following a manual tuning for echoplanar imaging, the cue-induction paradigm was performed while also acquiring BOLD weighted transverse scans using a gradient echo, echo-planar (EPI) fMRI sequence (Flip Angle=90, Echo Time (TE) =30.0 ms, Repetition Time (TR) =1867 ms, Field of view (FOV)=20 mm, matrix 64 × 64, SENSE factor 2, 36 slices, 3 mm thick with 0 mm gap, giving a voxel size of 3.25 × 3.25 × 3.00 mm 3.386 volumes, A high-resolution 160 slice, 1 mm thick sagittal T1 weighted scan was obtained for later volumetric and co-registration analysis and to ensure that there was no significant anatomical brain pathology.
Meth cues
A 12 min sequence of slides for visual stimulus presentation was created consisting of eight 90-sec epochs. Each epoch of slides (Figure 1) contained three 24 sec blocks: visual control pictures (matched for color and hue), meth use (IV, nasal, smoking) pictures, and one 24 sec visual rest (crosshair on a neutral background). Each 24 sec block was made up of five individual pictures, each displayed for 4.8 sec. A six second rating occurred after each 24-sec block. In order to control for time and order of effect across subjects, the order of the individual pictures, the blocks within the epoch, and all the epochs were randomly presented. In addition, a 10 min relaxation presentation was displayed for localize scan and structure scan, which consisted of twenty natural scenic pictures, each displayed for 30 sec. After each block of stimulus categories, subjects were asked to rate their current urge to use meth on a 0–4 scale, using a non-dominant hand “glove” response pad. The visual cues were displayed by E prime on an Integrated Functional Imaging System (IFIS, MRI Devices, Gainesville, FL).
Figure 1.
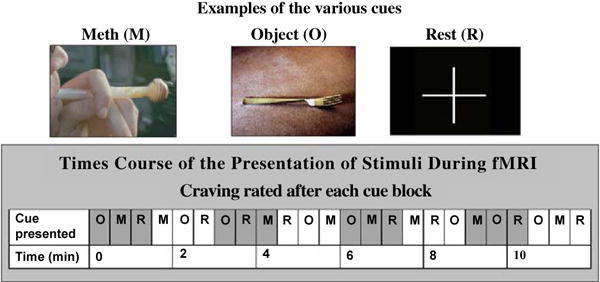
Methamphetamine cue-induced brain fMRI procedure.
FMRI data analysis
Individual fMRI Data Analyses:MR scans were transferred into ANALYZE format and then further processed on Sun workstations (Sun Microsystems, Palo Alto, CA), using Matlab 7.1 (Mathworks, Sherborn, MA) with Statistical Parametric Mapping software 5 (SPM5, The Wellcome Department of Cognitive Neurology, London, (http://www.fil.ion.ucl.ac.uk/spm/). After realignment (including the adjustment for sampling errors), the images were stereotactically normalized into a standard space with a resolution of 3 × 3 × 3 mm voxels using the averaged functional EPI image. Subsequently, the data were smoothed. In a first level of statistical analysis, using a boxcar function convolved with the modeled hemodynamic response function as the basic function for the general linear model, we obtained contrast maps.
Group data analysis
Individual-specific contrasts were entered into a second-level analysis to obtain a random effect analysis of activation effects across the entire group (one-sample t tests). The combined group t maps were thresholded at p ≤ 0.005 uncorrected for multiple comparisons and cluster analyses were performed with a spatial extent threshold of 15 voxels. We included age, education, and nicotine as covariates into the second level model.
Region of Interest (ROI) Analysis: In order to identify activity in the ventral striatum among all subjects, activated nucleus accumbens (MNI coordinates −3, 7, −12) in the group analysis was used to define as a center for extracting time courses that was the activation peak in group map from baseline scan [15, 18]. A small volume of 6 mm radius spherical volume of interest (VOI) was calculated as the first eigenvariate of singular value decomposition across voxels. The average time courses of these voxels were generated from each individual’s data. The same procedure was performed in the superior medial frontal cortex (MNI coordinates 3, 54, 9) to extract time courses from a VOI that was the activation peak from group map from baseline scan.
Behavioral statistical analysis
Comparisons of demographics and cue craving rating and time course data were performed for t test and correlation with SPSS16.0.
Results
Demographics and subjective ratings
Forty non-treatment seeking meth dependent individuals responded to ads or word of mouth referrals. Thirteen declined phone screening. Of the 27 individuals who completed phone screening, thirteen were eligible for in-person screening and signed informed consent. Three participants were excluded due to cocaine dependence as the primary drug, major Axis I disorders, and/or exclusionary medications. As can be seen in Table 1, nine meth using males and nine non-drug using healthy male controls completed the fMRI scanning protocol. There were differences between the meth and control groups in age, education and nicotine use.
Table 1.
Demographics and methamphetamine use.
| Methamphetamine (n=9) |
Control (n=9) |
Statistics | |
|---|---|---|---|
| Age | 35.9 ± 7.1 | 29.7 ± 5.1 | P ≤ 0.05 |
| Education | 13.2 ± 3.2 | 16.6 ± 1.9 | P ≤ 0.02 |
| Gender (%Male) | 100% | 100% | Not Significant |
| Race (%Caucasian/Other) | 100/0 | 100/0 | Not Significant |
| Years of Meth Use | 10.7 ± 7.1 | NA | |
| Baseline % days abstinent | 55.1 ± 50.9 | NA | |
| Nicotine Use | 89% | 0% | P ≤ 0.001 |
Real time craving rating
While in the scanner and viewing cues, meth subjects rated their craving significantly higher for all cues as compared to healthy controls (F=7.65, df=1,8, p=0.024). In addition, meth subjects rated their craving for the meth cues significantly higher than the neutral cues (F=4.12, df=2,8, p=0.036). In contrast, control subjects did not endorse any craving (zero ratings) for meth during any of the cue conditions.
Comparison of meth with neutral
The comparison of regional brain activation to meth cues versus neutral visual cues for the meth participants and controls are summarized in Table 2 and depicted in Figure 2. For the meth subjects, meth cues minus neutral object cues revealed a significant difference in the ventral striatum and the medial prefrontal cortex (p<0.005, threshold 15 voxels). Figure 2 shows the estimated Meth minus Neutral contrast for healthy controls versus meth users. The cross level interaction indicating the difference in cue-induced activation between the two groups was highly significant for both the ventral striatum (t=2.45, p=0.026) and the medial frontal cortex (t=3.26, p=0.005).
Table 2.
Brain areas activated by cue comparison (p<0.005, cluster size 15 voxels).
| Comparison: Meth Cues minus Neutral Cues | ||||||
|---|---|---|---|---|---|---|
| X | Y | Z | t score | Size | Region | |
| Healthy Controls | ||||||
| R | 33 | −51 | −21 | 12.41 | 299 | Cerebellum/fusiform |
| L | −3 | −76 | −3 | 8.49 | 844 | Occipital |
| L | −27 | −45 | 45 | 7.05 | 17 | parietal |
| R | 24 | −6 | −27 | 5.86 | 16 | parahippocampus |
| R | 12 | 12 | 9 | 5.74 | 18 | caudate |
| Meth Subjects | ||||||
| L | −48 | −72 | −9 | 20.55 | 1404 | Occipital |
| R | 42 | −75 | −3 | 9.31 | 462 | Occipital |
| R | 3 | 54 | 9 | 8.87 | 440 | Superior medial frontal |
| L | −45 | −42 | 60 | 8.70 | 104 | parietal cortex |
| R | 21 | 0 | 33 | 7.28 | 73 | parahippocampus |
| L | −3 | 6 | −12 | 5.56 | 105 | Ventra striatum |
| R | 15 | 15 | 12 | 5.17 | 50 | caudate nucleus |
| L | −9 | 18 | 9 | 5.02 | 38 | Caudate |
| R | 33 | −6 | 33 | 4.77 | 24 | postcentral gyrus |
| L | −36 | −21 | 27 | 4.68 | 16 | Fusiform |
Figure 2.
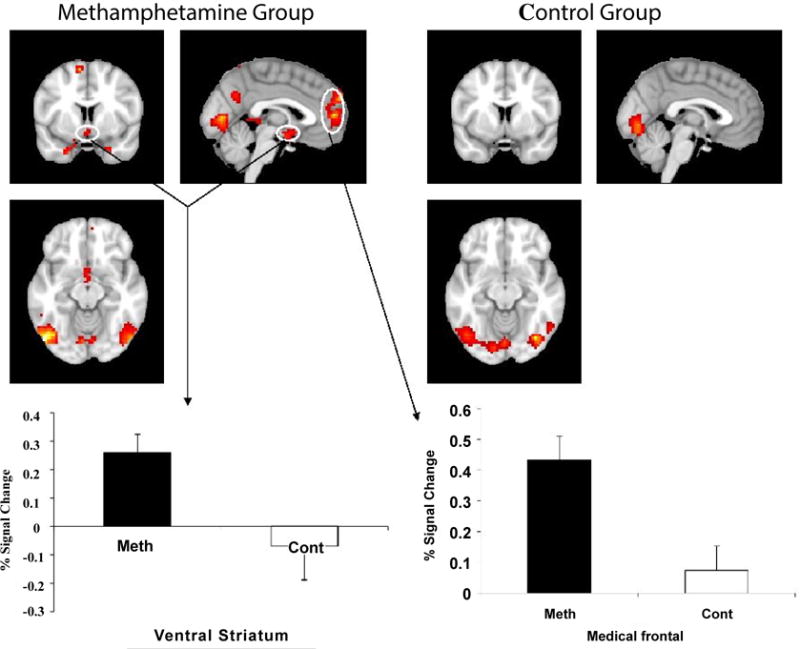
Brain regions with significantly increased activation during viewing meth compared to viewing neutral are depicted in color on coronal structural magnetic resonance imaging scans (p ≤ 0.005, spatial extent threshold 15 voxels). Ventral striatum activation and medial frontal cortex were significantly increased in the meth group as compared to the healthy control group (p<0.05). Bars indicate mean values; error bars are standard error of the mean.
Relationship between brain activation and the day of last Meth using
As can be seen in Figure 3, we found that the ventral striatum activation significantly correlated with the days since the last use of meth (r=−0.76, p=0.017). There was also a trend showing the more recent the meth use, the more activity in the medial frontal cortex (r=−0.65, p=0.057).
Figure 3.
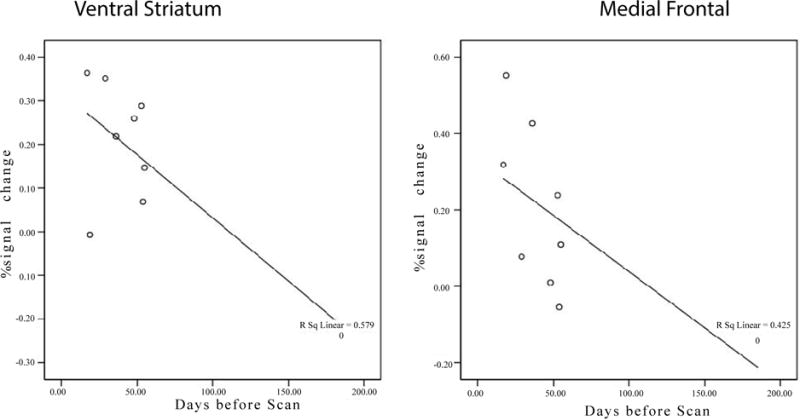
Brain activity in the ventral striatum is negatively correlated with the time since last use (r=−0.761, p=0.017). There was also a negative trend in the medial frontal area (r=−0.652, p=0.057).
Brain activations: Visual control cues minus rest control
The evaluation of visual control versus rest control (crosshair) serves as an internal control to verify that regional brain activation is similar across both study populations. This comparison confirmed that between groups, differences in activation are due to the specific content contrast and not influenced by inattention, movement, metabolic effects of meth, or blood flow differences. As such, one would expect to find occipital activation in this comparison due to the various neutral pictures in the visual control compared to the crosshair of the rest control. Accordingly, within group analyses found that both the meth group and healthy control group showed areas of significant activation while viewing the visual control images compared to the rest control (crosshair) in the occipital lobes (meth group: n=9, df=8, t=0.005, activated cluster of 1321 voxels; control group: n=9, df=8, t=0.005, activated cluster of 1156 voxels). Importantly, there was no significant activation between the meth group and healthy control group (two group t-test, p=0.01, cluster size=15 voxels). This internal control demonstrates that there is little, if any, difference in nonspecific brain activation within the two groups due to differential attention, movement, or the lingering toxic effects of meth or other reasons.
Discussion
To the best of our knowledge, this is the first imaging study of cue-induced craving in non-treatment seeking meth dependent subjects. When comparing the meth cues to neutral cues, meth participants had increased brain activation in the ventral striatum and medial frontal cortex, as compared to healthy controls. Furthermore, the time course data showed that ventral striatum and medial frontal cortex activations were significant higher than in healthy controls. Previous studies of cue elicited brain activation in cocaine [19], alcohol [7], and nicotine [20] dependence reported similarities in cue activation in ventral striatum and frontal cortices. Interestingly, we found a significant relationship between ventral striatum activity and the days from the last meth use, which indirectly suggest that the ventral striatum activation may be related to relapse or cue craving. This last finding needs to be confirmed or rejected in a separate study.
Due and colleagues [21] have suggested that cue-induced neural circuitry activation involves two distinct, yet interacting circuits: A) a reward circuit involving the ventral tegmental area, nucleus accumbens, amygdala, hippocampus, thalamus, ventral pallidum, and prefrontal cortex, and B) a visuospatial-attentional and planning circuit consisting of the frontal cortex, anterior-cingulate cortex, parietal cortex, and occipital cortex. Activation of anatomical areas for reward and planning were both seen in the present work. While both meth and control subjects had activation in parietal and occipital regions, there were larger areas of activation in meth subjects suggesting detailed visual processing of meth cues.
Several limitations to the present work need to be noted. This initial work was exploratory in nature. First, our sample size was small and females meeting criteria for meth dependence were rare in our catchment area and were excluded. Second, we relied heavily on self-report of past meth and other substance use prior to being scanned, an approach that could be subject to a number of biases. Since our participant population was not an exclusive lifelong meth using population, our findings could well have been influenced by past use of other substances. Third, our participants were non-treatment seeking drug users; treatment seekers may have yielded different results. Fourth, an uncorrected p value with a cluster size of 15 voxels was used in group analysis which may limit our results generalization. Finally, while none of our healthy controls smoked, eight of the nine meth subjects were smokers. Cigarette cues [20] and smoking a cigarette [22] activate ventral caudate/nucleus accumbens and other reward areas, but we did not use any cigarette cues in the present study. However, we put age, education and cigarette use as a covariate into our second level model to evaluate these confounds and had the same result.
In summary, the current study provides evidence that meth users, when exposed to meth cues, have cue-induced activations in brain regions that have previously been found to subserve addictive processes. Furthermore, the brain regions activated by meth cues are similar to the brain regions activated by alcohol, cocaine and nicotine cues. Identifying brain regions involved in craving for meth may lead to more effective therapies for meth dependence by providing biological targets to assess treatment interventions. The findings of this study also suggest that cue-induction imaging paradigms may be used to assess the effectiveness of therapeutic interventions for meth dependence.
Acknowledgments
This Work Was Supported By NIH/NIDA P20 Da022658.
The authors wish to acknowledge the manuscripts edits by Matthew Joel Smith, Ann Blanton and the thoughtful review and comments by Dr. Peter Kalivas. The logistical efforts of Kristi Huebner and Kelley Barnes were critical.
References
- 1.Volz TJ, Fleckenstein AE, Hanson GR. Methamphetamine-induced alterations in monoamine transport: implications for neurotoxicity, neuroprotection and treatment. Addiction. 2007;102(Suppl 1):44–48. doi: 10.1111/j.1360-0443.2007.01771.x. [DOI] [PubMed] [Google Scholar]
- 2.National Institute on Drug Abuse. Methamphetamine: Abuse and addiction. Rockville, MD: NIH, DHHS; 2006. (National Institute on Drug Abuse Research Report Series NIH Pub. 02-4210). [Google Scholar]
- 3.Yamamoto BK, Bankson MG. Amphetamine neurotoxicity: Cause and consequence of oxidative stress. Crit Rev Neurobiol. 2005;17:87–117. doi: 10.1615/critrevneurobiol.v17.i2.30. [DOI] [PubMed] [Google Scholar]
- 4.Childress AR, McLellan AT, Ehrman R, O’Brien CP. Classically conditioned responses in opioid and cocaine dependence: a role in relapse? NIDA Res Monogr. 1988;84:25–43. [PubMed] [Google Scholar]
- 5.Feltenstein MW, See RE. The neurocircuitry of addiction: An overview. Br J Pharmacol. 2008;154:261–274. doi: 10.1038/bjp.2008.51. [DOI] [PMC free article] [PubMed] [Google Scholar]
- 6.Martin T, LaRowe SD, Malcolm R. Progress in cue exposure therapy for the treatment of addictive disorders: a review update. The Open Addiction Journal. 2010;3:92–101. [Google Scholar]
- 7.Myrick H, Anton RF, Li X, Henderson S, Drobes D, et al. Differential brain activity in alcoholics and social drinkers to alcohol cues: Relationship to craving. Neuropsychopharmacology. 2004;29:393–402. doi: 10.1038/sj.npp.1300295. [DOI] [PubMed] [Google Scholar]
- 8.McClernon JF, Gilbert DG. Human functional neuroimaging in nicotine and tobacco research: Basics, background, and beyond. Nicotine Tob Res. 2004;6:941–959. doi: 10.1080/14622200412331337394. [DOI] [PubMed] [Google Scholar]
- 9.Volkow ND, Fowler JS, Wang GJ. The addicted human brain viewed in the light of imaging studies: Brain circuits and treatment strategies. Neuropharmacology. 2004;47:3–13. doi: 10.1016/j.neuropharm.2004.07.019. [DOI] [PubMed] [Google Scholar]
- 10.Kalivas PW, Volkow ND. The neural basis of addiction: A pathology of motivation and choice. Am J Psychiatry. 2005;162:1403–1413. doi: 10.1176/appi.ajp.162.8.1403. [DOI] [PubMed] [Google Scholar]
- 11.Lingford-Hughes A. Human brain imaging and substance abuse. Curr Opin Pharmacol. 2005;5:42–46. doi: 10.1016/j.coph.2004.10.002. [DOI] [PubMed] [Google Scholar]
- 12.Childress AR, McLellan AT, O’Brien CP. Abstinent opiate abusers exhibit conditioned craving, conditioned withdrawal and reductions in both through extinction. Br J Addict. 1986;81(5):655–660. doi: 10.1111/j.1360-0443.1986.tb00385.x. [DOI] [PubMed] [Google Scholar]
- 13.Franklin TR, Wang Z, Wang J, Sciortino N, Harper D, et al. Limbic Activation to Cigarette Smoking Cues Independent of Nicotine Withdrawal. A Perfusion MRI Study. 2007;32:2301–2309. doi: 10.1038/sj.npp.1301371. [DOI] [PubMed] [Google Scholar]
- 14.Franklin TR, Wang J, Li Y, Suh JJ, Goldman M, et al. Dopamine Transporter Genotype Modulation of Neural Response to Smoking cues. Confirmation in a New Sample. 2011;16:308–322. doi: 10.1111/j.1369-1600.2010.00277.x. [DOI] [PMC free article] [PubMed] [Google Scholar]
- 15.Myrick H, Anton RF, Li X, Henderson S, Randall PK, Voronin K. Effect of naltrexone and ondansetron on alcohol cue-induced activation of the ventral striatum in alcohol-dependent people. Arch Gen Psychiatry. 2008;65:466–475. doi: 10.1001/archpsyc.65.4.466. [DOI] [PMC free article] [PubMed] [Google Scholar]
- 16.First MB, Tasman AT. DSM-IV-TR Mental Disorders: Diagnosis, Etiology and Treatment. John Wiley & Sons, Inc; Hoboken, NJ: 2004. [Google Scholar]
- 17.Sheehan D, Janavs J, Baker R, Harnett-Sheehan K, Knapp E, et al. MINI international neuropsychiatric interview. University of South Florida-Tampa; 2002. DSM-IV: English Version 5.0.0. [Google Scholar]
- 18.Myrick H, Li X, Randall PK, Henderson S, Veronin K, et al. The Effect of aripiprazole on cue-induced brain activation and drinking parameters in alcoholics. J Clin Psychopharmacology. 2010;30:365–372. doi: 10.1097/JCP.0b013e3181e75cff. [DOI] [PMC free article] [PubMed] [Google Scholar]
- 19.London ED, Bonson KR, Ernst M, Grant S. Brain imaging studies of cocaine abuse: Implications for medical development. Crit Rev Neurobiol. 1999;13:227–242. doi: 10.1615/critrevneurobiol.v13.i3.10. [DOI] [PubMed] [Google Scholar]
- 20.Brody AL, Mandelkern MA, London ED, Childress AR, Lee GS, et al. Brain Metabolic Changes During Cigarette Craving. Arch Gen Psychiatry. 2002;59:1162–1172. doi: 10.1001/archpsyc.59.12.1162. [DOI] [PubMed] [Google Scholar]
- 21.Due DL, Huettel SA, Hall WG, Rubin DC. Activation in mesolimbic and visuospatial neural circuits elicited by smoking cues: Evidence from functional magnetic resonance imaging. Am J Psychiatry. 2002;159:6. doi: 10.1176/appi.ajp.159.6.954. [DOI] [PubMed] [Google Scholar]
- 22.Brody AL, Mandelkern MA, Olmstead RE, Scheibal D, Hahn E, et al. Gene Variants of Brain Dopamine Pathways and Smoking-Induced Dopamine Release in the Ventral Caudate/Nucleus Accumbens. Arch Gen Psychiatry. 2006;63:808–816. doi: 10.1001/archpsyc.63.7.808. [DOI] [PMC free article] [PubMed] [Google Scholar]