

Abstract
Aims
Myocardial salvage, determined by cardiac magnetic resonance imaging (CMR), is used as end point in cardioprotection trials. To calculate myocardial salvage, infarct size is related to myocardium at risk (MaR), which can be assessed by T2-short tau inversion recovery (T2-STIR) and contrast-enhanced steady-state free precession magnetic resonance imaging (CE-SSFP). We aimed to determine how T2-STIR and CE-SSFP perform in determining MaR when applied in multicentre, multi-vendor settings.
Methods and results
A total of 215 patients from 17 centres were included after percutaneous coronary intervention (PCI) for ST-elevation myocardial infarction. CMR was performed within 1–8 days. These patients participated in the MITOCARE or CHILL-MI cardioprotection trials. Additionally, 8 patients from a previous study, imaged 1 day post-CMR, were included. Late gadolinium enhancement, T2-STIR, and CE-SSFP images were acquired on 1.5T MR scanners (Philips, Siemens, or GE). In 65% of the patients, T2-STIR was of diagnostic quality compared with 97% for CE-SSFP. In diagnostic quality images, there was no difference in MaR by T2-STIR and CE-SSFP (bias: 0.02 ± 6%, P = 0.96, r2 = 0.71, P < 0.001), or between treatment and control arms. No change in size or quality of MaR nor ability to identify culprit artery was seen over the first week after the acute event (P = 0.44).
Conclusion
In diagnostic quality images, T2-STIR and CE-SSFP provide similar estimates of MaR, were constant over the first week, and were not affected by treatment. CE-SSFP had a higher degree of diagnostic quality images compared with T2 imaging for sequences from two out of three vendors. Therefore, CE-SSFP is currently more suitable for implementation in multicentre, multi-vendor clinical trials.
Keywords: ischaemia, magnetic resonance imaging, myocardium at risk, AAR, area at risk
Introduction
ST-elevation myocardial infarction is a major cause of death worldwide. The myocardium supplied by an occluded coronary vessel becomes ischaemic and is known as myocardium at risk (MaR). Over time, MaR will gradually develop into infarction until reperfusion occurs.1–4 The main objective with acute cardioprotective therapy is to inhibit infarct evolution by timely reperfusion and to minimize further injury associated with reperfusion therapy, thus minimizing final infarct size (IS).5 To evaluate the efficacy of such treatments, IS in relation to MaR is used to calculate myocardial salvage index (MSI) defined as 1-IS/MaR.6,7
Late gadolinium enhancement (LGE) cardiac magnetic resonance (CMR) is currently considered the clinical reference method for quantification of IS.8,9 Assessment of MaR, however, is challenging. Recently, CMR has shown potential for quantification of MaR up to 7 days after the acute event using either T2-weighted magnetic resonance (MR) imaging6,10–14 or contrast-enhanced steady-state free precession magnetic resonance imaging (CE-SSFP).15 Both sequences have been validated against myocardial perfusion SPECT10,15 and compared against each other in a single-centre setting.16 However, it is not known how these techniques perform in a multicentre, multi-vendor setting or whether cardioprotection treatments affect MaR. Recently, two international, multicentre, multi-vendor cardioprotection trials, CHILL-MI17 and MITOCARE,18 used MSI assessed by CMR as primary (CHILL-MI) or secondary (MITOCARE) end point. Both T2-STIR and CE-SSFP images were acquired during a CMR examination performed 2–6 days after the acute event in these trials.
The aim of the present study was to determine how well T2-STIR and CE-SSFP perform in quantifying MaR and determining culprit vessel across vendors, sites, treatments, and imaging timing using data from the CHILL-MI and MITOCARE trials.
Methods
Study population and design
Patients from the CHILL-MI and MITOCARE trials (n = 215) underwent CMR imaging at one occasion within 1–8 days after primary PCI for first-time STEMI.17 Inclusion and exclusion criteria for the clinical trials have been previously published.17,19 In short, all patients had clinical signs of acute myocardial infarction defined as symptoms and electrocardiogram (ECG) consistent with ST-elevation infarction or new left bundle branch block (LBBB) and were ≥18 years old with symptom duration <6 h. Patients with previous myocardial infarction or PCI were excluded. Both the CHILL-MI and MITOCARE trials were approved by the institutional review boards/ethics committees. All patients provided written informed consent.
Since the amount of patients with MR Day 1 was limited in the CHILL-MI and MITOCARE materials, 8 patients with T2-STIR CMR performed on the first day after STEMI from a previous material10 were included and pooled with the CHILL-MI and MITOCARE data exclusively for the analysis concerning changes in MaR over the first week after infarction. Inclusion criteria for this material have been previously published.10 In short, patients with no history of MI, presenting with acute STEMI and TIMI 0 flow, were included.
Coronary angiography
Coronary angiography was used to determine culprit vessel. Angiography data from the CHILL-MI trial were analysed by a core laboratory, while angiographic data from the MITOCARE trial were analysed at the respective site.17–19
CMR image acquisition
All CMR examinations were performed on 1.5T scanners from Philips (Philips Healthcare, Best, The Netherlands), Siemens (Siemens AG, Erlangen, Germany), or General Electrics (GE Healthcare, Waukesha, WI, USA). Throughout this article, the vendors have been placed in random order as Vendor 1, 2, and 3. Subjects were placed in a supine position, and images were acquired at end-expiratory breath hold with ECG gating. Initial scout images were acquired to locate the anatomical views of the heart. A black-blood triple inversion recovery T2-weighted sequence (T2-STIR) was used to acquire short-axis imaging covering the entire left ventricle from base to apex before intravenous administration of a gadolinium-based extracellular contrast agent (0.2 mmol/kg). The T2-STIR sequences used were the ones provided by the respective vendor for the particular hardware/scanner model, and no further optimization was performed. Approximately 5 min after the contrast injection, a multi-slice, multi-phase, contrast-enhanced steady-state free precession (CE-SSFP) sequence was applied to acquire short-axis images corresponding to the T2-STIR images.15,16 Slice thickness was 8 mm with no slice gap. In-plane resolution was typically 1.5 × 1.5 mm.
For details regarding imaging and analysis by LGE imaging, see Appendix 1.
For detailed imaging parameters and quality control protocol, see Appendix 2.
CMR analysis
Images were analysed using Segment, version 1.9R3314 (http://segment.heiberg.se).20 MaR was assessed from the T2-STIR and CE-SSFP short-axis images as previously described.10,15 In short, for T2-STIR images, left ventricular (LV) myocardium was defined by manual delineation of epicardial and endocardial borders. The same was performed for CE-SSFP images in end-diastole and end-systole as previously described.16 Hyperintense myocardium in T2-STIR and CE-SSFP images was manually delineated for assessment of MaR. If present, hypointense myocardium within the hyperintense area was included as MaR (microvascular obstruction or haemorrhagic infarct). For CE-SSFP, the end-diastolic and end-systolic values of LV mass and MaR were averaged. The delineation of each data set, T2-STIR or CE-SSFP, was performed by one of the three experienced observers (H.E., M.C., and H.A. with 13, 14, and 20 years of experience). Every case was read by a second observer to ensure high-quality measurements. The observer was blinded to the other method for MaR assessment (T2-STIR or CE-SSFP) when performing image analysis. Different opinions were resolved in consensus with a third observer when necessary. Observers had access to LGE images when delineating T2-STIR and CE-SSFP. MaR was expressed as per cent of the LV mass.
MaR by CE-SSFP and infarct delineations were performed by a core laboratory (Imacor AB) as a part of the original MITOCARE and CHILL-MI data analysis, and T2-STIR was analysed by the same observers blinded to the CE-SSFP data ∼1.5 years later.
Image qualitative analysis
Qualitative analysis was performed separately for T2-STIR and CE-SSFP, by HE blinded to all other data. Images were rated as follows: (i) not diagnostic quality, (ii) acceptable, or (iii) good for defining MaR. Not diagnostic quality were those where MaR could not be evaluated due to artefacts, low signal, high noise levels, or where no clear demarcation between MaR and remote could be identified. Acceptable were those where MaR could be identified, even though some of the issues above were present. Good were those without any of the issues above. The same scale was employed to rate ability to define endo- and epicardium. Acceptable and good images were considered to be of diagnostic quality. The observer also identified the culprit artery as the left anterior descending artery (LAD), right coronary artery (RCA), or left circumflex artery (LCx), without information from LGE images. In cases of left dominance where the MaR involved both the lateral and inferior wall, the observer had to designate the most probable culprit vessel (LCx or RCA). This was compared with the culprit artery by coronary angiography.
Statistical analysis
Results for continuous variables are expressed as mean ± standard deviation. Bias according to Bland–Altman was used to compare MaR for T2-STIR and CE-SSFP in patients with complete T2-STIR and CE-SSFP data of diagnostic quality (n = 127). The D'Agostino and Pearson test was used to test for normality (Appendix 3). Paired t-test was used to test the difference between T2-STIR and CE-SSFP. When comparing MaR in controls and treated groups, an independent t-test was used. The Pearson correlations coefficient was used for assessment of correlation between T2-STIR and CE-SSFP. For comparing image quality, the Wilcoxon test was used. Fisher's exact test was used to compare ratio of diagnostic tests and correctly assigned culprit arteries between T2-STIR and CE-SSFP. Assessment of differences in size and quality of MaR over time and heart rates for different image quality groups was tested using a one-way ANOVA test. P < 0.05 indicated statistical significance. Analyses were performed using Graphpad Prism (version 5.02, GraphPad Software, San Diego, CA, USA).
Results
Study population
Of the 215 patients included in the study, 200 (93%) had complete T2-STIR datasets, 204 (95%) had complete CE-SSFP datasets, and 191 (89%) had complete LGE datasets. Fifty patients (50%) from the CHILL-MI trial received adjuvant hypothermia treatment, and 60 patients (52%) from the MITOCARE trial received adjuvant treatment with TRO40303. For patient and CMR characteristics, see Appendix 4.
Image quality
Sixty-five per cent of T2-STIR vs. 97% of CE-SSFP datasets were considered of diagnostic quality (P < 0.001, Figure 1). Ratio of datasets of diagnostic quality for T2-STIR was 73% for LAD, 65% for LCx, and 59% for RCA, whereas for CE-SSFP it was 97% for LAD, 100% for LCx, and 98% for RCA. Anterior (LAD) ischaemia trended towards higher level of T2-STIR images of diagnostic quality compared with lateral and inferior (LCx + RCA) culprit vessels, P = 0.068, while there was no difference between vessels for CE-SSFP, P = 1.0. Image quality of MaR for T2-STIR was 1.8 ± 1.1 and for CE-SSFP 2.7 ± 0.5 (P < 0.001). Heart rate did not differ with image quality for T2-STIR (image quality 1: 68 ± 16, 2: 69 ± 10, 3: 68 ± 10, P = 0.87) or CE-SSFP (image quality 1: 71 ± 12, 2: 67 ± 14, 3: 68 ± 11, P = 0.81). Image quality (score 1–3) for endo- and epicardial delineation was 2.3 ± 0.7 for T2-STIR and 2.8 ± 0.4 for CE-SSFP (P < 0.001).
Figure 1.
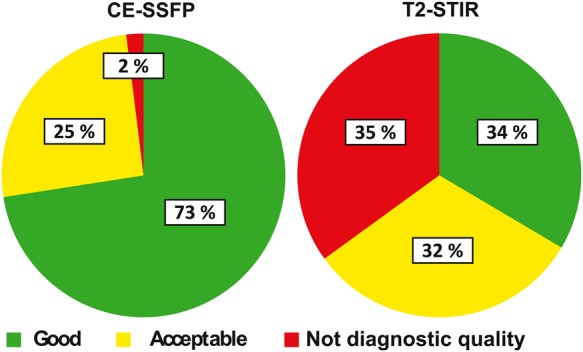
Image quality by T2-STIR and CE-SSFP. Pie charts show per cent of datasets where MaR was considered not of diagnostic quality, acceptable, or good in a total of 200 T2-STIR and 204 CE-SSFP datasets.
T2-STIR vs. CE-SSFP for MaR
Figure 2 shows correlation between T2-STIR and CE-SSFP images by vendor and treatment groups. For images of diagnostic quality, bias between MaR by T2-STIR and CE-SSFP was 0.02 ± 6% (P = 0.96, n = 126), while size of MaR was 36 ± 11% by T2-STIR and 36 ± 10% by CE-SSFP. There was a strong correlation between MaR by T2-STIR and CE-SSFP in images of diagnostic quality (r2 = 0.71, P < 0.001, n = 126). MaR by culprit artery did not differ between T2-STIR and CE-SSFP in images of diagnostic quality (LAD: 44 ± 9 vs. 43 ± 10%, P = 0.45, n = 55; LCx: 26 ± 7 vs. 28 ± 8%, P = 0.57, n = 14; RCA: 31 ± 7 vs. 32 ± 6%, P = 0.68, n = 57). Figure 3 shows examples of T2-STIR, CE-SSFP, and LGE images from two patients.
Figure 2.

MaR by T2-STIR and CE-SSFP. (A) MaR by T2-STIR vs. CE-SSFP divided by vendors, r2 = 0.71. (B) MaR by T2-STIR vs. CE-SSFP divided by treatment groups. Dashed lines are identity and solid lines regression. (C) The Bland–Altman plot of CE-SSFP and T2-STIR divided by vendors, and (D) the Bland–Altman plot of CE-SSFP and T2-STIR divided by treatment groups, mean difference 0.02 ± 6%, dashed lines indicate ± 2SD. Measurements are expressed as % of LV mass. MaR, myocardium at risk.
Figure 3.

MaR by T2-STIR and CE-SSFP and infarct by LGE in corresponding mid-ventricular short-axis slices from two patients. Upper row (A) shows corresponding T2-STIR and CE-SSFP images of good quality. Bottom row (B) shows T2-STIR not of diagnostic quality with corresponding CE-SSFP image. For technical details on image acquisition see Appendix 5. LGE, late gadolinium enhancement.
Treated vs. controls
There was no difference in MaR between controls and patients treated with hypothermia in the CHILL-MI trial (bias by T2-STIR: 1.66 ± 2.84%, P = 0.56; bias by CE-SSFP 0.23 ± 2.25%, P = 0.91). Neither was there any difference in MaR between controls and patients receiving TRO40303 treatment (bias by T2-STIR: −0.69 ± 2.64%, P = 0.80; bias by CE-SSFP: 0.14 ± 1.94%, P = 0.94). For details, see Appendix 4.
Culprit vessel
CMR located correct culprit vessel in 89% of patients by T2-STIR and 97% of patients by CE-SSFP (P = 0.0015, Table 1). Sensitivity for LCx was lower than LAD/RCA for both T2-STIR and CE-SSFP. Using T2-STIR, the observer was unable to assign culprit vessel in 11% of patients with RCA occlusion, 17% of patients with LCx occlusions, and 4% of patients with LAD occlusion. All patients were assigned a culprit vessel using CE-SSFP. A low sensitivity for assigning LCx as culprit artery was due to incorrect classification as RCA in five patients for CE-SSFP, while for T2-STIR it was incorrect classification as LAD for one patient, RCA for two patients, and inability to assign culprit vessel in four patients.
Table 1.
Culprit arteries by T2-STIR and CE-SSFP in relation to angiography, presented as sensitivity and specificity
| Sensitivity (%) | Specificity (%) | n (angiography) | |
|---|---|---|---|
| T2-STIR | |||
| LAD | 96 | 98 | 78 |
| LCx | 70 | 100 | 23 |
| RCA | 88 | 98 | 99 |
| CE-SSFP | |||
| LAD | 100 | 100 | 79 |
| LCx | 80 | 99 | 25 |
| RCA | 99 | 95 | 100 |
Culprit artery was correctly identified in 89% of patients using T2-STIR and 97% of patients using CE-SSFP (P = 0.0015).
T2-STIR, T2-weighted short tau inversion recovery; CE-SSFP, contrast-enhanced SSFP; LAD, left anterior descending artery; LCx, left circumflex artery; RCA, right coronary artery; n, number of patients for each culprit vessel decided by angiography.
Differences between vendors and sites
Vendors 1 and 3 had lower rates of T2-STIR datasets of diagnostic quality compared with CE-SSFP (T2-STIR: 58 and 48%, CE-SSFP: 100 and 99%, respectively, P < 0.001), whereas no difference was found for Vendor 2 (T2-STIR: 90% and CE-SSFP: 96%, P = 0.19, Figure 4). Figure 5 shows examples of T2-STIR and CE-SSFP images from each vendor. In 13 sites, rate of CE-SSFP of diagnostic quality was higher compared with T2-STIR (Figure 6), and the remaining four sites were using MR cameras from Vendor 2. Rate of datasets of diagnostic quality for sites using Vendor 1 was: 55 ± 5% by T2-STIR and 100 ± 0% by CE-SSFP, for vendor 2: 88 ± 17% by T2-STIR and 95 ± 9% by CE-SSFP, and for Vendor 3: 40 ± 20% by T2-STIR and 98 ± 5% by CE-SSFP. Two sites (5 and 8, both using Vendor 2) had a higher rate of T2-STIR of diagnostic quality compared with CE-SSFP. For these sites, only one CE-SSFP dataset was not of diagnostic quality (Figure 6).
Figure 4.

Datasets of diagnostic quality divided by vendor and all vendors together. Numbers are expressed as the ratio of datasets of diagnostic quality divided by the total number of datasets (%). There was a significant difference between T2-STIR and CE-SSFP for Vendor 1, Vendor 3, and for all vendors (P < 0.001) and no difference for Vendor 2 (P = 0.19). ns, not significant, *** = P < 0.001.
Figure 5.

T2-STIR and CE-SSFP images of good quality. The green line delineates the epicardial border of the left ventricle, the red line delineates the endocardial border, and the white line shows MaR.
Figure 6.

Datasets of diagnostic quality divided by site. All 17 sites that participated in the CHILL-MI and MITOCARE trials are represented. Numbers are expressed as per cent of total datasets. Note that CE-SSFP had a higher rate of images of diagnostic quality compared with T2-STIR in 13 of the sites.
Changes in MaR over time
No change in size or quality of MaR or ability to identify culprit artery was seen over the first week after ischaemia reperfusion (P = 0.44, Figure 7).
Figure 7.

MaR by T2-STIR and CE-SSFP over the first week. (A) MaR as per cent of LV mass over time, (B) image of diagnostic quality over time, and (C) ratio of correctly assigned culprit vessel compared with angiography over time. Note that there is no significant change in MaR during the first week in any of the above aspects. Open and closed circles show mean values of MaR by CE-SSFP and T2-STIR, respectively. Error bars show ±1 SD. MaR, myocardium at risk; LV, left ventricular mass.
Discussion
The findings in the present study, with data from two multicentre, multi-vendor studies on cardioprotection, showed that CE-SSFP enabled determination of MaR across vendors and sites, whereas T2-STIR imaging was not of diagnostic quality in approximately one-third of patients. In images of diagnostic quality, however, CE-SSFP and T2-STIR showed a good agreement for assessment of MaR.
A non-contrast-enhanced balanced SSFP yields a T2/T1-weighted contrast that creates an extraordinarily high steady-state signal. After myocardial ischaemia, both T1 and T2 are increased due to oedema with T2 being affected to a higher degree, thus increasing the T2/T1 ratio. Gadolinium-based contrast agent distributes in proportion to extracellular space, which is greater in salvaged than in normal myocardium and even greater in infarcted myocardium.21,22 As T1 time is affected more than T2 time at lower concentrations of gadolinium, the T2/T1 ratio increases further in salvaged myocardium, but the effect may be attenuated at higher gadolinium concentrations, such as in infarcted myocardium, when the effect on T2 time is more marked.23 This might explain the homogenous appearance of MaR in CE-SSFP images; however, further investigation is needed to elucidate these mechanisms.
The differences in diagnostic quality may have several explanations. Since CE-SSFP is a multi-phase cine sequence, MaR can be visualized and quantified in several timeframes; thus, the distinction between MaR and remote myocardium may be easier to appreciate. Differences in experience with CMR between the different sites could also affect image quality and implementation of the different sequences. However, since CE-SSFP images were considered of diagnostic quality in almost all the patients (97%), this technique seems to be independent of the level of experience. SSFP cine imaging is included in most CMR protocols, and the implementation of this sequence is highly standardized, which can be appreciated when considering the similarities in imaging parameters (Appendix 2) compared with T2-STIR where imaging parameters were markedly different. CE-SSFP is also known to be robust to changes in TR and thus image resolution.24 The implementation of T2-STIR may, however, differ with regard to, e.g., surface coil sensitivity correction, resulting in differences in image quality. It has previously been shown that dark-blood T2-STIR imaging is subject to artefacts due to through-plane motion, particularly in the lateral and inferior LV wall.12,25 This might explain the trend towards a difference in diagnostic quality of MaR by T2-STIR seen in different vessels, with more images of diagnostic quality in the anterior lesions (LAD: 74%) compared with the lateral and inferior lesions (LCx: 65% and RCA: 59%). It could also explain the inability to assign culprit artery to patients with LCx occlusion using T2-STIR. The incorrect assignment of LCx occlusions as RCA by using CE-SSFP is, however, to be expected based on the significant overlap of their distribution territories.26,27 Some of these limitations with black-blood T2-STIR imaging might be overcome by using white-blood T2-weighted sequences such as T2-prepared SSFP12 or ACUT2E-TSE-SSFP,17 which has been shown to provide improved image quality and diagnostic accuracy compared with black-blood T2-weighted imaging.28,29 Furthermore, quantitative T1- and T2-mapping techniques have shown promise in assessing MaR.30–32 Validation and standardization, however, on how these mapping techniques should be implemented on different platforms are still lacking.
It should be noted that, given similar hardware capabilities, all vendors could potentially reach similar performance with T2-STIR.
To what extent MaR assessed by CMR is affected by cardioprotection treatment has been a topic of discussion in the CMR community. Findings in the present study suggest that MaR is not affected by the adjuvant treatments in the CHILL-MI and MITOCARE studies since there was no significant difference in MaR between the treatment and placebo groups, neither for T2-STIR nor for CE-SSFP. In a recent post-conditioning cardioprotection trial, however, Thuny et al.33 showed a decrease in MaR assessed by T2-STIR compared with controls. Additionally, White et al.34 showed a decrease in MaR assessed by T2-mapping after ischaemic pre-conditioning. There are, however, differences in the methodology used in the study by White et al. compared with the present study. The White study used five short-axis slices and not the entire left ventricle as in the present study. Furthermore, it used the semi-automated method of Otsu, which has been shown to have limited accuracy for assessment of MaR in T2-weighted imaging.35 Thus, there are still conflicting results regarding the accuracy of T2-weighted imaging for determination of MaR in cardioprotection trials.
Recent experimental data suggest a bimodal pattern of oedema after ischaemia/reperfusion injury as measured with T2-STIR and T2-mapping, suggesting that the oedema is pronounced immediately after reperfusion then decreases over the first day and slowly increases again over the first week.36 The clinical data from the current study do not support such a bimodal pattern either in size, quality of MaR images, or in ability to detect culprit artery.
The findings in the present study have implications for designing clinical cardioprotection trials using MSI as surrogate end point. If T2-STIR alone had been used for assessment of MaR in CHILL-MI and MITOCARE, approximately one-third of the patients would have been excluded due to images not being of diagnostic quality. This would increase the number of patients needed to reach statistical power, thus increasing time and costs to perform a successful cardioprotection trial. Furthermore, CE-SSFP shortens the protocol since cine SSFP images are acquired anyway for functional assessment, which means no extra scanning to determine MaR. T2w imaging requires additional imaging and thereby longer protocols.
Limitations
Only STIR black-blood T2-weighted imaging was compared with CE-SSFP. Thus, the results of this study cannot be generalized to other T2-weighted sequences (e.g. bright-blood methods or T2 mapping). Surface coil intensity correction varied between vendors and sites which may have affected the results. However, this did not seem to affect the quality for CE-SSFP images, which is a strength of this technique. No reference standard for MaR assessment was available. Thus, it is not possible to conclude that one technique is superior in correctly determining MaR. Previous studies, however, have validated both T2-STIR10 and CE-SSFP15 against myocardial perfusion SPECT, with good agreement in images of diagnostic quality.
The current difference in image quality between CE-SSFP and T2-STIR might be explained by differences in implementation of T2-STIR between vendors. The T2-STIR sequences could probably become more equal if they are further improved and standardized.
Conclusions
In images of diagnostic quality, T2-STIR and CE-SSFP provide similar estimates of MaR, were constant over the first week, and were not affected by treatment. CE-SSFP had a higher degree of diagnostic quality images compared with T2 imaging for sequences from two out of the three vendors. Therefore, CE-SSFP is currently more suitable for implementation in multicentre, multi-vendor clinical trials.
Conflict of interest: H.A. is a shareholder of Imacor. H.A., E.H., M.C., and H.E. have been part-time employees in Imacor.
Funding
The study was funded by The Swedish Heart and Lung Foundation, Region of Scania, and the Medical Faculty of Lund University. CHILL-MI was funded by Region of Skane, Philips Healthcare, Lund University and Uppsala University. MITOCARE was funded by Trophos Pharmaceutical Company and the European Commission (7th Framework, Grant Agreement HEALTH-2010-261034). Funding to pay the Open Access publication charges for this article was provided by the Medical Faculty of Lund University.
Appendix 1
Long- and short-axis slices covering the left ventricle were acquired ∼15 min after injection of the gadolinium-based contrast agent. The LGE images were acquired using an inversion-recovery gradient-recalled echo sequence, with or without phase-sensitive reconstruction (PSIR), with a slice thickness of 8 mm with no slice gap. In-plane resolution was typically 1.5 × 1.5 mm. Inversion time was adjusted to null the signal of viable myocardium.11 Infarcted myocardium was delineated from the short-axis LGE images according to a previously described method.23
Appendix 2
T2-STIR typical imaging parameters from DICOM files
| Parameter | Vendor 1 | Vendor 2 | Vendor 3 |
|---|---|---|---|
| Pixel size X (mm) | 1.5 (1.0–2.0) | 2.2 (1.9–2.3) | 1.5 (1.4–1.6) |
| Pixel size Y (mm) | 1.7 (1.2–2.0) | 2.5 (2.3–2.9) | 2.1 (1.4–2.5) |
| TI (ms) | 150 | 180 | 150 (150–170) |
| TE (ms) | 73 (59–84) | 100 (65–100) | 47 (47–63) |
| ETL (n) | 32 (31–32) | 32 (31–33) | 15 (15–15) |
| Bandwidth (KHz) | 94 (63–125) | 93 (72–138) | 60 (60–61) |
| Slice thickness (mm) | 8 | 8 | 8 |
| TR (n of heartbeats) | 2 | 2 | 2 (1–3a) |
| Time (s) | 161 (67–268) | 204 (158–241) | 306 (226–372) |
Numbers are given as median (interquartile range).
TI, inversion time; TE, echo time; ETL, echo train length; TR, repetition time; time, time to acquire a full short-axis stack.
aOne instance using a TR of 1 heartbeat and one instance using a TR of 3 heartbeats.
CE-SSFP typical imaging parameters from DICOM files
| Parameter | Vendor 1 | Vendor 2 | Vendor 3 |
|---|---|---|---|
| Pixel size X (mm) | 1.7 (1.1–2.3) | 1.3 (1.1–1.7) | 0.8 (0.8–0.9) |
| Pixel size Y (mm) | 2.3 (1.3–2.7) | 1.4 (1.2–1.9) | 1.2 (1.1–1.4) |
| α (°) | 57.5 (45–70) | 60 (60–60) | 65 (54–71) |
| TE (ms) | 1.6 (1.4–1.8) | 1.7 (1.5–1.8) | 1.3 (1.1–1.5) |
| VPS (n) | 19 (16–24) | 12 (11–16) | 16 (13–23) |
| Bandwidth (KHz) | 164 (109–219) | 200 (196–200) | 197 (179–227) |
| Slice thickness (mm) | 8 | 8 | 8 |
| TR (ms, range) | 3.7 (3.2–4.0) | 3.5 (3.1–3.6) | 2.9 (2.6–3.5) |
| Time (s) | 98 (90–193) | 156 (107–189) | No information |
| Temporal resolution (ms) | 30 (28–33) | 21 (18–30) | 51 (39–65) |
Numbers are given as median (interquartile range).
α, Flip angle; TE, echo time; VPS, views per segment; TR, repetition time; time, time to acquire a full short-axis stack.
Quality control
The same protocol for quality control was used for both the CHILL-MI and the MITOCARE trials. Before inclusion began, all centres had to qualify by sending images from two patients, including LGE, T2-STIR, and CE-SSFP, which they considered to be of diagnostic quality to the core lab. The core lab then ensured that the images were of sufficient quality before a centre was accepted.
During inclusion, all studies were continuously evaluated by the core lab.
Appendix 3
The D'Agostino and Pearson test was used to test for normality. T2-STIR (P = 0.22) and CE-SSFP (P = 0.07) of diagnostic quality did not show statistically significant deviation from a Gaussian distribution, neither did controls (T2-STIR: P = 0.29, CE-SSFP: P = 0.18) or treated (T2-STIR: P = 0.39, CE-SSFP: P = 0.15) in the CHILL-MI subset nor controls (T2-STIR: P = 0.53, CE-SSFP: P = 0.20) or treated (T2-STIR: P = 0.81, CE-SSFP: P = 0.09) in the MITOCARE subset.
Appendix 4
| CMR characteristics | ||
|---|---|---|
| MaR by CE-SSFP (% LV) | 36 ± 10 | |
| MaR by T2-STIR (% LV) | 36 ± 11 | |
| Infarct by LGE (% LV) | 17 ± 10 | |
| MSI (% MaR) | 54 ± 18 | |
| Ejection fraction (%) | 48 ± 9 | |
| Heart rate during CMR (beats/min) | 68 ± 12 | |
| CE-SSFP | T2-STIR | |
| MaR, hypothermia treated (% LV) | 36 ± 10 | 36 ± 12 |
| MaR, CHILL-MI controls (% LV) | 37 ± 12 | 37 ± 11 |
| MaR, TRO40303 treated (% LV) | 35 ± 10 | 37 ± 12 |
| MaR, MITOCARE controls (% LV) | 35 ± 10 | 36 ± 11 |
| Image quality ‘non-diagnostic’ (n) | 4 | 70 |
| Image quality ‘acceptable’ (n) | 52 | 63 |
| Image quality ‘good’ (n) | 148 | 67 |
Numbers are given as mean ± SD.
MaR, myocardium at risk; % LV, per cent of left ventricular mass; LGE, late gadolinium enhancement; CMR, cardiac magnetic resonance imaging; CE-SSFP, contrast-enhanced SSFP; T2-STIR, T2-weighted short tau inversion recovery.
| Patient characteristics | |
|---|---|
| Number of patients (n) | 215 |
| Complete CE-SSFP datasets (n) | 204 |
| Complete T2-STIR datasets (n) | 200 |
| Treated with hypothermia (n) | 50 |
| Treated with TRO40303 (n) | 60 |
| Culprit vessel by angiography | |
| LAD (n) | 84 |
| LCx (n) | 25 |
| RCA (n) | 106 |
| Peak cTnTa (ng/L) | 12 100 ± 9300 |
| Peak hsTnTb (ng/L) | 7000 ± 4600 |
| Time from pain to balloon (min) | 184 ± 73 |
| Time from ischaemic event to CMR (days) | 3.8 ± 1.4 |
| MR Day 1 (n) | 2 |
| MR Day 2 (n) | 39 |
| MR Day 3 (n) | 53 |
| MR Day 4 (n) | 53 |
| MR Day 5 (n) | 40 |
| MR Day 6 (n) | 19 |
| MR Day 7 (n) | 3 |
| MR Day 8 (n) | 2 |
| MR day unknown (n) | 4 |
CE-SSFP, contrast-enhanced SSFP; T2-STIR, T2-weighted short tau inversion recovery; cTnT, fourth-generation cardiac troponin T; hsTnT, high-sensitivity troponin T; CMR, cardiac magnetic resonance imaging.
aPatients in the MITOCARE trial.
bPatients in the CHILL-MI trial.
Appendix 5
| Parameter | T2-STIR |
CE-SSFP |
||
|---|---|---|---|---|
| Figure 3A | Figure 3B | Figure 3A | Figure 3B | |
| Pixel size X (mm) | 1 | 1 | 0.80 | 0.80 |
| Pixel size Y (mm) | 1 | 1 | 1.20 | 1.20 |
| α (°) | 180 | 180 | 76 | 73 |
| TE (ms) | 47 | 47 | 1.12 | 1.12 |
| ETL (n) | 15 | 15 | 15 | 15 |
| Bandwidth (KHz) | 61 | 61 | 179 | 182 |
| Slice thickness (mm) | 8 | 8 | 8 | 8 |
| TR (ms) | 1756 | 2056 | 2.6 | 2.6 |
| Temporal resolution (ms) | – | – | 39 | 39 |
| TI (ms) | 170 | 170 | – | – |
| Heart rate | 64 | 69 | 64 | 69 |
α, Flip angle; TE, echo time; ETL, echo train length; TR, repetition time; TI, inversion time.
References
- 1.Reimer KA, Lowe JE, Rasmussen MM, Jennings RB. The wavefront phenomenon of ischemic cell death. 1. Myocardial infarct size vs duration of coronary occlusion in dogs. Circulation 1977;56:786–94. [DOI] [PubMed] [Google Scholar]
- 2.Lowe JE, Reimer KA, Jennings RB. Experimental infarct size as a function of the amount of myocardium at risk. Am J Pathol 1978;90:363–79. [PMC free article] [PubMed] [Google Scholar]
- 3.Lee JT, Ideker RE, Reimer KA. Myocardial infarct size and location in relation to the coronary vascular bed at risk in man. Circulation 1981;64:526–34. [DOI] [PubMed] [Google Scholar]
- 4.Braunwald E, Kloner RA. Myocardial reperfusion: a double-edged sword? J Clin Invest 1985;76:1713–9. [DOI] [PMC free article] [PubMed] [Google Scholar]
- 5.Gerczuk PZ, Kloner RA. An update on cardioprotection. J Am Coll Cardiol 2012;59:969–78. [DOI] [PubMed] [Google Scholar]
- 6.Friedrich MG, Abdel-Aty H, Taylor A, Schulz-Menger J, Messroghli D, Dietz R. The salvaged area at risk in reperfused acute myocardial infarction as visualized by cardiovascular magnetic resonance. J Am Coll Cardiol 2008;51:1581–7. [DOI] [PubMed] [Google Scholar]
- 7.Hedström E, Engblom H, Frogner F, Aström-Olsson K, Ohlin H, Jovinge S et al. Infarct evolution in man studied in patients with first-time coronary occlusion in comparison to different species—implications for assessment of myocardial salvage. J Cardiovasc Magn Reson 2009;11:38. [DOI] [PMC free article] [PubMed] [Google Scholar]
- 8.Simonetti OP, Kim RJ, Fieno DS, Hillenbrand HB, Wu E, Bundy JM et al. An improved MR imaging technique for the visualization of myocardial infarction. Radiology 2001;218:215–23. [DOI] [PubMed] [Google Scholar]
- 9.Kim RJ, Wu E, Rafael A, Chen E-L, Parker MA, Simonetti O et al. The use of contrast-enhanced magnetic resonance imaging to identify reversible myocardial dysfunction. N Engl J Med 2000;343:1445–53. [DOI] [PubMed] [Google Scholar]
- 10.Carlsson M, Ubachs JFA, Hedström E, Heiberg E, Jovinge S, Arheden H. Myocardium at risk after acute infarction in humans on cardiac magnetic resonance. JACC Cardiovasc Imaging 2009;2:569–76. [DOI] [PubMed] [Google Scholar]
- 11.Aletras AH, Kellman P, Derbyshire JA, Arai AE. ACUT2E TSE-SSFP: a hybrid method for T2-weighted imaging of edema in the heart. Magn Reson Med 2008;59:229–35. [DOI] [PubMed] [Google Scholar]
- 12.Kellman P, Aletras AH, Mancini C, McVeigh ER, Arai AE. T2-prepared SSFP improves diagnostic confidence in edema imaging in acute myocardial infarction compared to turbo spin echo. Magn Reson Med 2007;57:891–7. [DOI] [PMC free article] [PubMed] [Google Scholar]
- 13.Aletras AH, Tilak GS, Natanzon A, Hsu L-Y, Gonzalez FM, Hoyt RFJ et al. Retrospective determination of the area at risk for reperfused acute myocardial infarction with T2-weighted cardiac magnetic resonance imaging: histopathological and displacement encoding with stimulated echoes (DENSE) functional validations. Circulation 2006;113:1865–70. [DOI] [PubMed] [Google Scholar]
- 14.Ganame J, Messalli G, Dymarkowski S, Rademakers FE, Desmet W, Van De Werf F et al. Impact of myocardial haemorrhage on left ventricular function and remodelling in patients with reperfused acute myocardial infarction. Eur Heart J 2009;30:1440–9. [DOI] [PubMed] [Google Scholar]
- 15.Sörensson P, Heiberg E, Saleh N, Bouvier F, Caidahl K, Tornvall P et al. Assessment of myocardium at risk with contrast enhanced steady-state free precession cine cardiovascular magnetic resonance compared to single-photon emission computed tomography. J Cardiovasc Magn Reson 2010;12:25. [DOI] [PMC free article] [PubMed] [Google Scholar]
- 16.Ubachs JFA, Sorensson P, Engblom H, Carlsson M, Jovinge S, Pernow J et al. Myocardium at risk by magnetic resonance imaging: head-to-head comparison of T2-weighted imaging and contrast-enhanced steady-state free precession. Eur Hear J Cardiovasc Imaging 2012;13:1008–15. [DOI] [PMC free article] [PubMed] [Google Scholar]
- 17.Erlinge D, Götberg M, Lang I, Holzer M, Noc M, Clemmensen P et al. Rapid endovascular catheter core cooling combined with cold saline as an Adjunct to Percutaneous Coronary Intervention For the Treatment of Acute Myocardial Infarction (The CHILL-MI trial). J Am Coll Cardiol 2014;63:1857–65. [DOI] [PubMed] [Google Scholar]
- 18.Atar D, Arheden H, Berdeaux A, Bonnet J-L, Carlsson M, Clemmensen P et al. Effect of intravenous TRO40303 as an adjunct to primary percutaneous coronary intervention for acute ST-elevation myocardial infarction: MITOCARE study results. Eur Heart J 2015;36:112–9. [DOI] [PubMed] [Google Scholar]
- 19.MITOCARE Study Group. Rationale and design of the ‘MITOCARE’ study: a Phase II, multicenter, randomized, double-blind, placebo-controlled study to assess the safety and efficacy of TRO40303 for the reduction of reperfusion injury in patients undergoing percutaneous coronary in. Cardiology 2012;123:201–7. [DOI] [PubMed] [Google Scholar]
- 20.Heiberg E, Sjögren J, Ugander M, Carlsson M, Engblom H, Arheden H. Design and validation of segment—freely available software for cardiovascular image analysis. BMC Med Imaging 2010;10:1. [DOI] [PMC free article] [PubMed] [Google Scholar]
- 21.Arheden H, Saeed M, Higgins CB, Gao DW, Bremerich J, Wyttenbach R et al. Measurement of the distribution volume of gadopentetate dimeglumine at echo-planar MR imaging to quantify myocardial infarction: comparison with 99mTc-DTPA autoradiography in rats. Radiology [Internet] 1999;211:698–708. Available from: http://www.ncbi.nlm.nih.gov/pubmed/10352594. [DOI] [PubMed] [Google Scholar]
- 22.Arheden H, Saeed M, Higgins CB, Gao DW, Ursell PC, Bremerich J et al. Reperfused rat myocardium subjected to various durations of ischemia: estimation of the distribution volume of contrast material with echo-planar MR imaging. Radiology [Internet] 2000;215:520–8. Available from: http://www.ncbi.nlm.nih.gov/pubmed/10796935. [DOI] [PubMed] [Google Scholar]
- 23.Rohrer M, Bauer H, Mintorovitch J, Requardt M, Weinmann H-J. Comparison of magnetic properties of MRI contrast media solutions at different magnetic field strengths. Invest Radiol [Internet] 2005;40:715–24. Available from: http://www.ncbi.nlm.nih.gov/pubmed/16230904. [DOI] [PubMed] [Google Scholar]
- 24.Bieri O, Scheffler K. Fundamentals of balanced steady state free precession MRI. J Magn Reson Imaging 2013;38:2–11. [DOI] [PubMed] [Google Scholar]
- 25.Keegan J, Gatehouse PD, Prasad SK, Firmin DN. Improved turbo spin-echo imaging of the heart with motion-tracking. J Magn Reson Imaging 2006;24:563–70. [DOI] [PubMed] [Google Scholar]
- 26.Persson E, Palmer J, Pettersson J, Warren SG, Borges-Neto S, Wagner GS et al. Quantification of myocardial hypoperfusion with 99m Tc-sestamibi in patients undergoing prolonged coronary artery balloon occlusion. Nucl Med Commun 2002;23:219–28. [DOI] [PubMed] [Google Scholar]
- 27.Pereztol-Valdés O, Candell-Riera J, Santana-Boado C, Angel J, Aguadé-Bruix S, Castell-Conesa J et al. Correspondence between left ventricular 17 myocardial segments and coronary arteries. Eur Heart J 2005;26:2637–43. [DOI] [PubMed] [Google Scholar]
- 28.Payne AR, Casey M, McClure J, McGeoch R, Murphy A, Woodward R et al. Bright-blood T2-weighted MRI has higher diagnostic accuracy than dark-blood short tau inversion recovery MRI for detection of acute myocardial infarction and for assessment of the ischemic area at risk and myocardial salvage. Circ Cardiovasc Imaging 2011;4:210–9. [DOI] [PubMed] [Google Scholar]
- 29.Viallon M, Mewton N, Thuny F, Guehring J, O'Donnell T, Stemmer A et al. T2-weighted cardiac MR assessment of the myocardial area-at-risk and salvage area in acute reperfused myocardial infarction: comparison of state-of-the-art dark blood and bright blood T2-weighted sequences. J Magn Reson Imaging 2012;35:328–39. [DOI] [PubMed] [Google Scholar]
- 30.Aletras AH. Quantitative in vivo T2 measurements differentiate both infarcted and peri-infarct from normal myocardium. Circulation 2007;116:758. [Google Scholar]
- 31.Ugander M, Bagi PS, Oki AJ, Chen B, Hsu L-Y, Aletras AH et al. Myocardial edema as detected by pre-contrast T1 and T2 CMR delineates area at risk associated with acute myocardial infarction. JACC Cardiovasc Imaging 2012;5:596–603. [DOI] [PMC free article] [PubMed] [Google Scholar]
- 32.Hammer-Hansen S, Ugander M, Hsu L-Y, Taylor J, Kellman P, Arai AE. Distinction of salvaged and infarcted myocardium within the ischemic area at risk with T2 mapping. J Cardiovasc Magn Reson 2014;16(Suppl. 1):M3. [DOI] [PMC free article] [PubMed] [Google Scholar]
- 33.Thuny F, Lairez O, Roubille F, Mewton N, Rioufol G, Sportouch C et al. Post-conditioning reduces infarct size and edema in patients with ST-segment elevation myocardial infarction. J Am Coll Cardiol 2012;59:2175–81. [DOI] [PubMed] [Google Scholar]
- 34.White SK, Frohlich GM, Sado DM, Maestrini V, Fontana M, Treibel TA et al. Remote ischemic conditioning reduces myocardial infarct size and edema in patients with ST-segment elevation myocardial infarction. JACC Cardiovasc Interv 2015;8:178–88. [DOI] [PubMed] [Google Scholar]
- 35.Sjögren J, Ubachs JF, Engblom H, Carlsson M, Arheden H, Heiberg E. Semi-automatic segmentation of myocardium at risk in T2-weighted cardiovascular magnetic resonance. J Cardiovasc Magn Reson 2012;14:10. [DOI] [PMC free article] [PubMed] [Google Scholar]
- 36.López-martín GJ, Ech T, García-ruiz JM, Molina-iracheta A, Rosselló X. Myocardial edema after ischemia/reperfusion is not stable and follows a bimodal pattern. J Am Coll Cardiol 2015;65:315–23. [DOI] [PubMed] [Google Scholar]