

Abstract
The aim of the study is to investigate if the fat content of the liver and pancreas may indicate impaired glucose tolerance (IGT) or type 2 diabetes mellitus (T2DM). A total of 83 subjects (34 men; aged 46.5 ± 13.5 years) were characterized as T2DM, IGT, or normal glucose tolerant (NGT). NGT individuals were stratified as <40 or ≥40 years. Standard laboratory tests were conducted for insulin resistance and β-cell dysfunction. The magnetic resonance imaging Dixon technique was used to determine fat distribution in the liver and pancreas. Correlations among liver and pancreatic fat volume fractions (LFVFs and PFVFs, respectively) and laboratory parameters were analyzed. Among the groups, fat distribution was consistent throughout sections of the liver and pancreas, and LFVFs closely correlated with PFVFs. LFVFs correlated more closely than PFVFs with insulin resistance and β-cell function. Both the LFVFs and PFVFs were the highest in the T2DM patients, less in the IGT, and least in the NGT; all differences were significant. The PFVFs of the NGT subjects ≥40 years were significantly higher than that of those <40 years. The fat content of the liver and pancreas, particularly the liver, may be a biomarker for IGT and T2DM.
Keywords: fat volume fraction, liver, magnetic resonance imaging, pancreas, type 2 diabetes mellitus
1. Introduction
Type 2 diabetes mellitus (T2DM) afflicts ∼387 million people worldwide and has become a major threat to public health.[1] Features of T2DM include insulin resistance and pancreatic β-cell dysfunction.[2,3] The accumulation of fat in the liver and excessive accumulation of visceral adipose tissue are reported risk factors for insulin resistance.[3] In addition, ectopic fat deposition in the pancreas has been correlated with β-cell dysfunction and decreased insulin secretion, leading to high blood glucose levels.[4] Therefore, fat accumulation in the liver, pancreas, or both may contribute to the pathogenesis of diabetes.
Recently, much research has been conducted regarding fat content in the liver and muscles and its possible clinical associations.[5,6] Few studies have focused on the quantification of pancreatic fat and its health implications. Because excessive fat deposition in the liver or pancreas may be a detriment to the endocrine system that can lead to diabetes or other metabolic disorders, the fat content of these organs could serve as predictive or monitoring indicators in T2DM.
Various methods have been applied for measuring human visceral fat.[5–7] For example, liver biopsy is the reference standard for liver fat quantification. However, biopsy is invasive and subject to sampling error. Furthermore, biopsy is not feasible to assess the pancreatic fat content in humans because of the retroperitoneal location and variable shape of the pancreas.[5]
Currently, imaging techniques for noninvasive internal organ fat detection or quantification include magnetic resonance (MR) imaging (MRI). MRI is considered an ideal method for this purpose due to its high resolution of soft-tissues, radiation-free character, and high accuracy. The gold standard among all the noninvasive methods for accurate quantification of fat content of internal organs is MR spectroscopy (MRS).[7,8] However, MRS is time consuming to perform and can depict the fat content of only a portion of the organs; the placement of voxels requires operator expertise, especially in small organs of irregular shape.[9] In addition, the accuracy of MRS can be compromised due to shift of the abdominal organs in response to the breathing motions of the diaphragm.[10]
The MR Dixon technique is another method for fat quantification that is widely applied. Some researchers have verified the better accuracy of the Dixon technique relative to that of MRS or liver biopsy.[6,9–11] The MR Dixon technique is based on an in-phase/out-of-phase cycling of fat and water to enable fat-only or water-only images, and is much easier to perform compared with MRS.[10,11] Separate water- and fat-phase images can be acquired within a single breath-hold, and this minimizes errors that are due to the motion of organs caused by breathing. Furthermore, the Dixon technique can provide an overall view of fat deposition in the internal organs and can assess fat content across the entire liver, rather than only a specific region of interest (ROI).[12] In recent years, the MR Dixon technique has been used extensively for liver fat content, but few studies have focused on quantitative assessment of fat content in the pancreas.[4,6]
We previously verified the accuracy of the MR Dixon technique and compared the fat content of the liver in people with or without impaired glucose tolerance (IGT).[12] We found that IGT patients with higher liver fat content were more resistant to insulin and had a higher risk of developing T2DM.[12] In the present study, to investigate further the potential value of pancreatic fat content to monitor the development and progression of T2DM and for strategizing treatment, we compared the liver and pancreatic fat content of subjects with IGT, T2DM, or normal glucose tolerance (NGT). An association was then investigated between pancreatic fat content and laboratory indices that reflect insulin resistance or pancreatic β-cell function.
2. Materials and methods
2.1. Ethics statement
The Research Ethics Committee of First Affiliated Hospital of Sun Yat-sen University approved this study, which was conducted in accordance with ethical guidelines for human research and the Health Insurance Portability and Accountability Act (HIPAA). All the subjects provided written informed consent. Permission was obtained from the hospital for the publication of medical images contained in the figures.
2.2. Subjects and clinical data
A total of 83 subjects were enrolled in the study (34 men, 49 women; aged 46.5 ± 13.5 years), including patients from our hospital and healthy volunteers, from January 2013 to January 2015. All the subjects conformed to the following criteria: adults; no or minimal alcohol consumption (<20 g alcohol/d for women and <30 g alcohol/d for men); serum ferritin <1000 μg/L; and the absence of any forms of liver or pancreatic disease, including inflammation, tumor, or autoimmune disease.
For the diagnosis of IGT and T2DM, we applied the 2013 criteria of the American Diabetes Association.[13] According to these criteria, there were 17 individuals with T2DM (7 men, 10 women; 54.8 ± 7.9 years), 20 with IGT (5 men, 15 women; 52.9 ± 6.7 years), and the remaining 46 subjects comprised the normal glucose tolerance (NGT) group (22 men, 24 women; 41.0 ± 14.6 years). The NGT group was further stratified as either younger or older than 40 years (NGT-young and NGT-elder, respectively. The NGT-elder group consisted of 14 men and 15 women (51.0 ± 7.4 y); and the NGT-young group comprised 8 men and 9 women (26.1 ± 4.8 years). All the patients enrolled in this study were newly diagnosed as type 2 diabetes and had undergone no clinical intervention.
The subjects were tested for the following: body mass index (BMI), body fat content, glycosylated hemoglobin (HbA1c), fasting blood glucose (FBG), total cholesterol (CHOL), triglyceride (TG), high-density lipoprotein (HDL), low-density lipoprotein (LDL), alanine aminotransferase (ALT), aspartate aminotransferase (AST), fasting plasma insulin (FPI), homeostasis model assessment (HOMA) of insulin resistance (HOMA-IR), HOMA of β-cell function (HOMA-β), insulin action index (IAI), and quantitative insulin sensitivity index (QUICKI).
2.3. MR protocol
Each subject underwent an upper-abdominal MRI examination while supine with a 3-Tesla whole-body human MRI scanner (SIEMENS 3.0T MAGNETOM Verio). The scanning protocol involved an initial set of localizer images and then a T1 volumetric interpolated breath-hold examination (VIBE) Dixon sequence, and covered all upper abdominal organs, including the liver and pancreas. The imaging parameters were: TE1 2.5 ms; TE2 3.7 ms; repetition time 5.47 ms; 5° flip angle; ± 504.0 kHz per pixel receiver bandwidth; and a slice thickness of 3.0 mm. All the subjects were carefully instructed to hold their breath during end inspiration to ensure consistency among subjects.
2.4. MR image postprocessing and analysis
A fat volume fraction (FVF) map was generated using a plug-in algorithm created under the MATLAB platform (MATLAB r2011b, MathWorks), which was also adopted in our previous study.[12]
For the liver examination, a trained radiologist manually drew 8 square-shaped regions of interest (ROIs; 10 × 10 mm2) on each liver segment, avoiding vascular and biliary structures (Fig. 1). The average FVF values were recorded.
Figure 1.
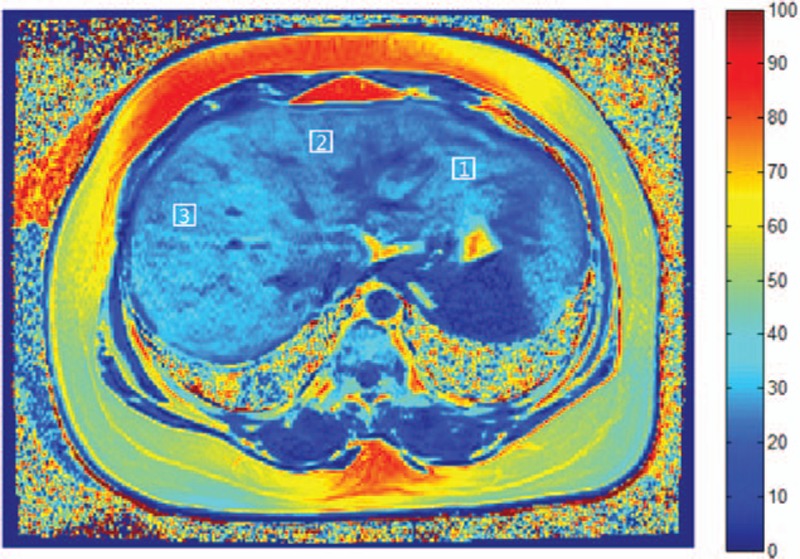
FVF map of the liver of a 54-year-old woman from the T2DM group. Square-shaped ROIs (10 × 10 mm2) were manually drawn on each of 8 hepatic segments, avoiding vascular and biliary structures. ROI-1: segment II; ROI-2: segment IV; ROI-3: segment VIII. Key scale on the right represents fat percentage. FVF, fat volume fraction; ROI, region of interest; T2DM, type 2 diabetes mellitus.
For the pancreas, 3 square-shaped ROIs (5 × 5 mm2) were manually drawn on the head, body, and tail of the pancreas, respectively (Fig. 2). The average FVF values were calculated.
Figure 2.
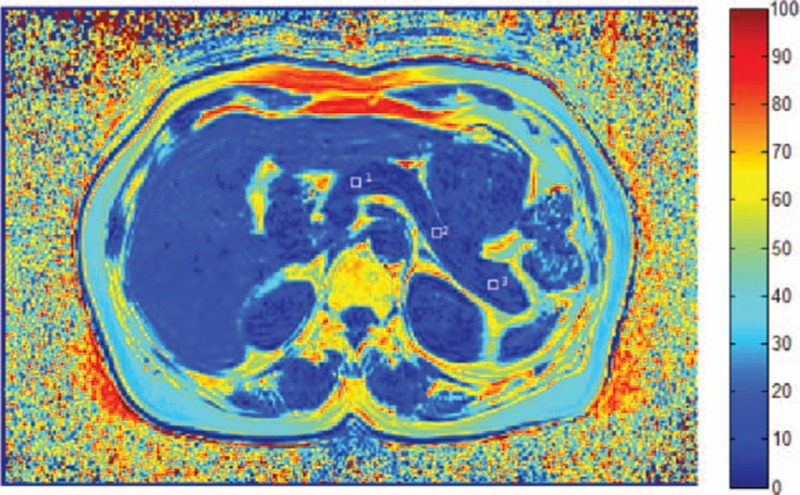
FVF map of the pancreas of a 43-year-old woman from the IGT group. Square-shaped ROIs (5 × 5 mm2) were manually drawn on the pancreas head (ROI-1), body (ROI-2), and tail (ROI-3). Key scale on the right represents fat percentage. FVF, fat volume fraction; IGT, impaired glucose tolerance; ROI, region of interest.
2.5. Statistical analysis
The FVFs of the 8 hepatic segments per subject and the differences in FVFs among the pancreas head, body, and tail were evaluated by variance analysis or nonparametric test (Kruskal–Wallis test and Mann–Whitney test), depending on whether the data were normally distributed. The FVFs of the liver/pancreas of the 3 groups were compared using the Kruskal–Wallis test. Statistical correlations between the FVFs and the results of the clinical/laboratory tests were determined by Pearson's correlation for normally distributed data, or by Spearman's rank correlation for data that was not normally distributed. A correlation between liver FVFs (LFVFs) and pancreas FVFs (PFVFs) was also analyzed. Logistic regression analysis was performed for the identification of independent risk factors, including age, gender, BMI, LFVF, PFVF, body fat content, HbA1c, FBG, CHOL, TG, LDL, ALT, AST, FPI, HOMA-IR, HOMA β, IAI, and QUICKI. A P-value <0.05 was considered statistically significant. All the analyses were performed with SPSS software (SPSS, Version 13.0, Chicago, IL).
3. Results
3.1. Fat distribution in the liver and pancreas
MR images of all subjects were acquired successfully. FVF maps of each subject were generated from the source images (Fig. 3).
Figure 3.
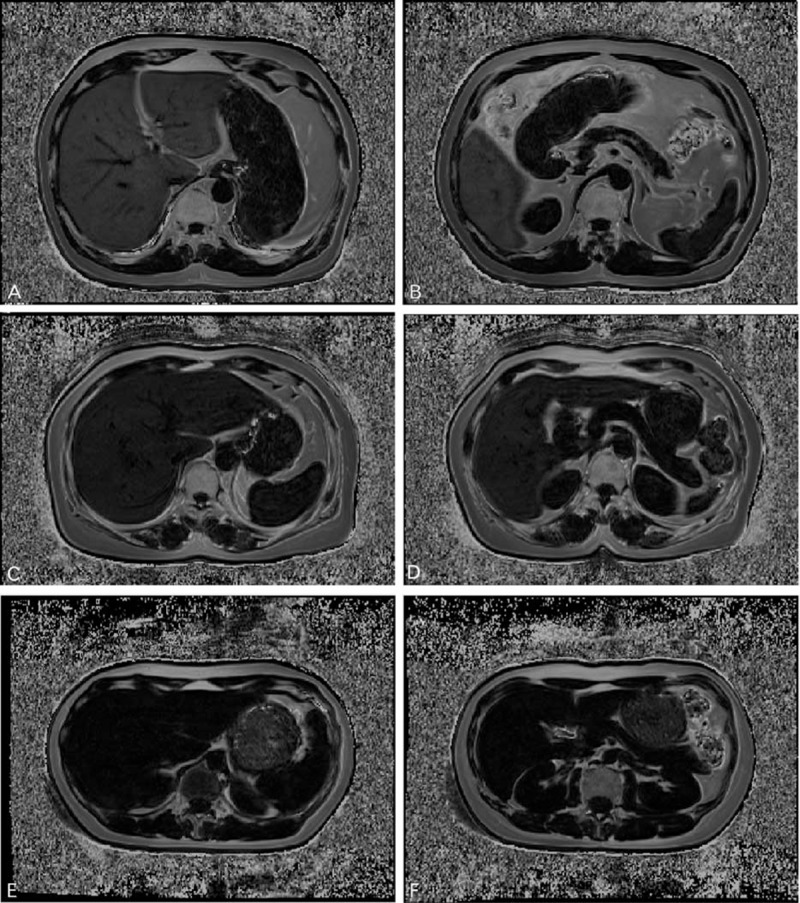
Represent FVF maps of the liver (left) and pancreas (right) of women in the (A, B) T2DM, (C, D) IGT, and (E, F) NGT groups. (A, B) A 62-year-old woman who was first diagnosed as T2DM, with a mean LFVF of 25.8% and a mean PFVF of 15.4%. (C, D) A 43-year-old woman diagnosed as IGT, with a mean LFVF of 14.3% and PFVF of 6.6%. (E, F) A 25-year-old healthy NGT woman with a mean LFVF of 3.8% and PFVF of 5.0%. Fat content (correlated with signal intensity) is highest in the T2DM subject, less in the IGT subject, and least in the NGT woman. FVF, fat volume fraction; LFVF, FVF of liver; NGT, normal glucose tolerant; T2DM, type 2 diabetes mellitus.
For all the subjects, LFVFs ranged from 3.1% to 30.1%. The FVFs of the 8 liver segments were statistically similar for each subject (P = 0.77) and within each group (PT2DM = 0.87, PIGT >0.99, PNGT = 0.14, Fig. 4A). The PFVFs ranged from 2.8% to 25.2%. The FVFs of the pancreas head, body, and tail were statistically similar in each subject (P = 0.84) and within each group (PT2DM = 0.95, PIGT = 0.75 PNGT > 0.99, Fig. 4B). The LFVFs and PFVFs closely correlated (P < 0.001, r2 = 0.69).
Figure 4.
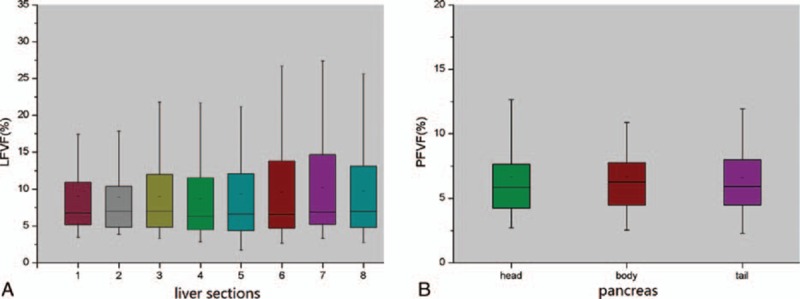
Boxplots of LFVF and PFVF in liver and pancreas. (A) LFVF values in different liver segments. There was no statistical differences among the FVFs of 8 liver segments (P = 0.77). (B) PFVF values in the pancreas head, body, and tail. No significant difference was found among them (P = 0.84). FVF, fat volume fraction; LFVF, FVF of liver; PFVF, FVF of pancreas.
3.2. Clinical and laboratory test results of the NGT, IGT, and T2DM groups
Subjects in the T2DM group had higher levels of HbA1c (P < 0.001), FBG (P < 0.001), TG (P < 0.001), LDL (P = 0.03), AST (P = 0.02), HOMA-IR (P = 0.03), and HOMA β (P < 0.001) compared with the IGT and NGT groups, and had lower levels of HDL (P = 0.03) and QUICKI (P < 0.001). BMI, body fat content, CHOL, ALT, FPI, and IAI were similar among the 3 groups (P > 0.05).
3.3. Liver or pancreatic fat content and laboratory tests
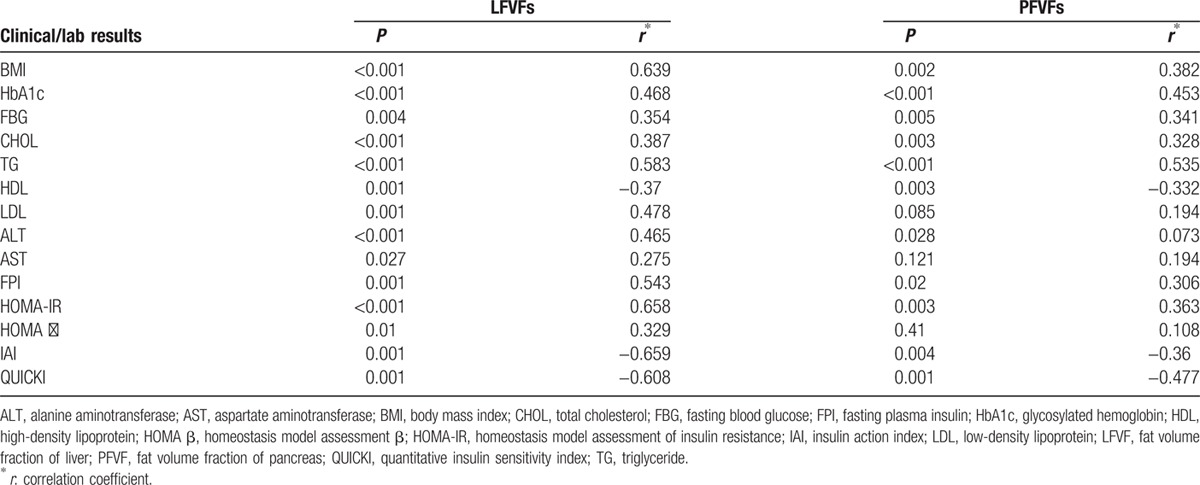
When the subjects were analyzed collectively, LFVFs correlated positively with BMI, HbA1c, FBG, CHOL, TG, LDL, ALT, AST, FPI, HOMA-IR, and HOMA-β. PFVFs correlated positively with BMI, HbA1c, FBG, CHOL, TG, ALT, FPI, and HOMA-IR. Both LFVFs and PFVFs correlated negatively with HDL, IAI, and QUICKI. LFVFs correlated more closely with the laboratory test results than PFVFs did (Table 1).
Table 1.
Correlation between FVFs and clinical/laboratory results.
3.4. Comparisons of fat content of liver or pancreas among the NTG, IGT, and T2DM groups
In this study, the NGT group was divided into an NGT-young and NGT-elder group because the fat content in the pancreas of the NGT-elder group was significantly higher than that of the NGT-young (P < 0.001). However, the fat content of the liver was similar between the NGT-young and NGT-elder groups (P = 0.086). Therefore, volunteers of the NGT group were randomly chosen for the liver fat content analysis.
The LFVFs of the T2DM, IGT, and NGT groups were statistically different (P < 0.001, χ2 = 32.81, Fig. 5A) as follows. Based on results of the Mann–Whitney test, the mean LFVF of the T2DM group was significantly higher than that of the IGT (P = 0.01) or NGT (P < 0.001) groups, and the LFVF of the IGT group was significantly higher than that of the NGT (P < 0.001).
Figure 5.
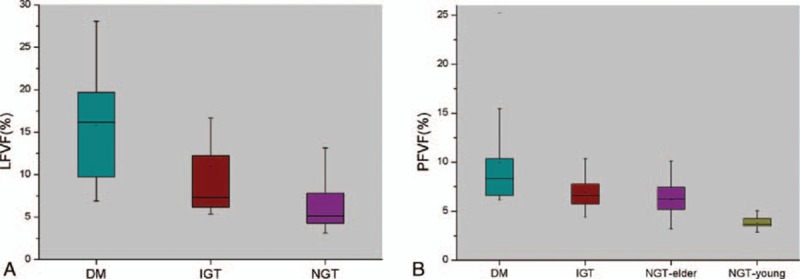
Boxplots of LFVF and PFVF in liver and pancreas of the patient groups. (A) LFVF values for the T2DM, IGT, and NGT groups. LFVFs in the T2DM group were significantly higher than that of the IGT (P = 0.011) and NGT (P < 0.001) groups, and LFVFs in the IGT group were significantly higher than that of the NGT group (P < 0.001). (B) PFVF values of the T2DM, IGT, NGT-elder, and NGT-young groups. PFVFs in the NGT-elder group were higher than that of the NGT-young group (P < 0.001), whereas no significant difference were found between the NGT-elder group and IGT groups (P = 0.20). PFVFs in the T2DM group were higher than that of the IGT (P = 0.007) and NGT-elder (P < 0.001) groups. FVF, fat volume fraction; IGT, impaired glucose tolerance; LFVF, FVF of liver; PFVF, FVF of pancreas; NGT, normal glucose tolerant; T2DM, type 2 diabetes mellitus.
For the pancreas, the mean PFVF of the NGT-elder group was significantly higher than that of the NGT-young group (P < 0.001, Fig. 5B), but the PFVF of the NGT-elder and IGT groups were similar (P = 0.20). The PFVF of the T2DM group was significantly higher than that of the IGT (P = 0.007) or NGT-elder group (P < 0.001).
3.5. Logistic regression analysis for independent risk factors of IGT and T2DM
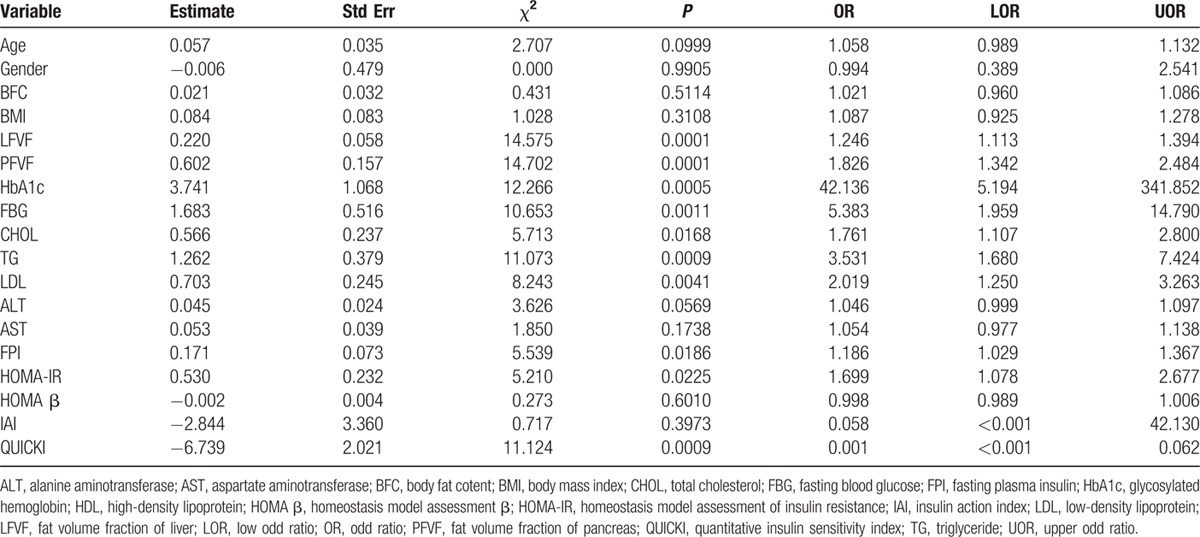
Univariate logistic regression analysis indicated that IGT and T2DM were significantly associated with LFVF, PFVF, HbA1c, FBG, CHOL, TG, LDL, FPI, HOMA-IR, and QUICKI, but there was no significant association with age, gender, BMI, body fat content, ALT, AST, HOMA β, or IAI (Table 2). The variates with P < 0.1, including age, LFVF, PFVF, HbA1c, FBG, CHOL, TG, LDL, ALT, FPI, HOMA-IR and QUICKI, were analyzed together in a multivariate logistic regression analysis, and no significant association was found. After stepwise regression analysis, LFVF (P = 0.01, OR = 1.162) and PFVF (P = 0.007, OR = 1.562) were found to be significantly associated with a risk of IGT and T2DM.
Table 2.
Univariate logistic regression analysis.
4. Discussion
Ectopic fat deposition is considered excessive fat accumulation at undesired sites, including the liver, skeletal muscle, heart, and pancreas, and strongly correlates with metabolic diseases.[14] Many studies have focused on the liver fat content in nonalcoholic fatty liver disease and found that fat content closely correlated with BMI, LDL, TG, and FBG. These results suggest that fat accumulation in the liver affects the metabolism of lipids and may contribute to the development and progression of diabetes.[8,15,16] Fewer reports have concerned the fat content of the pancreas and its clinical implications, although excessive fat deposition in the pancreas may lead to cellular dysfunction and endocrine disorders that can result in diabetes or other problems of metabolism.[17] Thus, the quantification of the fat content of internal organs, especially the pancreas, has profound meaning for the clinical intervention of metabolic disorders.
In this study, we not only quantified the fat content of both the liver and pancreas using the MR Dixon technique, but also analyzed the fat deposition pattern in these organs. Furthermore, to investigate a correlation between liver or pancreatic fat accumulation and insulin resistance and β-cell function, we evaluated the liver and pancreatic fat content of T2DM and IGT patients relative to NGT subjects.
According to this study, no statistical difference was found among the FVFs of 8 liver segments, neither for all subjects, nor for each group (T2DM, IGT, and NGT). This implies that the deposition of fat in the liver was relatively consistent. This may be explained by liquid metabolic mechanisms. Donnelly et al[18] reported that 59% of hepatic fat is derived from circulating free fatty acids. Under normal circumstances, free fatty acids in the bloodstream are taken into the liver for the synthesis of TG. The endogenous TG is bonded to lipoproteins and secreted as a constituent of very-low-density lipoproteins.[2] When the efficiency of TG synthesis exceeds the transporting capacity of the lipoproteins, TG will accumulate in the liver in the form of lipid droplets, resulting in fatty liver.[2,19] Therefore, fat distribution in the liver due to metabolic disorders tends to be consistent throughout the organ, without any region-specific predisposition. Furthermore, we found in the present study that the fat quantity of the pancreas head, body, and tail was statistically similar, which implies that fat accumulation in the pancreas also tends to be consistent throughout. This is in accord with some previous reports.[9]
Although the mechanism of fat accumulation in the pancreas is still unclear, it may closely relate to the same mechanisms that contribute to fatty liver, because ectopic fat deposition is a systematic process resulting from abnormal lipid metabolism. Moreover, in the present study, it was determined that LFVFs correlated positively with PFVFs, so that individuals with higher liver fat content were also likely to have a higher PFVF. This further suggests that fat accumulation in the pancreas and liver have similar and related mechanisms. Therefore, for patients with IGT or T2DM, fat deposits in the liver and pancreas tend to be homogeneously distributed.
Previous studies have shown that liver fat content may be closely associated with several clinical and laboratory parameters.[11,19,20] In the present study, we further explored correlations between FVFs of the liver and pancreas and clinical data that are indicative of insulin resistance and β-cell dysfunction. We found that LFVFs correlated positively with BMI, CHOL, TG, LDL, ALT, and AST, which is in accord with previous reports.[19,20] PFVFs correlated positively with BMI, CHOL, TG, and ALT. People with a high BMI tend to have a higher fat content in the liver, due to increased burden on the liver from high levels of free fatty acids in the blood. When the burden overwhelms the ability of the liver to process lipids, fat will gradually accumulate in the liver.[15] CHOL, TG, and LDL are important participants in the lipid metabolic process and their levels in the blood can reflect the lipid processing function of the liver, and subsequently the existence and severity of fatty liver.[19] Moreover, excessive fat accumulation can cause damage to liver cells, leading to elevated secretions of ALT and AST.[11]
The present study also revealed that subjects with high LFVFs and PFVFs have higher levels of HbA1c, FBG, FPI, and HOMA-IR. HbA1c and FBG indicate blood glucose level and are essential diagnostic parameters for IGT and T2DM. FPI reflects the body's sensitivity to insulin, in which high FPI is usually associated with low insulin sensitivity. HOMA-IR can be calculated from the FPI and suggests the severity of insulin resistance. Therefore, our results indicate that people with high LFVFs and PFVFs are more resistant to insulin. Moreover, IAI and QUICKI are quantitative indices that reflect insulin sensitivity and the severity of resistance. In the present study, both LFVFs and PFVFs correlated negatively with IAI and QUICKI. These results further confirm that subjects with high LFVFs and PFVFs have lower insulin sensitivity and may be more resistant to insulin.
According to the results, LFVFs correlated more closely with insulin resistance than did PFVFs. This might be explained by the extremely important role of the liver in glucose and lipid metabolism.[21] Normal metabolism is disturbed when insulin resistance occurs, and liver is the first to be affected, leading to a direct accumulation of lipid droplets in liver cells.[22] However, it remains controversial whether fat deposition in the liver is a cause or consequence of insulin resistance. On the one hand, when insulin resistance occurs, insulin secretion levels will elevate, which promotes fatty acid synthesis in the liver. Interventions that ameliorate insulin resistance can lower insulin levels and decrease liver fat content.[23,24] On the other hand, fatty liver and insulin resistance usually occur together, leading to the hypothesis that excess fat deposition in the liver causes insulin resistance.[20] However, there is no doubt that insulin resistance and fatty liver and pancreas are tightly linked. Low insulin sensitivity and resistance to insulin are thought to be essential factors in the pathogenesis of abnormal glucose tolerance and diabetes. Therefore, based on the results, we suggest that LFVFs and PFVFs are closely associated with the development of IGT and T2DM.
Tushuizen et al[25] found nondiabetic subjects to have a negative correlation between pancreatic fat content and indices that reflect β-cell function, but this was not true of T2DM patients. In the present study, we enrolled T2DM and IGT patients as well as subjects with NGT, and explored the correlation between PFVFs and HOMA-β. HOMA-β reflects the insulin secretion level and is usually applied for evaluating the function of islet β-cells. According to the present study, LFVFs correlated positively with HOMA-β (P = 0.01, r2 = 0.33), but no statistical correlation was found between PFVFs and HOMA-β (P = 0.41, r2 = 0.11). A possible explanation could be the complex situation when both insulin resistance and β-cell dysfunction occur concurrently. Excessive fat accumulation in the pancreas may disturb the function of β-cells and decrease insulin secretion.[26] However, as mentioned previously, high LFVFs are frequently accompanied by severe insulin resistance, which stimulates the secretion of β-cells.[27] In addition, for individuals with diabetes, there may be other factors, which can further impair β-cell function.[27,28] All these factors result in complicated associations among LFVFs, PFVFs, and HOMA-β in the short term. In the long run, however, decreased insulin secretion has an essential role in the pathology of T2DM, because it raises plasma glucose levels and decreases muscle glucose uptake.[4] Decreased insulin also promotes lipolysis in adipocytes, leading to increased plasma free fatty acids, which further aggravates insulin resistance and impaired β-cell function.[28]
According to some previous reports, the fat content of the pancreas is closely associated with age.[29,30] In our study, all the subjects in both the T2DM and IGT groups were >40 years, whereas 17 of the 46 subjects in the NGT group were <40 years. Therefore, to reduce possible errors in PFVFs, which may be caused by age, we divided the NGT group into those younger and older than 40 years (NGT-young and NGT-elder, respectively). The PFVFs in the NGT-elder group were significantly higher than that of the NGT-young group. This is in accord with previous reports that pancreatic fat content increases with age, because fatty infiltration usually occurs during the degeneration of the pancreas.[29,30] However, the fat content of the liver was similar between the NGT-young and NGT-elder groups. This indicated that fat accumulation was not so strongly associated with age. Furthermore, PFVFs in the T2DM group were higher than that of either the IGT or NGT-elder group, and the LFVF of the T2DM group was significantly higher than that of the IGT or NGT groups. These results suggest that with increased LFVF, PFVF, or both, people may have more severe β-cell function damage and may be more resistant to insulin, which makes them vulnerable to IGT or diabetes.
According to the present univariate logistic regression analysis, HbA1c, FBG, CHOL, TG, LDL, FPI, HOMA-IR, and QUICKI are independent risk factors for IGT and T2DM. These indices are clinical references for assessing and diagnosing abnormal glucose tolerance and insulin resistance. The Kruskal–Wallis test also indicated that there was a significant difference among the NGT, IGT, and T2DM groups with respect to HbA1c, FBG, TG, HDL, LDL, AST, HOMA-IR, HOMA β, and QUICKI. On the other hand, age, gender, BMI, body fat content, ALT, AST, HOMA β, and IAI were not statistically independent risk factors for IGT and T2DM. This result may be limited by the sample size, and indices such as BMI, body fat content, ALT, and AST are frequently influenced by other diseases and conditions. Furthermore, our results also revealed that LFVF and PFVF were risk factors for IGT and T2DM. Yet, the multivariate analysis of all variates with a P value <0.1 showed negative results. The possible explanation is that there are many risk factors, which can contribute to the development of IGT and T2DM, and it may be that it is the interaction of >1 factor that constitutes the risk. The stepwise regression analysis revealed LFVF and PFVF to be independent risk factors of IGT and T2DM.
In summation, PFVFs and LFVFs have a role in the development of IGT and T2DM, and may be applied as potential indicators of abnormal glucose tolerance and T2DM. This could be important for the prevention and treatment of T2DM. PFVFs and LFVFs may be ideal indices to assess the effect of treatment over time for patients with abnormal glucose tolerance and T2DM.
Footnotes
Abbreviations: ALT = alanine aminotransferase, AST = aspartate aminotransferase, BMI = body mass index, CHOL = total cholesterol, FBG = fasting blood glucose, FPI = fasting plasma insulin, FVF = fat volume fraction, HbA1c = glycosylated hemoglobin, HDL = high-density lipoprotein, HOMA β = homeostasis model assessment β, HOMA-IR = homeostasis model assessment of insulin resistance, IAI = insulin action index, IGT = impaired glucose tolerance, LDL = low-density lipoprotein, LFVF = FVF of liver, MR = magnetic resonance, PFVF = FVF of pancreas, QUICKI = quantitative insulin sensitivity index, T2DM = type 2 diabetes mellitus, TG = triglyceride.
ZD, YL, and HC equally contributed to this study.
All authors meet the requirements for authorship and manuscript submission. ZPL and STF conceived and carried out experiments. ZD and YJL performed experiments. HSC performed the MR scan on each subject. ZWZ designed the plug-in algorithm for FVF maps. MJJ, ZPP, and CL collected and analyzed data. All authors were involved in writing the paper and had final approval of the submitted and published versions.
This work was funded by the National Natural Science Foundation of China (81571750), Natural Science Foundation of Guangdong Province (2014A030311018, 2014A030310484, and 2015A030313043), and S&T Programs (2014A020212125) of Guangdong Province.
The authors have no conflicts of interest to disclose.
References
- 1.Chng MH, Alonso MN, Barnes SE, et al. Adaptive immunity and antigen-specific activation in obesity-associated insulin resistance. Mediators Inflamm 2015; 2015:593075. [DOI] [PMC free article] [PubMed] [Google Scholar]
- 2.Thomas EL, Fitzpatrick JA, Malik SJ, et al. Whole body fat: content and distribution. Prog Nucl Mag Res SP 2013; 73:56–80. [DOI] [PubMed] [Google Scholar]
- 3.Hu HH, Nayak KS, Goran MI. Assessment of abdominal adipose tissue and organ fat content by magnetic resonance imaging. Obes Rev 2011; 12:e504–e515. [DOI] [PMC free article] [PubMed] [Google Scholar]
- 4.Lee JS. Clinical implications of fatty pancreas: correlations between fatty pancreas and metabolic syndrome. World J Gastroenterol 2009; 15:1869. [DOI] [PMC free article] [PubMed] [Google Scholar]
- 5.Sijens PE. MRI-determined fat content of human liver, pancreas and kidney. World J Gastroenterol 2010; 16:1993. [DOI] [PMC free article] [PubMed] [Google Scholar]
- 6.D’Assignies G, Ruel M, Khiatet A, et al. Noninvasive quantitation of human liver steatosis using magnetic resonance and bioassay methods. Eur Radiol 2009; 19:2033–2040. [DOI] [PubMed] [Google Scholar]
- 7.Pokharel SS, Macura KJ, Kamel IR, et al. Current MR imaging lipid detection techniques for diagnosis of lesions in the abdomen and pelvis. Radiographics 2013; 33:681–702. [DOI] [PubMed] [Google Scholar]
- 8.Idilman IS, Tuzun A, Savas B, et al. Quantification of liver, pancreas, kidney, and vertebral body MRI-PDFF in non-alcoholic fatty liver disease. Abdom Imaging 2015; 40:1512–1519. [DOI] [PubMed] [Google Scholar]
- 9.Livingstone RS, Begovatz P, Kahl S, et al. Initial clinical application of modified Dixon with flexible echo times: hepatic and pancreatic fat assessments in comparison with 1H MRS. Magn Reson Mater Phys Biol Med 2014; 27:397–405. [DOI] [PubMed] [Google Scholar]
- 10.Hu HH, Kim H, Nayak KS, et al. Comparison of fat–water MRI and single-voxel MRS in the assessment of hepatic and pancreatic fat fractions in humans. Obesity 2009; 18:841–847. [DOI] [PMC free article] [PubMed] [Google Scholar]
- 11.Leporq B, Ratiney H, Pilleul F, et al. Liver fat volume fraction quantification with fat and water T1 and T 2∗ estimation and accounting for NMR multiple components in patients with chronic liver disease at 1.5 and 3.0 T. Eur Radiol 2013; 23:2175–2186. [DOI] [PubMed] [Google Scholar]
- 12.Dong Z, Luo Y, Zhang Z, et al. MR quantification of total liver fat in patients with impaired glucose tolerance and healthy subjects. PLoS One 2014; 9:e111283. [DOI] [PMC free article] [PubMed] [Google Scholar]
- 13.American Diabetes Association Executive summary: standards of medical care in diabetes—2013. Diabetes Care 2013; 35 Suppl 1:S4–S10.(PMCID: PMC3537272). [DOI] [PMC free article] [PubMed] [Google Scholar]
- 14.Sattar N, Gill Jason MR. Type 2 diabetes as a disease of ectopic fat? BMC Med 2014; 12:123. [DOI] [PMC free article] [PubMed] [Google Scholar]
- 15.Rossi AP, Fantin F, Zamboni GA, et al. Predictors of ectopic fat accumulation in liver and pancreas in obese men and women. Obesity 2011; 19:1747–1754. [DOI] [PubMed] [Google Scholar]
- 16.Patel NS, Peterson MR, Brenner DA, et al. Association between novel MRI-estimated pancreatic fat and liver histology-determined steatosis and fibrosis in non-alcoholic fatty liver disease. Aliment Pharm Ther 2013; 37:630–639. [DOI] [PMC free article] [PubMed] [Google Scholar]
- 17.Heni M, Machann J, Staiger H, et al. Pancreatic fat is negatively associated with insulin secretion in individuals with impaired fasting glucose and/or impaired glucose tolerance: a nuclear magnetic resonance study. Diabetes Metab Res Rev 2010; 26:200–205. [DOI] [PubMed] [Google Scholar]
- 18.Donnelly KL, Smith CI, Schwarzenberg SJ, et al. Sources of fatty acids stored in liver and secreted via lipoproteins in patients with nonalcoholic fatty liver disease. J Clin Invest 2005; 115:1343–1351. [DOI] [PMC free article] [PubMed] [Google Scholar]
- 19.Cohen JC, Horton JD, Hobbs HH. Human fatty liver disease: old questions and new insights. Science 2011; 332:1519–1523. [DOI] [PMC free article] [PubMed] [Google Scholar]
- 20.Hooper AJ, Adams LA, Burnett JR. Genetic determinants of hepatic steatosis in man. J Lipid Res 2011; 52:593–617. [DOI] [PMC free article] [PubMed] [Google Scholar]
- 21.Fabbrini E, Magkos F. Hepatic steatosis as a marker of metabolic dysfunction. Nutrients 2015; 7:4995–5019.2015. [DOI] [PMC free article] [PubMed] [Google Scholar]
- 22.Firneisz G. Non-alcoholic fatty liver disease and type 2 diabetes mellitus: the liver disease of our age? World J Gastroenterol 2014; 20:9072–9089. [DOI] [PMC free article] [PubMed] [Google Scholar]
- 23.Bhargava R, Senior PA, Ackerman TE, et al. Prevalence of hepatic steatosis after islet transplantation and its relation to graft function. Diabetes 2004; 53:1311–1317. [DOI] [PubMed] [Google Scholar]
- 24.Semple RK, Sleigh A, Murgatroyd PR. Postreceptor insulin resistance contributes to human dyslipidemia and hepatic steatosis. J Clin Invest 2009; 2:315–322. [DOI] [PMC free article] [PubMed] [Google Scholar]
- 25.Tushuizen ME, Bunck MC, Pouwels PJ, et al. Pancreatic fat content and beta-cell function in men with and without type 2 diabetes. Diabetes Care 2007; 30:2916–2921. [DOI] [PubMed] [Google Scholar]
- 26.Kahn SE, Hull RL, Utzschneider KM. Mechanisms linking obesity to insulin resistance and type 2 diabetes. Nature 2006; 444:840–846. [DOI] [PubMed] [Google Scholar]
- 27.Cusi K. The role of adipose tissue and lipotoxicity in the pathogenesis of type 2 diabetes. Curr Diabetes Rep 2010; 10:306–315. [DOI] [PubMed] [Google Scholar]
- 28.Hannukainen JC, Borra R, Linderborg K, et al. Liver and pancreatic fat content and metabolism in healthy monozygotic twins with discordant physical activity. J Hepatol 2011; 54:545–552. [DOI] [PubMed] [Google Scholar]
- 29.Saisho Y, Butler AE, Meier JJ, et al. Pancreas volumes in humans from birth to age one hundred taking into account sex, obesity, and presence of type-2 diabetes. Clin Anat 2007; 20:933–942. [DOI] [PMC free article] [PubMed] [Google Scholar]
- 30.Wang CY, Ou HY, Chen MF, et al. Enigmatic ectopic fat: prevalence of nonalcoholic fatty pancreas disease and its associated factors in a Chinese population. J Am Heart Assoc 2013; 3:e297. [DOI] [PMC free article] [PubMed] [Google Scholar]