

Supplemental Digital Content is available in the text
Keywords: etiology, NAFLD, NASH, risk, therapy
Abstract
We aimed to assess the dietary patterns associated with nonalcoholic fatty liver disease (NAFLD) and the efficacy of dietary interventions in a real-life setting at a tertiary medical center in Northern Germany.
Clinical and laboratory data as well as data obtained by a semiquantitative food frequency questionnaire of 55 consecutive patients diagnosed with NAFLD were compared to an age and gender-matched cohort of 88 healthy individuals by univariate analysis. The efficacy of the dietary intervention was assessed in a subgroup of 24 NAFLD patients 6 months after receiving dietary advice. Macronutritional components of the diet were normalized for absolute daily energy intake.
NAFLD patients consumed more calories per day as compared with healthy controls (P <0.001). The absolute amounts of most nutritional components ingested by NAFLD patients were higher than those of the controls. However, there were no significant differences with regards to the relative consumption of carbohydrates (P = 0.359), fat (P = 0.416), and fructose (P = 0.353) per 1000 kcal energy intake. NAFLD patients displayed a higher intake of glucose/1000 kcal (P = 0.041) and protein/1000 kcal (P = 0.009) but a lower intake of fibers/1000 kcal (P < 0.001) and mineral nutrients/1000 kcal (P = 0.001) than healthy controls. In the longitudinal analysis patients significantly reduced their caloric intake and their ALT levels improved 6 months after the dietary counselling (P < 0.001).
Our data from a German real-life cohort demonstrate that dietary patterns of patients with NAFLD display great variability and little disease specificity, while the most distinctive feature compared with healthy controls was higher energy intake in NAFLD patients.
1. Introduction
Nonalcoholic fatty liver disease (NAFLD) is endemic in high-income countries with an estimated prevalence of 20% to 30% and is often associated with components of metabolic syndrome and obesity.[1–3] NAFLD may even progress to nonalcoholic steatohepatitis (NASH), liver cirrhosis, and hepatocellular carcinoma (HCC).[4,5] Furthermore, patients diagnosed with NAFLD have an increased risk of cardiovascular events and malignancies.[6,7] The etiology of NAFLD seems to be multicausal. Varying—and partly contradictory—dietary patterns have been identified to be associated with NAFLD by different authors. For example, NAFLD patients have been described to consume a fat-rich diet with low amounts of carbohydrates or an energy-dense protein- and carbohydrate-rich diet with high amounts of glucose, fructose, and sucrose.[8,9] Furthermore, high fructose consumption was identified as a major risk factor for the development and severity of NAFLD.[10,11] There is, however, consensus that a weight reduction of at least 7% achieved through calorie restriction through low fat diet[12,13] or Mediterranean diet[14] and increased physical activity is effective in the treatment of overweight NASH patients. Mediterranean diet, avoidance of fructose, and processed foods along with the offer of structured lifestyle intervention programs have been included as therapeutic recommendations in the recent European guideline for the treatment of NAFLD.[15]
The primary aim of our study was to test the hypothesis that patients with NAFLD consume a diet with a distinctive, disease-specific nutrient composition as compared to healthy subjects. In a subgroup of patients we analyzed if dietary counselling leads to a change of nutrient composition and if this was associated with weight reduction and improvement of liver function tests.
2. Patients and methods
2.1. Study population
All patients seen for suspected NAFLD at the hepatology outpatient clinic of the Hamburg University Medical Center who received a dietary counselling from January 2012 to January 2014 were included in our study (N = 61). NAFLD was defined as: elevated alanine transaminase levels (ALT; upper limit of normal, ULN: 50 U/L for men, 35 U/L for women), liver steatosis in the ultrasound examination, and the exclusion of concomitant liver diseases (details on the exclusion of concomitant liver diseases can be found in the Supplementary material) or excessive alcohol consumption (>40 g/day for men and > 20 g/day for women).
For controls, anonymously sourced data for a gender- and age-matched healthy control group was obtained from the German cohort of the cross-sectional “Stress, Atherosclerosis and ECG Study” (STRATEGY), which had already recruited healthy men and women.[16] Six NAFLD patients younger than 25 years were excluded prior to the analysis due to an insufficient number of comparable young controls from the STRATEGY study. In total, 55 NAFLD patients and 88 controls were included in the final analysis.
2.2. Nutritional, clinical, laboratory, and technical evaluation of the study population
All NAFLD patients received a thorough clinical examination, routine laboratory tests, an ultrasound examination of the upper abdomen, a transient elastography of the liver (Fibroscan; Echosense, Paris, France) and a bioelectrical impedance analysis (BIA; BIA 101 Anniversary; SMT medical, Würzburg, Germany) prior to receiving in-depth dietary counselling.[17,18] Fibrosis was graded according to Kleiner from F0 to F4[19] and the results of the transient elastography were assigned to the fibrosis grades as suggested by Wong et al.[20] Therefore, F2 fibrosis was assumed in patients with 7.0 to 8.6 kPa, F3 in patients with 8.7 to 10.2 kPa, and F4 fibrosis in patients with ≥10.3 kPa. All patients completed a validated semiquantitative food frequency questionnaire (FFQ) as used in the “European Prospective Investigation into Cancer” (EPIC) study.[21] Data obtained by the FFQ were then validated by a nutritionist. Details on the dietary counselling and validation of the FFQ can be found in the Supplementary material. The lifestyle behavior of all NAFLD patients was graded in a sedentary lifestyle, a low-active lifestyle, or an active lifestyle according to the U.S. Department of Health and Human Services and the U.S. Department of Agriculture.[22]
2.3. Statistical analysis
Nutritional, clinical, anthropometric, laboratory, and BIA data from the NAFLD patients were compared to those of healthy controls by univariate analysis. Categorical variables were analyzed by Fisher exact test and continuous variables by a t test (for variables with an assumed Gaussian distribution, e.g., age) or Mann–Whitney U test (for non-normally distributed variables). Nutritional data obtained by the FFQ were normalized to 1000 kcal caloric intake. Statistical analyses were conducted using SPSS Version 22 (IBM Corporation, New York, NY) and the graphs were created using GraphPadPrism 4 (GraphPad Software Inc, La Jolla, CA). The study was approved by the local ethics committee (Ethikkommission der Ärztekammer Hamburg, PV4357).
3. Results
3.1. Comparison of clinical, laboratory, and nutritional data between NAFLD patients and controls
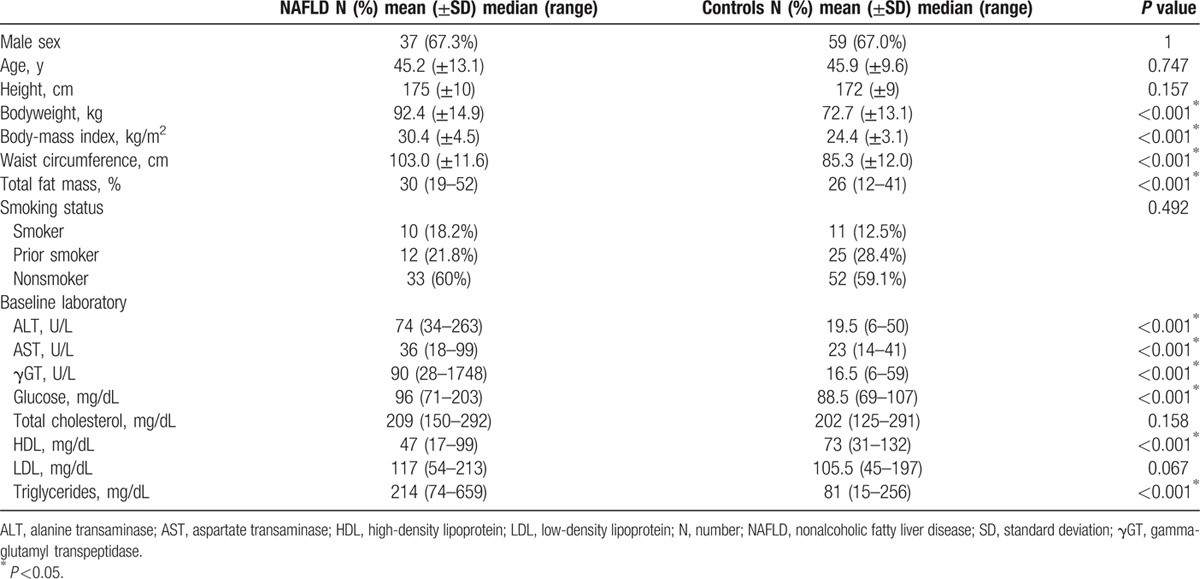
Details of the 143 NAFLD patients and controls are depicted in Table 1. The mean body weight, body mass index (BMI), waist circumference, fat mass, alanine aminotransferase (ALT), aspartate transaminase (AST), and gamma-glutamyl transpeptidase (γGT) levels were significantly higher in NAFLD patients compared with the controls (P <0.001, each). Also, levels of triglycerides, high-density lipoprotein cholesterol, and blood glucose significantly differed between the groups (P <0.001, each). The stage of fibrosis was assessed in 40 NAFLD patients either by successful transient elastography (N = 36) and/or by liver biopsy (N = 11). Three (7.5%) patients had F2 fibrosis and 4 (10%) patients F3 fibrosis, details are found in Supplementary Table 1. One patient was suspected for cirrhosis following transient elastography (liver stiffness 11.8 kPa), but liver cirrhosis was ruled out by mini-laparoscopy with liver biopsy. The most common comorbidities in the NAFLD group were hyperlipoproteinemia (N = 41, 74.5%), arterial hypertension (N = 16, 29.1%), and type 2 diabetes mellitus (N = 4, 7.3%). A sedentary lifestyle was found in 13 NAFLD patients, 22 patients reported a low active lifestyle behavior, and 20 patients had an active lifestyle. Twenty-seven patients were employed as office workers.
Table 1.
Clinical and laboratory assessments of patients with nonalcoholic fatty liver disease prior to the dietary counselling and controls.
NAFLD patients displayed a median daily total energy intake of 2739 kcal (range 1009–5941) compared with 2173 kcal (1199–4320) in the control group (P <0.001; Fig. 1A, Supplementary Table 2). The median total fat intake per day was 109 g (46–260) in the NAFLD group and 97 g (50–180) in the control group (P = 0.016). The daily amounts of consumed carbohydrates and protein in the NAFLD group were 293 g (68–697) and 100 g (41–216) respectively, compared with 222 g (137–529) and 74 g (36–185) in the control group (P <0.001, each). The daily ingested amounts of fiber were comparable between the groups (NAFLD patients with 24 g/day (range 8–50) vs. controls with 22 g/day (12–50); P = 0.848; Fig. 1, Supplementary Table 2).
Figure 1.
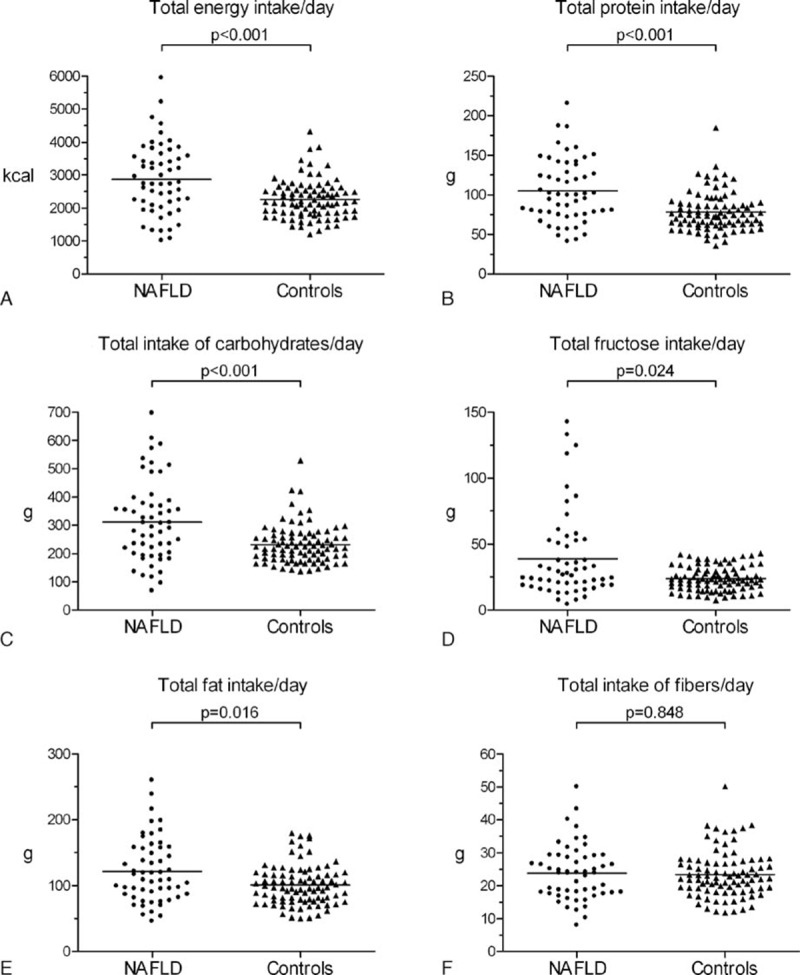
Dietary patterns in NAFLD patients and healthy controls. Vertical bars represent the median. NAFLD, nonalcoholic fatty liver disease.
3.2. Comparison of the composition of the diets of NAFLD patients and controls
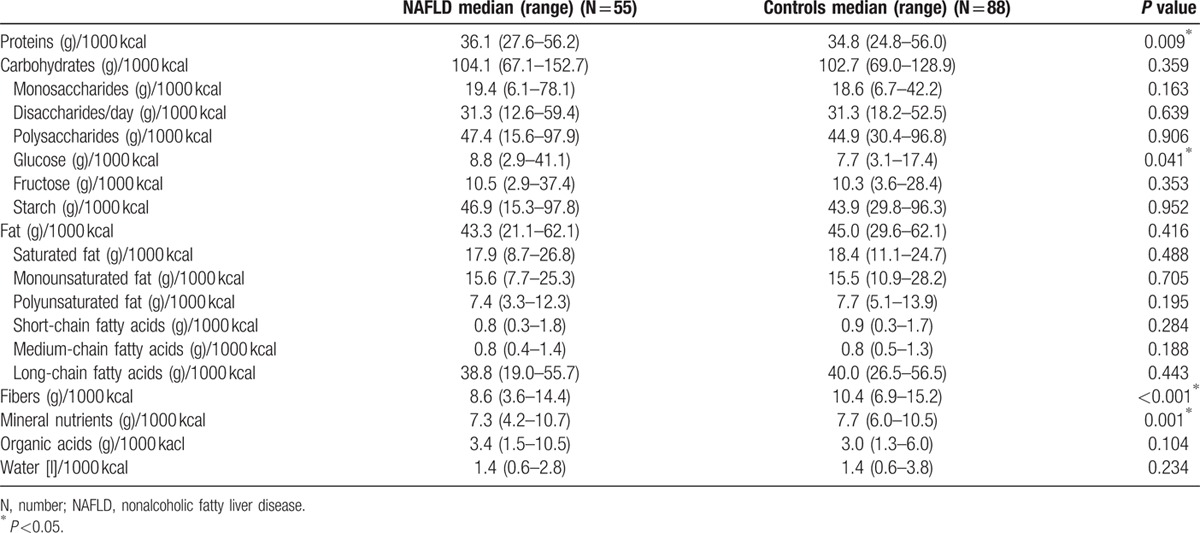
In the NAFLD group, compared with the control group, intake of fiber per 1000 kcal (8.6 (3.6–14.4) vs. 10.4 (6.9–15.2); P <0.001; Fig. 2E) and mineral nutrients per 1000 kcal (7.3 (4.2–10.7) vs. 7.7 (6.0–10.5); P <0.001; Fig. 2D) was significant lower. However, NAFLD patients had a higher intake of protein per 1000 kcal (36.1 (27.6–56.2) vs. 34.8 (24.8–56.0); P = 0.009; Fig. 2B) and glucose per 1000 kcal as compared with the healthy controls (8.8 (2.9–41.1) vs. 7.7 (3.1–17.4); P = 0.041; Table 2). Surprisingly, we did not detect a significant difference of the relative fructose intake per 1000 kcal between NAFLD patients and healthy controls (10.5 (2.9–37.4) vs. 10.3 (3.6–28.4); P = 0.353; Table 2). NALFD patients and controls did not differ significantly with regard to the intake of other dietary components when normalized to energy intake; for example, carbohydrates per 1000 kcal (P = 0.359; Fig. 2A), fat per 1000kcal (P = 0.416; Fig. 2C), and organic acids (P = 0.104; Fig. 2F). The results for further dietary components are displayed in Table 2.
Figure 2.
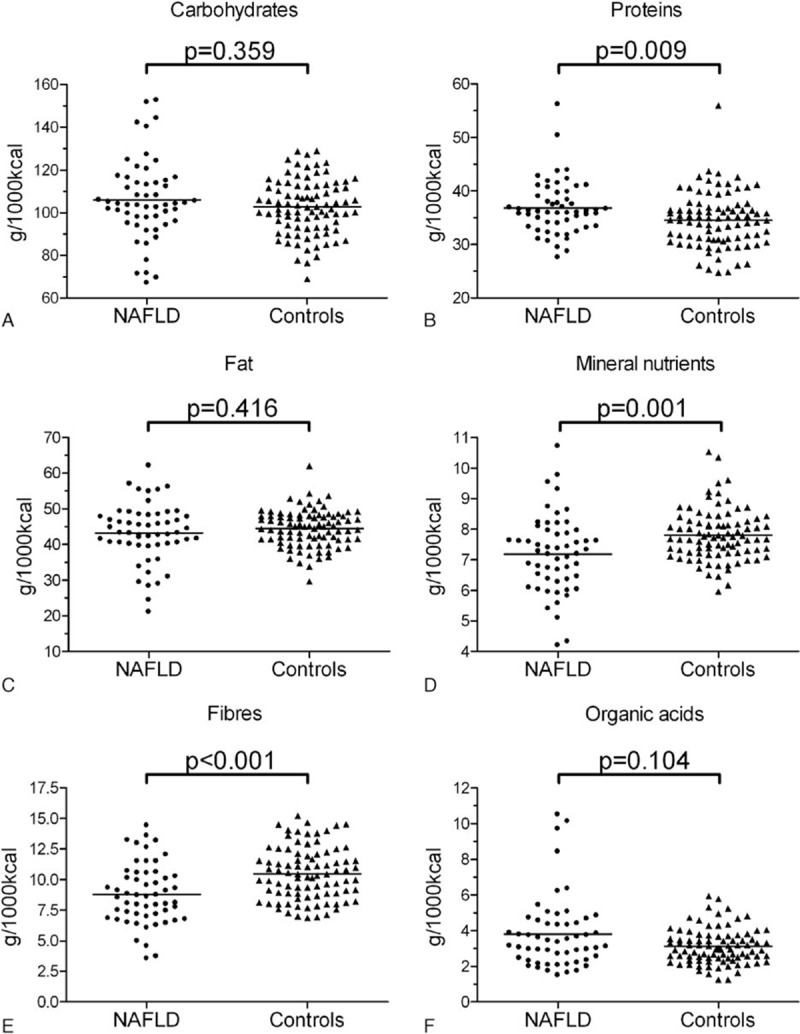
Macronutritional diet components in patients with NAFLD and controls. Each dot represents the specific nutritional component normalized to 1000 kcal per day of each patient. Vertical bars represent the median. NAFLD, nonalcoholic fatty liver disease.
Table 2.
(Macro-)nutritional components normalized to the daily energy intake (per 1000 kcal) in NAFLD patients compared with healthy controls.
Some of our NAFLD patients and controls were found to have a distinctive dietary pattern with an excess of one ore more nutrition components (Fig. 2). In detail, 5 NAFLD patients displayed an excessive carbohydrate consumption of more than 140 g per 1000 kcal per day, while none from the control group exceeded this level. For protein, an intake of more than 50 g per 1000 kcal per day was observed in 2 NAFLD patients and in 1 healthy control, while an excessive consumption of fat (>55 g/1000 kcal/day) was found in 5 NAFLD patients and only 1 from the controls. Of the NAFLD patients found with excess levels of fat and protein consumption, only 1 fell into both the categories simultaneously.
3.3. Evaluation of the efficacy of the dietary intervention in the NAFLD patients
A total of 24 patients (16 males and 8 females, mean age 46.2 years, SD = 11.7) completed a second FFQ 6 months after the first dietary counselling. None of these patients had diabetes mellitus, 8 patients had hypertension, and 20 patients suffered from hyperlipoproteinemia. The dietary composition at baseline was as follows: 43% carbohydrates (range 32%–62%), 42% fat (20%–53%), and 15% proteins (12%–21%).
The mean weight reduction was 3.4% (range −2% to 11%; Fig. 3A) of the baseline body weight of the overall group, while 9 patients (37.5%) achieved a weight loss of ≥5% and 2 patients (8.3%) achieved a weight loss of ≥7%.
Figure 3.
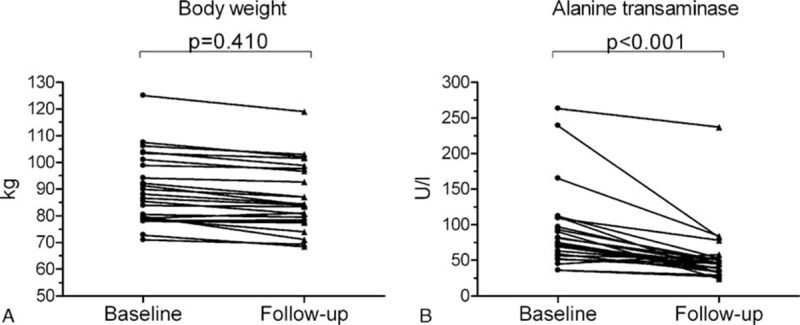
Median body weight and alanine transaminase levels pre and post diet counselling. Twenty-four patients attended a follow-up visit. Each line represents the course of 1 patient.
Univariate analyses revealed no statistically significant differences between NAFLD patients who achieved a weight loss of at least 5% and patients with a weight loss <5% at follow-up except for higher high-density lipoprotein levels in patients who did not achieve a significant weight loss (P = 0.009). Notably, only 1 of 8 females (12.5%) compared with 8 of 16 male NAFLD patients (50%) achieved a weight loss of ≥5% after 6 months (P = 0.178) and 4 of 13 patients (30.8%) with an office employment lost 5% of their baseline weight compared with 5 of 11 patients with other employments (retirees, saleswomen, technicians, unemployed, or manual workers, 45.5%, P = 0.675). Further details can be found in Supplementary Table 3.
At follow-up, patients displayed a significantly lower daily energy intake (median 2756 kcal (1078–5217) vs. 2074 kcal (1176–4184); P = 0.018; Fig. 4A) and showed a trend toward a lower carbohydrate consumption (median 104.3 g per 1000 kcal (77.8–151.8) vs. 99.2 g per 1000 kcal (73.9–119.3); P = 0.059; Fig. 4B) compared with the baseline diet. There was no difference in the daily consumption of proteins per 1000 kcal (median 36.8 g (28.8–50.4) vs. 36.9 g (25.6–46.0); P = 0.862; Fig. 4C), but a significantly higher consumption of fiber per 1000 kcal (median 9.2 g (4.6–14.4) vs. 10.7 g (7.2–15.8); P = 0.002; Fig. 4D) and fat per 1000 kcal (median 44.6 g (21.1–57.0) vs. 47.2 g (36.5–58.8); P = 0.024; Fig. 4E) were found at follow-up. Importantly, the consumption of glucose per 1000 kcal (median 8.7 g (3.9–41.1) vs. 7.7 g (3.2–11.4); P = 0.341) and fructose per 1000 kcal (median 9.6 g (4.9–36.9) vs. 10.1 g (3.9–16.3); P = 0.846) did not differ between baseline and follow-up. The 2 patients with an excess of the daily intake of carbohydrates (151.8 g carbohydrates/1000kcal/day) or proteins (50.4 g proteins/1000kcal/day) managed to achieve a more balanced diet at follow-up (Fig. 4B and C). The dietary composition after 6 months was as follows: 41% carbohydrates (range 30%–49%), 44% fat (34%–55%), and 15% proteins (10%–19%).
Figure 4.
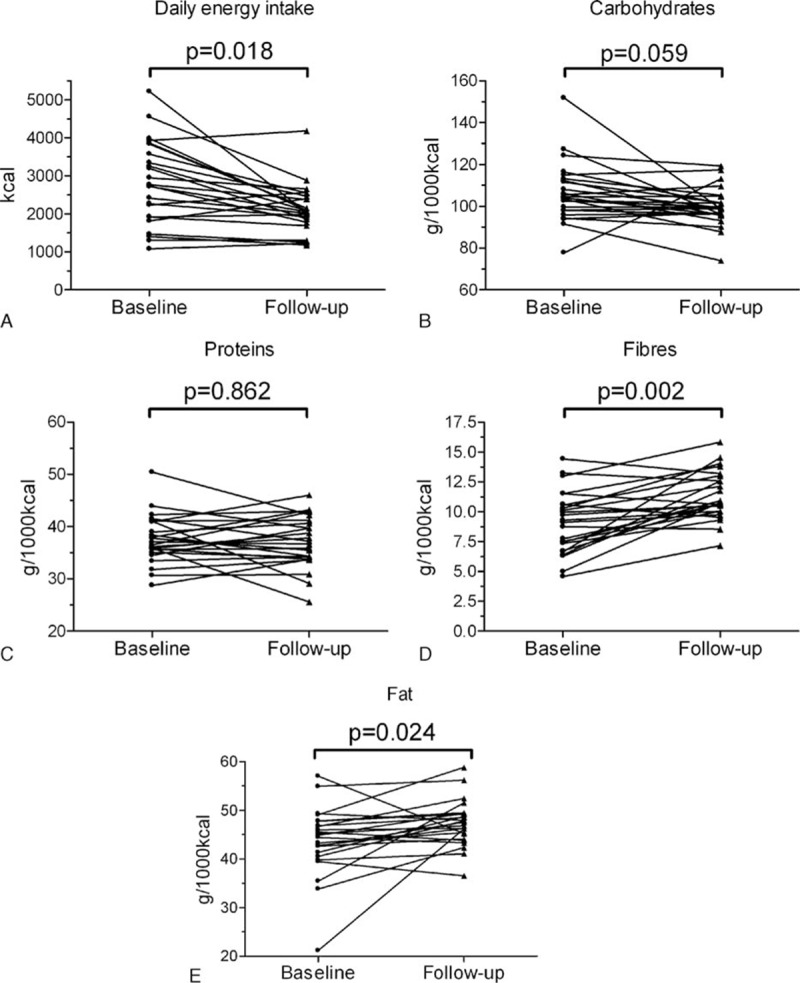
Total energy uptake and dietary patterns pre and postdiet counselling. Twenty-four patients attended a follow-up visit. The nutritional components were normalized to 1000 kcal per day of each patient. Each line represents the course of 1 patient.
The ALT levels at follow-up were significantly lower compared with the baseline values (median 75 U/L (36–263) vs. 45.5 U/L (24–237); P <0.001; Fig. 3B) and a normalization of ALT was achieved by 9 of 16 male and 6 of 8 female patients. However, due to the small number of patients who were available for follow-up, we found no association between weight loss or reduction of specific nutrition components and ALT improvement (data not shown).
4. Discussion
Specific dietary patterns are considered an underlying cause for the development of NAFLD. Thus, decoding of a “NAFLD risk diet” could lead to a more focussed nutritional counselling and thus enhance the effect of therapeutic interventions. Here, we present a comprehensive dietary and clinical assessment of 55 NAFLD patients in comparison to a well-described cohort of healthy individuals from the previously published STRATEGY study.[16]
The most striking dietary difference between our NAFLD cohort and healthy controls was the higher amount of overall daily energy intake. In contrast to these results, previous studies have reported various patterns showing excessive consumption of either mainly carbohydrates or rather mainly fat as being associated with the development of NAFLD and to its severity.[8,9] Dietary patterns of the NAFLD patients in our study varied to a great degree, consistent with the variation of published NAFLD-related diets. We found an energy-dense diet with relatively high amounts of protein and glucose, but poor in fiber and minerals to be associated with NAFLD. While the deviation from healthy controls was statistically significant, these NAFLD-specific dietary patterns were not as pronounced as the difference in overall energy intake. The total consumption of fructose was higher in our NAFLD patients compared with the healthy controls (Supplementary Table 2). This is in line with previous reports,[10,11,23] but in our study there was no significant difference in fructose ingestion normalized to the daily caloric intake. However, this does not exclude a dose-dependent hepatotoxic effect of fructose and solid data support an association between fructose intake and NAFLD progression.[10,11] Thus, reduction of total fructose consumption should be a goal of dietary counselling.
While the ingested total amounts of fibers were comparable between patients with NAFLD and controls, NAFLD patients actually displayed a significantly lower consumption of fibers per 1000 kcal compared with the controls. This is in line with the observation that the Mediterranean diet, which is rich in fibers, might not only prevent diabetes, cardiovascular disease, and obesity, but also NAFLD.[14] In view of this and the fact that low fiber intake may contribute to the elevated risk for colonic neoplasms in NAFLD patients[24,25] another independent goal of dietary counselling might be to increase fiber consumption.
Interestingly, while only 9 of 24 patients achieved a weight loss of ≥5% 6 months after the dietary counselling, all patients showed an improvement of their liver function tests and 15 of 24 patients had normal ALT values at follow-up. Thus, even if the weight loss of 7% to 10% considered necessary for histological improvement of NASH[12,13] was not achieved at 6 months, patients draw a significant benefit from dietary counselling. Apparently, improvement of liver function tests precedes significant weight loss and histological improvement.[13] However, due to the small number of patients no predictive factors for improvement of liver function tests after dietary counselling in our “real-life” cohort were identified. Our data are consistent with an earlier study demonstrating that both a low-carbohydrate and a lipid-reduced diet were equally efficient in reducing liver fat.[26] While our observational study focused on serum ALT dynamics as a surrogate parameter for hepatic necroinflammation, different dietary interventions should be evaluated using histological endpoints or a more advanced noninvasive disease severity assessment in the future.
Our pilot study has several limitations. First, the controls were not matched with regard to the anthropometrics to the NAFLD patients. However, as obesity is a generally accepted risk factor for cardiovascular diseases and malignancies, the achievement of a normal BMI should be the definite treatment goal in NAFLD patients. It may well be that the composition of the diet is a relevant distinguishing factor between liver-healthy overweight controls and overweight NAFLD patients. This question should be targeted in future studies. Another limitation to the study is that physical activity of the study population was only roughly assessed by patient self-reporting although it plays an important part in the history and treatment of NAFLD.[12–15] The third limitation is the fact that we did not assess histological data on necroinflammation or fibrosis in the majority of our NAFLD patients. Therefore, NAFLD was diagnosed by clinical, laboratory, and imaging criteria, but not by liver biopsy, which reflects the “real-life” nature of our study. Moreover, we did not want to limit our study to biopsy-proven NASH, as this would have implied a preselection of patients with more advanced liver disease who are referred to biopsy. In view of recent data suggesting that benign fatty liver progresses to fibrosing NASH,[27–29] we intended to analyze also patients with mild NALFD. Furthermore, we did not provide further detail regarding prediabetic insulin resistance of our study cohort, for example, homeostasis model assessment or insulin-sensitivity index. Finally, while the “real-life” setting of our pilot study warrants an unbiased nutritional assessment, the single-center design and limited number of patients require further confirmation of our data in a larger cohort.
In conclusion, patients with NAFLD have a significantly higher daily overall calorie intake while the general dietary composition displays only moderate deviations from healthy controls. Future prospective multicenter studies should evaluate whether dietary counselling could focus on a simple learning goal (“eat less”) for NAFLD patients rather than specific changes to relative nutrient consumption.
Supplementary Material
Acknowledgment
The authors thank Jason Stuka (Edmonton, Canada) for the language review of the manuscript.
Footnotes
Abbreviations: ALT = alanine transaminase, AST = aspartate transaminase, BIA = bioelectrical impedance analysis, BMI = body mass index, FFQ = food frequency questionnaire, γGT = gamma-glutamyl transpeptidase, HCC = hepatocellular carcinoma, NAFLD = nonalcoholic fatty liver disease, NASH = nonalcoholic steatohepatitis, ULN = upper limit of normal.
MHW wrote the original manuscript, contributed to the study design, and conducted the statistical analyses. B-CZ cowrote the original manuscript, contributed to the study design, and collected the data of the control group. BJ co-wrote the original manuscript, contributed to the study design, collected the data, conducted the dietary counselling, and evaluated the food frequency questionnaires. ER collected the data, conducted the dietary counselling, and critically revised the manuscript. EW contributed to the study-design, collected the data of the control group, and critically revised the manuscript. JSzW and AWL critically revised the manuscript. JK supervised the study, contributed to study design and cowrote and critically revised the manuscript.
MHW, B-CZ, and BJ contributed equally to this work.
JSzW, AWL, and JK are supported by the Deutsche Forschungsgemeinschaft (DFG), SFB 841.
The authors have no conflicts of interest to disclose.
Supplemental Digital Content is available for this article.
References
- 1.Marchesini G, Marzocchi R, Agostini F, et al. Nonalcoholic fatty liver disease and the metabolic syndrome. Curr Opin Lipidol 2005; 16:421–427. [DOI] [PubMed] [Google Scholar]
- 2.Chalasani N, Younossi Z, Lavine JE, et al. The diagnosis and management of non-alcoholic fatty liver disease: practice guideline by the American Association for the Study of Liver Diseases, American College of Gastroenterology, and the American Gastroenterological Association. Am J Gastroenterol 2012; 107:811–826. [DOI] [PubMed] [Google Scholar]
- 3.Masarone M, Federico A, Abenavoli L, et al. Non alcoholic fatty liver: epidemiology and natural history. Rev Recent Clin Trials 2014; 9:126–133. [DOI] [PubMed] [Google Scholar]
- 4.Vernon G, Baranova A, Younossi ZM. Systematic review: the epidemiology and natural history of non-alcoholic fatty liver disease and non-alcoholic steatohepatitis in adults. Aliment Pharmacol Ther 2011; 34:274–285. [DOI] [PubMed] [Google Scholar]
- 5.Marrero JA, Fontana RJ, Su GL, et al. NAFLD may be a common underlying liver disease in patients with hepatocellular carcinoma in the United States. Hepatology 2002; 36:1349–1354. [DOI] [PubMed] [Google Scholar]
- 6.Wong VW, Wong GL, Yeung JC, et al. Long-term clinical outcomes after fatty liver screening in patients undergoing coronary angiogram: a prospective cohort study. Hepatology 2016; 63:754–763. [DOI] [PubMed] [Google Scholar]
- 7.Vanni E, Marengo A, Mezzabotta L, et al. Systemic complications of nonalcoholic fatty liver disease: when the liver is not an innocent bystander. Semin Liver Dis 2015; 35:236–249. [DOI] [PubMed] [Google Scholar]
- 8.Cortzes-Pinto H, Jesus L, Barros H, et al. How different is the dietary pattern in non-alcoholic steatohepatitis patients? Clin Nutr 2006; 25:816–823. [DOI] [PubMed] [Google Scholar]
- 9.Volynets V, Küper MA, Strahl S, et al. Nutrition, intestinal permeability, and blood ethanol levels are altered in patients with nonalcoholic fatty liver disease (NAFLD). Dig Dis Sci 2012; 57:1932–1941. [DOI] [PubMed] [Google Scholar]
- 10.Ouyang X, Cirillo P, Sautin Y, et al. Fructose consumption as a risk factor for non-alcoholic fatty liver disease. J Hepatol 2008; 48:993–999. [DOI] [PMC free article] [PubMed] [Google Scholar]
- 11.Abdelmalek MF, Suzuki A, Guy C, et al. Increased fructose consumption is associated with fibrosis severity in patients with nonalcoholic fatty liver disease. Hepatology 2010; 51:1961–1971. [DOI] [PMC free article] [PubMed] [Google Scholar]
- 12.Promrat K, Kleiner DE, Niemeier HM, et al. Randomized controlled trial testing the effects of weight loss on nonalcoholic steatohepatitis. Hepatology 2010; 51:121–129. [DOI] [PMC free article] [PubMed] [Google Scholar]
- 13.Vilar-Gomez E, Martinez-Perez Y, Calzadilla-Bertot L, et al. Weight loss through lifestyle modification significantly reduces features of nonalcoholic steatohepatitis. Gastroenterology 2015; 149:367–378. [DOI] [PubMed] [Google Scholar]
- 14.Abenavoli L, Milic N, Peta V, et al. Alimentary regimen in non-alcoholic fatty liver disease: Mediterranean diet. World J Gastroenterol 2014; 20:16831–16840. [DOI] [PMC free article] [PubMed] [Google Scholar]
- 15.European Association for the Study of the Liver (EASL), European Association for the Study of Diabetes (EASD), European Association for the Study of Obesity (EASO). EASL-EASD-EASO clinical practice guidelines for the management of non-alcoholic fatty liver disease. J Hepatol 2016; 64:1388–1402. [DOI] [PubMed] [Google Scholar]
- 16.Zyriax BC, Lau K, Klähn T, et al. Association between alcohol consumption and carotid intima-media thickness in a healthy population: data of the STRATEGY study (Stress, Atherosclerosis and ECG study). Eur J Clin Nutr 2010; 64:1199–1206. [DOI] [PubMed] [Google Scholar]
- 17.Segal KR, Van Loan M, Fitzgerald PI, et al. Lean body mass estimation by bioelectrical impedance analysis: a four-site cross-validation study. Am J Clin Nutr 1988; 47:7–14. [DOI] [PubMed] [Google Scholar]
- 18.Sun SS, Chumlea WC, Heymsfield SB, et al. Development of bioelectrical impedance analysis prediction equations for body composition with the use of a multicomponent model for use in epidemiologic surveys. Am J Clin Nutr 2003; 77:331–340. [DOI] [PubMed] [Google Scholar]
- 19.Kleiner DE, Brunt EM, Van Natta M, et al. Design and validation of a histological scoring system for nonalcoholic fatty liver disease. Hepatology 2005; 41:1313–1321. [DOI] [PubMed] [Google Scholar]
- 20.Wong VWS, Vergniol J, Wong GLH, et al. Diagnosis of fibrosis and cirrhosis using liver stiffness measurements in nonalcoholic fatty liver disease. Hepatology 2010; 51:454–462. [DOI] [PubMed] [Google Scholar]
- 21.Johansson I, Hallmans G, Wikman A, et al. Validation and calibration of food-frequency questionnaire measurements in the Northern Swedish Health and Disease cohort. Public Health Nutr 2002; 5:487–496. [DOI] [PubMed] [Google Scholar]
- 22.U.S. Department of Health and Human Services, U.S. Department of Agriculture. Dietary guidelines for Americans 2015–2020, 8th ed. Available at: http://health.gov/dietaryguidelines/2015/guidelines/ Accessed April 22, 2016. [Google Scholar]
- 23.Lankarani KB, Alavian SM. Low carbohydrate rather than low fat is more important in dietary management of nonalcoholic steatohepatitis. Gastroenterology 2015; 149:1987–1988. [DOI] [PubMed] [Google Scholar]
- 24.Pericleous M, Mandair D, Caplin ME. Diet and supplements and their impact on colorectal cancer. J Gastrointest Oncol 2013; 4:409–423. [DOI] [PMC free article] [PubMed] [Google Scholar]
- 25.Lin XF, Shi KQ, You J, et al. Increased risk of colorectal malignant neoplasm in patients with nonalcoholic fatty liver disease: a large study. Mol Biol Rep 2014; 41:2989–2997. [DOI] [PubMed] [Google Scholar]
- 26.Haufe S, Engeli S, Kast P, et al. Randomized comparison of reduced fat and reduced carbohydrate hypocaloric diets on intrahepatic fat in overweight and obese human subjects. Hepatology 2011; 53:1504–1514. [DOI] [PubMed] [Google Scholar]
- 27.Wong VW, Wong GL, Choi PC, et al. Disease progression of non-alcoholic fatty liver disease: a prospective study with paired liver biopsies at 3 years. Gut 2010; 59:969–974. [DOI] [PubMed] [Google Scholar]
- 28.Pais R, Charlotte F, Fedchuk L, et al. A systematic review of follow-up biopsies reveals disease progression in patients with non-alcoholic fatty liver. J Hepatol 2013; 59:550–556. [DOI] [PubMed] [Google Scholar]
- 29.Singh S, Allen AM, Wang Z, et al. Fibrosis progression on nonalcoholic fatty liver vs nonalcoholic steatohepatitis: a systematic review and meta-analysis of paired biopsy studies. Clin Gastroenterol Hepatol 2015; 13:643–654. [DOI] [PMC free article] [PubMed] [Google Scholar]
Associated Data
This section collects any data citations, data availability statements, or supplementary materials included in this article.