

Abstract
Phosphoglycerate dehydrogenase (PHGDH) plays an essential role in cancer-specific metabolic reprogramming. It has been reported as a putative metabolic oncogene in several types of human malignant tumors, such as breast cancer and melanoma. To date, PHGDH expression in colorectal cancer (CRC) as well as its association with clinicopathological characteristics and prognostic implication remain undetermined. In this study, we determined the PHGDH protein expression using tissue microarray immunohistochemistry (TMA-IHC) on 193 pairs of formalin-fixed, paraffin-embedded specimens of CRC and adjacent tissues, 25 chronic colitis, 41 low-, and 19 high-grade intraepithelial neoplasia specimens, and we also determined PHGDH mRNA level using quantitative reverse transcription PCR (qRT-PCR) on additional 23 pairs of fresh CRC tissues and adjacent tissues. We found that both PHGDH mRNA and protein was highly expressed in tumor tissues in comparison with matched adjacent non-tumor tissues, and high PHGDH protein expression was correlated with advanced TNM stage (P = .038) and larger tumor (P = .001). Multivariate Cox regression analysis showed that PHGDH protein expression (HR = 2.285, 95% CI = 1.18 to 4.41, P = .014), tumor differentiation (HR = .307, 95% CI = .154 to 0.609, P = .001), and TNM stage (HR = 1.791, 95% CI = 1.125 to 2.85, P = .014) were independent prognostic factors in CRC. Kaplan-Meier survival curves and log rank test showed that high PHGDH protein expression contributed to poor outcome in CRC patients (P < .001). In conclusion, these results suggest that assessment of PHGDH expression could be useful in identifying a high-risk subgroup of CRC.
Introduction
Colorectal cancer (CRC) is the third most frequently diagnosed cancer (1.4 million cases) with 694,000 deaths each year worldwide according to GLOBOCAN 2012 [1], [2]. Compared to Western Countries, China does not have the highest CRC incidence rate. However, the incidence and mortality of CRC have sharply increased in China over the past two decades [3]. It was estimated that there were 274,841 new CRC cases with 132,110 deaths in China in 2010 [3]. Despite considerable advances in the treatments of CRC in recent years, the outcome of CRC remains unfavorable. Given that the high incidence and mortality of CRC, it is imperative to explore new molecular markers to improve the prognosis and clinical management of CRC.
Tumor cells are characterized by the uncontrolled growth, which requires numerous nutrients to build cellular components including amino acids, lipids, and nucleic acids [4], [5], [6], [7], [8]. It is hypothesized that tumor cell reprograms the metabolic system to fulfill its demanding specific biosynthetic requirements. One of known metabolic adaptations of oncogenesis is that malignant cells have a tendency to consume great amounts of glucose via fermentative metabolism in order to produce plenty of serine and glycine, which normally are converted to pyruvate, alanine, and lactates. Serine and glycine are known as indispensible precursors for the production of other amino acids, lipids, as well as nucleic acids. During this tumor specific metabolic reprogramming, phosphoglycerate dehydrogenase (PHGDH) plays a critical role by diverting the glycolytic metabolite, 3-phosphogycerate, into the serine biosynthetic pathway. Accumulating studies have shown that some glycolytic enzyme, including PHGDH, is commonly overexpressed in malignant cells [9], [10], [11], such as breast cancer, melanoma, nasopharyngeal carcinoma, cervical adenocarcinom as well as neuroglioma [5], [12], [13], [14], [15], [16].
Two PHGDH transcripts have been found in human colon adenocarcinoma [17], however the expression and prognostic implication of PHGDH have not been fully elucidated in CRC. In the current study, we evaluated both mRNA and protein expression of PHGDH by qRT-PCR and TMA-IHC respectively on CRC tissue samples. The association between PHGDH expression and the clinical parameters and the prognosis of CRC patients were also evaluated.
Materials and methods
Clinical specimen collection
A cohort of 193 patients with colorectal carcinoma was recruited from the Affiliated Hospital of Nantong University between January 2005 and December 2010. They were aged between 17 and 90 years, and mean age was 65.2 years. All cases were newly diagnosed and histopathologically confirmed through central pathology review by light microscopy evaluation of diagnostic slides containing representative formalin-fixed or frozen tissues. In addition, 25 chronic colitis, 41 low-, and 19 high-grade intraepithelial neoplasia specimens were collected as intestinal endoscopic biopsy. None of the patients have been treated with chemotherapy or radiation therapy before receiving surgical operation. Both tumor and matched peritumoral tissue specimens were collected for the study. Medical records were searched to collect the following data: age, gender, tumor site, histological type, tumor differentiation, preoperative carcinoembryonic antigen (CEA) level, TNM stage as well as tumor size (T), lymph node metastasis (N), and distant metastasis (M). The study was approved by the Ethics Committee of the Affiliated Hospital of Nantong University.
Quantitative reverse transcription polymerase chain reaction
To determine PHGDH mRNA level in CRC tissues, fresh CRC cancer tissue and the matched tumor-adjacent normal tissue samples were obtained from an independent 23 CRC patients. Total RNA was isolated using TRIZOL (Invitrogen, CA, USA) and the cDNA was generated using SuperScript® III Reverse Transcriptase (Invitrogen, CA, USA). The qRT-PCR analysis was performed using Power SYBR® Green PCR Master Mix (Invitrogen, CA, USA) according to manufacturer instructions. The following primer pair was used to amplify PHGDH (NM_006623): forward primer 5′-CACATTCTTGGGCTGAAC-3′ and reverse primer 5′-TTATTAGACGGTTATTGCTGTA-3′. Glyceraldehyde 3-phosphate dehydrogenase (GAPDH) was employed as an internal control, while calculating the relative mRNA expression level of PHGDH in the analyzed tissues (forward primer 5′-TGCACCACCAACTGCTTAGC-3′ and reverse primer 3′-GGCATGGACTGTGGTCATGAG-5′). All tests were run in triplicate under standard condition of qPCR [18].
Tissue microarrays and immunohistochemistry
The tissue microarrays (TMAs) were built using a tissue array instrument (Quick-Ray, UT06; UNITMA, Korea). Briefly, tissue cores (2 mm in diameter) were punched from representative formalin-fixed paraffin-embedded tissue and put in order in the TMA blocks. Immunohistochemistry were performed to detect PHGDH protein expression using protocols published elsewhere [19] with a primary PHGDH antibody (ab117719, Abcam Inc. Cambridge, MA) and a biotinylated antimouse secondary antibody (Zhongshan Golden Bridge Biotechnology Co., Ltd., Beijing, China).
Evaluation of immunohistochemistry reaction intensity
To score the PHGDH immunostaining, the intensity of IHC reaction on a TMAs was classified into 4 categories: 0, 1 +, 2 +, and 3 +, which corresponded to no staining, weak staining, moderate staining and strong staining, respectively. The product of staining intensity score and the percentage of positive tumor cells (0% to 100%) was considered as the final score of PHGDH expression, which ranged from 0 (no staining) to 300 (100% of cells with 3 + staining intensity). Then, a cutoff value with respect of overall survival (OS) was generated using the X-tile software program (http://www.tissuearray.org/rimmlab) [20] to further separate all samples into “low or negative” PHGDH expression (PHGDHlow) and “high or positive” protein expression (PHGDHhigh).
Statistical analysis
A student t-test was used for analysis of the distinction between PHGDH mRNA expression in CRC and adjacent noncancerous tissues. The association between PHGDH protein and clinicopathological characteristics was tested using χ2 tests. Survival curves were plotted using the Kaplan-Meier method and compared using the log-rank test. Univariate and multivariate analysis were performed using Cox proportional hazards model. The hazard ratio (HR) and 95% confidence interval (CI) were determined for each variable. The SPSS 21.0 software was used for statistical analysis (SPSS Inc., Chicago, IL, USA). All P values were two-sided and a value of P < .05 was considered statistically significant.
Results
The expression of PHGDH in CRC and paired nonmalignant tissues
Immunohistochemistry showed that positive staining of PHGDH protein was mainly localized in the cytoplasm of cells (Figure 1). High expression of PHGDH was observed in a significantly larger percentage of benign tissues (high grade intraepithelial neoplasia) versus chronic disease tissues (chronic colitis) (P = .005). Consistently, tumor tissues were significantly more likely to show high PHGDH expression than adjacent normal tissues (surgical margin) (P < .001): high PHGDH expression was detected in 118 of the 193 CRC tissues (76.1%) and in 38 of the 183 matched tumor-adjacent normal tissues (20.8%) (Table 1).
Figure 1.
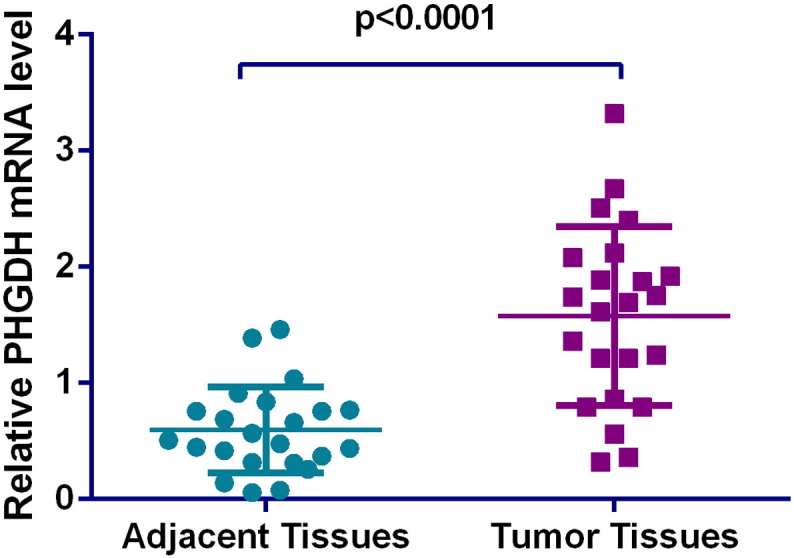
Differential level of PHGDH mRNA in colorectal cancer (CRC) and adjacent normal tissues. Relative expression of PHGDH mRNA was normalized to the internal reference gene GAPDH. Preferential expression of PHGDH was observed in CRC tissues over matched tumor-adjacent normal tissues (P < .0001).
Table 1.
PHGDH expression in cancerous tissues and other tissues.
| Characteristic | Number | PHGDHlow | PHGDHhigh | Pearson χ2 | P value |
|---|---|---|---|---|---|
| Chronic colitis | 25 | 20(80.0) | 5(20.0) | ||
| Low grade intraepithelial neoplasia | 41 | 25(61.0) | 16(39.0) | ||
| High grade intraepithelial neoplasia | 19 | 6(31.6) | 13(68.4) | 10.578 | 0.005⁎ |
| Cancer | 193 | 75((38.9) | 118(61.1) | ||
| Surgical margin | 183 | 145(79.2) | 38(20.8) | ||
| Total | 461 | 271(58.8) | 190(41.2) | 73.742 | < 0.001⁎ |
P < .05.
Moreover, we also performed a comparison of PHGDH mRNA in a cohort of 23 pairs of tumor tissues and their adjacent normal tissues. The relative expression level of PHGDH was normalized to the expression of endogenous gene GAPDH. Similar to the protein expression pattern, PHGDH mRNA level was significantly elevated in CRC (Figure 2) tissues compared to normal tissues (P < .0001).
Figure 2.

Representative TMA-IHC staining of PHGDH. (A1, A2) colorectal adenocarcinoma, with strong PHGDH staining in cytoplasm of cells; (B1, B2) high-grade intraepithelial neoplasia with positive staining; (C1, C2) low-grade intraepithelial neoplasia with weak positive staining; (D1, D2) normal intestinal mucosa. Original magnification × 40 (bar = 500 μm) in A1, B1, C1, and D1; × 400 (bar = 50 μm) in A2, B2, C2, and D2. Red and green arrows point to positive and negative PHGDH staining, respectively.
Correlation of PHGDH expression with clinicopathological characteristics of CRC patients
To evaluate clinicopathological implication of PHGDH expression, we correlated PHGDH expression with following variables: tumor site, histological type, tumor differentiation, CEA level, TNM stage. High PHGDH expression was associated with CRC stage (stage III+IV, P = .038) and tumor size (P = .001) (Table 2).
Table 2.
Relationship between the expression of PHGDH and clinicopathological characteristics in colorectal cancer.
| Characteristic | n | PHGDHlow | PHGDHhigh | Pearson χ2 | P |
|---|---|---|---|---|---|
| Total | 193 | 75(38.9) | 118(61.1) | ||
| Gender | 0.003 | 0.954 | |||
| Male | 124 | 48(38.7) | 76(61.3) | ||
| Female | 69 | 27(39.1) | 42(60.9) | ||
| Age | 1.228 | 0.268 | |||
| < 60 | 63 | 28 (44.4) | 35(55.6) | ||
| ≥ 60 | 130 | 47(36.2) | 83(63.8) | ||
| Location | 0.070 | 0.792 | |||
| Colon | 141 | 54(38.3) | 87(61.7) | ||
| Rectum | 52 | 21(40.4) | 31(59,6) | ||
| Histological type | 0.642 | 0.423 | |||
| Tubular and Papillary | 174 | 66(37.9) | 108(62.1) | ||
| Othera | 19 | 9(47.4) | 10(52.6) | ||
| Differentiation | 2.230 | 0.135 | |||
| Poor | 18 | 4(22.2) | 14(77.8) | ||
| Well and middle | 169 | 68 (40.2) | 101(59.8) | ||
| Otherb | 6 | 3 | 3 | ||
| TNM stage | 6.529 | 0.038⁎ | |||
| 0-I | 35 | 20(57.1) | 21(42.9) | ||
| II | 81 | 26(32.1) | 49(67.9) | ||
| III + IV | 77 | 29(37.7) | 48(62.3) | ||
| T | 10.717 | 0.001⁎ | |||
| Tis + T1 + T2 | 41 | 25(61.0) | 16(39.0) | ||
| T3, 4b | 152 | 50(32.9) | 102(67.1) | ||
| N | 0.128 | 0.938⁎ | |||
| N0 | 118 | 47(39.8) | 71(60.2) | ||
| N1a | 38 | 14(36.8) | 24(63.2) | ||
| N1b,1c,2a,b | 37 | 14(37.8) | 23(62.2) | ||
| Preoperative CEA, ng/ml | 2.696 | 0.101 | |||
| ≤ 15 | 116 | 50(43.1) | 66(59.6) | ||
| > 15 | 27 | 7(25.9) | 20(74.1) | ||
| Unknown | 50 | 18 | 32 |
Others: Mixed (Tubular and mucinous or signet) adenocarcinoma, 10 cases; Mucinous carcinoma, 6 cases; signet ring cell carcinoma, 1 case; Adeno-squamouscarcinoma, 1 case. Squamouscarcinoma, 1 case.
Others: Mucinous carcinoma, 4 cases; Signet ring cell carcinoma, 1 case. squamouscarcinoma, 1 case.
P < .05.
Clinical outcome
Table 3 shows the results of the univariable and multivariable models for 5-year overall survival (OS).
Table 3.
Univariate and multivariable analysis of prognostic factors for 5-year survival in colorectal cancer.
| Univariate analysis |
Multivariate analysis |
|||||||
|---|---|---|---|---|---|---|---|---|
| HR | P >|z| | 95% CI | HR | P >|z| | 95% CI | |||
| PHGDH expression High versus low and none |
2.843 | < .001⁎ | 1.603 | 5.041 | 2.285 | 0.014⁎ | 1.181 | 4.419 |
| Age (years) ≤ 60 versus > 60 |
1.036 | .891 | 0.624 | 1.719 | ||||
| Gender Male versus Female |
1.308 | .305 | 0.783 | 2.184 | ||||
| Location Colon versus Rectum |
1.291 | .323 | 0.778 | 2.142 | ||||
| Histological type Tubular and Papillary versus Othersa |
0.855 | .715 | 0.370 | 1.977 | ||||
| Differentiation Poor versus Well and Middle |
0.201 | < .001⁎ | 0.112 | 0.360 | 0.307 | 0.001⁎ | 0.154 | 0.609 |
| TNM stage 0 and I versus II versus III and IV |
2.493 | < .001⁎ | 1.091 | 3.366 | 1.791 | 0.014⁎ | 1.125 | 2.851 |
| T Tis and T1 and T2 versus T3 and 4b |
24.144 | .002⁎ | 3.351 | 173.946 | ||||
| N N0 versus N1a versus N1b and N2a and 2b |
1.685 | < .001⁎ | 1.283 | 2.212 | ||||
| Preoperative CEA, ng/ml ≤ 15 versus > 15 | 2.354 | .004⁎ | 1.311 | 4.228 | ||||
P < .05.
Others: Mixed (Tubular and mucinous or signet) adenocarcinoma, 10 cases; Mucinous carcinoma, 6 cases; Signet ring cell carcinoma, 1 case; Adeno-squamouscarcinoma, 1 case. Squamouscarcinoma, 1 case.
Among the analyzed clinicopathological variables, differentiation (HR = 0.307, 95% CI = 0.154 to 0.609, P = .001) and TMN (HR = 1.791, 95% CI = 1.125 to 2.85, P = .014) were associated with poor 5-year OS. Poor differentiation and advanced TNM stage (III+IV) were independent predictors for unfavorable prognosis in CRC. More importantly, multivariate analysis indicated a survival disadvantage of CRC with high levels of PHGDH at a HR of 2.285 (95% CI = 1.18 to 4.41, P = .014) for 5-year OS, providing evidence of the prognostic value of PHGDH in CRC.
Accumulative survivals for all patients were visualized by the Kaplan-Meier survival curves. Survival of patients with high PHGDH levels was worse than that of patients with low PHGDH levels during the 5-year follow-up period. The estimated 5-year OS rate was 52% and 80% respectively (Figure 3, A). Statistical analysis demonstrated that high PHGDH levels were associated with a significantly worsen 5-year OS (log-rank test: P < .001; Figure 3, A). In other words, in 193 patients with CRC, dichotomized PHGDH level by the cut off value of 120 was a significant prognostic factor of overall survival (P = .0002).
Figure 3.

Kaplan-Meier survival curves of CRC patients. (A) Overall survival time in patients with tumor expressing high PHGDH levels (green) was significantly shorter than those with tumor expressing low PHGDH levels (blue). (B) Patients with well and moderately differentiated tumors (green) tended to survival longer than those with poorly differentiated tumors (blue). (C) Advanced TNM stages (brown, II; green, III+IV) were significantly associated with worse overall survival.
Discussion
Metabolic reprogramming has been recognized as a fundamental event in tumorigenesis [4], [6], [21], [22]. Cancer cell proliferation is not limited by ATP production but rather by the ability of cells to generate lipids, nucleic acids, and proteins needed to support the rapid growth of biomass. Cancer cells prefer aerobic glycolysis which allows them to adapt metabolism to satisfy an increased biosynthetic need [4], [9], [23], [24]. Despite the numerous evidence of the fundamental role of metabolic reprogramming in carcinogenesis, such metabolic alternation has not been confirmed in human CRC. Since PHGDH has been well known to initiate de novo serine synthetic pathway, it may act as a surrogate marker of serine biosynthetic activity in CRC. With this in mind, we compared PHGDH expression in CRC and matched adjacent normal tissues and explored its clinicopathological correlation and prognostic value. RNA and protein levels of the PHGDH were shown to be elevated in tumors in this study. CRC patients with tumors of high PHGDH expression levels tended to have stage III/IV CRC and larger tumors. Moreover, we demonstrated that high PHGDH level was significantly associated with inferior survival in CRC, and PHGDH expression has prognostic value in CRC.
Several studies have linked PHGDH expression levels with the activity of serine biosynthesis. PHGDH activity was found to be proportionally correlated with the overall capacity of serine biosynthesis in rat tissues [25]. Serine synthesis-associated enzyme assay provided evidence of remarkable increases in the activities of PHGDG and serine hydroxymethyltransferase in human carcinomas and transplantable rat sarcomas, suggesting increased capacity of serine synthesis in cancer [26]. A more recent study using isotope labeling and kinetic profiling analysis demonstrated that high PHGDH expression can push metabolic flux into the serine pathway; while RNA interference-mediated knockdown of PHGDH can keep glycolytic intermediates from entering serine metabolism pathway in human PHGDH-amplified cancer cell lines [5].
PHGDH has been identified as a frequently amplified gene in a high-resolution analysis of somatic copy-number alterations on 3131 cancer samples of 26 histological types [5], [27], recurring copy number gains of PHGDH have been seen in 40% of melanomas and 16% of all cancers [5], [27]. In melanoma, recurrent PHGDH gene copy number gain was associated with increase in protein levels [5]. Similarly, PHGDH gene was amplified in 70% of estrogen receptor (ER)-negative breast cancers [12]. Mechanistic studies indicated that overexpression of PHGDH in mammary epithelial cells (MCF-10a) can drive cells toward malignant transformation by interrupting acinar morphogenesis and the formation of polarity, and maintaining anchorage-independent growth [5]. Stable PHGDH knockdown using shRNA significantly reduces proliferation rate in an esophageal squamous cell carcinoma cell line and a melanoma cell line, which have naturally acquired a high copy number gain of PHGDH [5]. Further, the study showed that the inhibited proliferation was a result of impaired serine biosynthesis [5]. High PHGDH expression generally results in increased glycolytic metabolite flux into serine pathway, vice versa [5].
In addition to catalyzing de novo serine synthesis, PHGDH may also promote carcinogenesis by producing d-2-hydroxyglutarate (d-2HG) [28], an oncometabolite [29], [30], [31], [32]. PHGDH knockdown was shown to reduce cellular 2HG by approximately 50% in several PHGDH-amplified breast cancer cell lines, and PHGDH overexpression enhanced cellular 2HG over 2-fold in several non-PHGDH-amplified breast cancer cells [28]. Recently, Fan et al. reported that PHGDH could also convert α-ketoglutarate to the d-2HG through NADH-dependent reduction [28].
Apart from its role in carcinogenesis, PHGDH has also been implicated in cancer prognosis. Among breast cancer MDA-MB-231 cell line variants, the bone metastatic propensity is associated with upregulation of three serine biosynthesis pathway-associated genes, PHGDH, phosphoserine aminotransferase 1 (PSAT1), and phosphoserine phosphatase [13]; elevated expression of PHGDH and PSAT1 in primary breast cancer was significantly associated with poor prognosis [13]. The prognostic implications of serine metabolism-associated enzymes have been studied in a bioinformatic analysis involving 17 breast and 7 lung cancer publically available datasets [33]. PHGDH was identified as a predictor for unfavorable prognosis in breast cancer but not in lung cancer, suggesting potential tissue-specific roles for PHGDH. With 54 human cervical adenocarcinoma samples, Jing et al. observed significantly higher PHGDH expression in tumors than in normal cervical glandular epithelium, and high PHGDH expression conferred significant survival disadvantage in cervical adenocarcinoma [16]. Recently, Yoon et al. examined the serine metabolism-associated enzymes in a cohort of Korean patients with colon cancer [10]. They found that the expression levels of pyruvate dehydrogenase kinase (PDK) 1, phosphoserine aminotransferase and PHGDH were significantly elevated in colonic tumor tissues, when compared to those in paired normal tissues. However, the prognostic significance of these enzymes for survival was not demonstrated statistically although univariate analysis indicated that PDK1 was significantly associated with overall survival [10]. This may be associated with the sources of primary antibody, patient cohort as well as cutoff setting for IHC score.
Conclusions
In conclusion, we found that PHGDH was overexpressed in CRC tissues and the high expression of PHGDH protein was correlated with TNM stage and tumor size, and also was an independent predictor for unfavorable prognosis in CRC.
Acknowledgment
This work is supported by the National Natural Science Foundation of China (No. 81273214 to XQ.J.).
Contributor Information
Xu-dong Wang, Email: Wangxudong88@hotmail.com.
Jian-feng Qiang, Email: qjf@ntu.edu.cn.
References
- 1.Ferlay J., Soerjomataram I., Dikshit R., Eser S., Mathers C., Rebelo M., Parkin D.M., Forman D., Bray F. Cancer incidence and mortality worldwide: sources, methods and major patterns in GLOBOCAN 2012. Int J Cancer. 2015;136:E359–E386. doi: 10.1002/ijc.29210. [DOI] [PubMed] [Google Scholar]
- 2.Torre L.A., Bray F., Siegel R.L., Ferlay J., Lortet-Tieulent J., Jemal A. Global cancer statistics, 2012. CA Cancer J Clin. 2015 doi: 10.3322/caac.21262. [DOI] [PubMed] [Google Scholar]
- 3.Zheng Z.X., Zheng R.S., Zhang S.W., Chen W.Q. Colorectal cancer incidence and mortality in China, 2010. Asian Pac J Cancer Prev. 2014;15:8455–8460. doi: 10.7314/apjcp.2014.15.19.8455. [DOI] [PubMed] [Google Scholar]
- 4.DeBerardinis R.J., Lum J.J., Hatzivassiliou G., Thompson C.B. The biology of cancer: metabolic reprogramming fuels cell growth and proliferation. Cell Metab. 2008;7:11–20. doi: 10.1016/j.cmet.2007.10.002. [DOI] [PubMed] [Google Scholar]
- 5.Locasale J.W., Grassian A.R., Melman T., Lyssiotis C.A., Mattaini K.R., Bass A.J., Heffron G., Metallo C.M., Muranen T., Sharfi H. Phosphoglycerate dehydrogenase diverts glycolytic flux and contributes to oncogenesis. Nat Genet. 2011;43:869–874. doi: 10.1038/ng.890. [DOI] [PMC free article] [PubMed] [Google Scholar]
- 6.Vander Heiden M.G., Cantley L.C., Thompson C.B. Understanding the Warburg effect: the metabolic requirements of cell proliferation. Science. 2009;324:1029–1033. doi: 10.1126/science.1160809. [DOI] [PMC free article] [PubMed] [Google Scholar]
- 7.Ward P.S., Thompson C.B. Metabolic reprogramming: a cancer hallmark even warburg did not anticipate. Cancer Cell. 2012;21:297–308. doi: 10.1016/j.ccr.2012.02.014. [DOI] [PMC free article] [PubMed] [Google Scholar]
- 8.Cairns R.A., Harris I.S., Mak T.W. Regulation of cancer cell metabolism. Nat Rev Cancer. 2011;11:85–95. doi: 10.1038/nrc2981. [DOI] [PubMed] [Google Scholar]
- 9.Mullarky E., Mattaini K.R., Vander Heiden M.G., Cantley L.C., Locasale J.W. PHGDH amplification and altered glucose metabolism in human melanoma. Pigment Cell Melanoma Res. 2011;24:1112–1115. doi: 10.1111/j.1755-148X.2011.00919.x. [DOI] [PubMed] [Google Scholar]
- 10.Yoon S., Kim J.G., Seo A.N., Park S.Y., Kim H.J., Park J.S., Choi G.S., Jeong J.Y., Jun D.Y., Yoon G.S. Clinical Implication of Serine Metabolism-Associated Enzymes in Colon Cancer. Oncology. 2015 doi: 10.1159/000439571. [DOI] [PubMed] [Google Scholar]
- 11.Yen K.E., Bittinger M.A., Su S.M., Fantin V.R. Cancer-associated IDH mutations: biomarker and therapeutic opportunities. Oncogene. 2010;29:6409–6417. doi: 10.1038/onc.2010.444. [DOI] [PubMed] [Google Scholar]
- 12.Possemato R., Marks K.M., Shaul Y.D., Pacold M.E., Kim D., Birsoy K., Sethumadhavan S., Woo H.K., Jang H.G., Jha A.K. Functional genomics reveal that the serine synthesis pathway is essential in breast cancer. Nature. 2011;476:346–350. doi: 10.1038/nature10350. [DOI] [PMC free article] [PubMed] [Google Scholar]
- 13.Pollari S., Kakonen S.M., Edgren H., Wolf M., Kohonen P., Sara H., Guise T., Nees M., Kallioniemi O. Enhanced serine production by bone metastatic breast cancer cells stimulates osteoclastogenesis. Breast Cancer Res Treat. 2011;125:421–430. doi: 10.1007/s10549-010-0848-5. [DOI] [PubMed] [Google Scholar]
- 14.Liu J., Guo S., Li Q., Yang L., Xia Z., Zhang L., Huang Z., Zhang N. Phosphoglycerate dehydrogenase induces glioma cells proliferation and invasion by stabilizing forkhead box M1. J Neuro-Oncol. 2013;111:245–255. doi: 10.1007/s11060-012-1018-x. [DOI] [PMC free article] [PubMed] [Google Scholar]
- 15.Ye Y., Zhou Y., Zhang L., Chen Y., Lyu X., Cai L., Lu Y., Deng Y., Wang J., Yao K. EBV-miR-BART1 is involved in regulating metabolism-associated genes in nasopharyngeal carcinoma. Biochem Biophys Res Commun. 2013;436:19–24. doi: 10.1016/j.bbrc.2013.05.008. [DOI] [PubMed] [Google Scholar]
- 16.Jing Z., Heng W., Xia L., Ning W., Yafei Q., Yao Z., Shulan Z. Downregulation of phosphoglycerate dehydrogenase inhibits proliferation and enhances cisplatin sensitivity in cervical adenocarcinoma cells by regulating Bcl-2 and caspase-3. Cancer Biol Ther. 2015;16:541–548. doi: 10.1080/15384047.2015.1017690. [DOI] [PMC free article] [PubMed] [Google Scholar]
- 17.Cho H.M., Jun D.Y., Bae M.A., Ahn J.D., Kim Y.H. Nucleotide sequence and differential expression of the human 3-phosphoglycerate dehydrogenase gene. Gene. 2000;245:193–201. doi: 10.1016/s0378-1119(00)00009-3. [DOI] [PubMed] [Google Scholar]
- 18.Xing Z., Lin A., Li C., Liang K., Wang S., Liu Y., Park P.K., Qin L., Wei Y., Hawke D.H. lncRNA directs cooperative epigenetic regulation downstream of chemokine signals. Cell. 2014;159:1110–1125. doi: 10.1016/j.cell.2014.10.013. [DOI] [PMC free article] [PubMed] [Google Scholar]
- 19.Huang J., Fan X., Wang X., Lu Y., Zhu H., Wang W., Zhang S., Wang Z. High ROR2 expression in tumor cells and stroma is correlated with poor prognosis in pancreatic ductal adenocarcinoma. Sci Report. 2015;5:12991. doi: 10.1038/srep12991. [DOI] [PMC free article] [PubMed] [Google Scholar]
- 20.Sun R., Wang X., Zhu H., Mei H., Wang W., Zhang S., Huang J. Prognostic value of LAMP3 and TP53 overexpression in benign and malignant gastrointestinal tissues. Oncotarget. 2014;5:12398–12409. doi: 10.18632/oncotarget.2643. [DOI] [PMC free article] [PubMed] [Google Scholar]
- 21.Locasale J.W., Cantley L.C. Altered metabolism in cancer. BMC Biol. 2010;8:88. doi: 10.1186/1741-7007-8-88. [DOI] [PMC free article] [PubMed] [Google Scholar]
- 22.Center M.M., Jemal A., Smith R.A., Ward E. Worldwide variations in colorectal cancer. CA Cancer J Clin. 2009;59:366–378. doi: 10.3322/caac.20038. [DOI] [PubMed] [Google Scholar]
- 23.DeBerardinis R.J. Serine metabolism: some tumors take the road less traveled. Cell Metab. 2011;14:285–286. doi: 10.1016/j.cmet.2011.08.004. [DOI] [PMC free article] [PubMed] [Google Scholar]
- 24.Vander Heiden M.G., Locasale J.W., Swanson K.D., Sharfi H., Heffron G.J., Amador-Noguez D., Christofk H.R., Wagner G., Rabinowitz J.D., Asara J.M. Evidence for an alternative glycolytic pathway in rapidly proliferating cells. Science. 2010;329:1492–1499. doi: 10.1126/science.1188015. [DOI] [PMC free article] [PubMed] [Google Scholar]
- 25.Davis J.L., Fallon H.J., Morris H.P. Two enzymes of serine metabolism in rat liver and hepatomas. Cancer Res. 1970;30:2917–2920. [PubMed] [Google Scholar]
- 26.Snell K., Natsumeda Y., Eble J.N., Glover J.L., Weber G. Enzymic imbalance in serine metabolism in human colon carcinoma and rat sarcoma. Br J Cancer. 1988;57:87–90. doi: 10.1038/bjc.1988.15. [DOI] [PMC free article] [PubMed] [Google Scholar]
- 27.Beroukhim R., Mermel C.H., Porter D., Wei G., Raychaudhuri S., Donovan J., Barretina J., Boehm J.S., Dobson J., Urashima M. The landscape of somatic copy-number alteration across human cancers. Nature. 2010;463:899–905. doi: 10.1038/nature08822. [DOI] [PMC free article] [PubMed] [Google Scholar]
- 28.Fan J., Teng X., Liu L., Mattaini K.R., Looper R.E., Vander Heiden M.G., Rabinowitz J.D. Human phosphoglycerate dehydrogenase produces the oncometabolite D-2-hydroxyglutarate. ACS Chem Biol. 2015;10:510–516. doi: 10.1021/cb500683c. [DOI] [PMC free article] [PubMed] [Google Scholar]
- 29.Dang L., White D.W., Gross S., Bennett B.D., Bittinger M.A., Driggers E.M., Fantin V.R., Jang H.G., Jin S., Keenan M.C. Cancer-associated IDH1 mutations produce 2-hydroxyglutarate. Nature. 2009;462:739–744. doi: 10.1038/nature08617. [DOI] [PMC free article] [PubMed] [Google Scholar]
- 30.Ma S., Jiang B., Deng W., Gu Z.K., Wu F.Z., Li T., Xia Y., Yang H., Ye D., Xiong Y. D-2-hydroxyglutarate is essential for maintaining oncogenic property of mutant IDH-containing cancer cells but dispensable for cell growth. Oncotarget. 2015;6:8606–8620. doi: 10.18632/oncotarget.3330. [DOI] [PMC free article] [PubMed] [Google Scholar]
- 31.Ward P.S., Patel J., Wise D.R., Abdel-Wahab O., Bennett B.D., Coller H.A., Cross J.R., Fantin V.R., Hedvat C.V., Perl A.E. The common feature of leukemia-associated IDH1 and IDH2 mutations is a neomorphic enzyme activity converting alpha-ketoglutarate to 2-hydroxyglutarate. Cancer Cell. 2010;17:225–234. doi: 10.1016/j.ccr.2010.01.020. [DOI] [PMC free article] [PubMed] [Google Scholar]
- 32.Koivunen P., Lee S., Duncan C.G., Lopez G., Lu G., Ramkissoon S., Losman J.A., Joensuu P., Bergmann U., Gross S. Transformation by the (R)-enantiomer of 2-hydroxyglutarate linked to EGLN activatiwon. Nature. 2012;483:484–488. doi: 10.1038/nature10898. [DOI] [PMC free article] [PubMed] [Google Scholar]
- 33.Antonov A., Agostini M., Morello M., Minieri M., Melino G., Amelio I. Bioinformatics analysis of the serine and glycine pathway in cancer cells. Oncotarget. 2014;5:11004–11013. doi: 10.18632/oncotarget.2668. [DOI] [PMC free article] [PubMed] [Google Scholar]