

Abstract
Key points
Muscle fatigue can be defined as the transient decrease in maximal force that occurs in response to muscle use. Fatigue develops because of a complex set of changes within the neuromuscular system that are difficult to evaluate simultaneously in humans.
The skeletal muscle of older adults fatigues less than that of young adults during static contractions. The potential sources of this difference are multiple and intertwined.
To evaluate the individual mechanisms of fatigue, we developed an integrative computational model based on neural, biochemical, morphological and physiological properties of human skeletal muscle.
Our results indicate first that the model provides accurate predictions of fatigue and second that the age‐related resistance to fatigue is due largely to a lower reliance on glycolytic metabolism during contraction.
This model should prove useful for generating hypotheses for future experimental studies into the mechanisms of muscle fatigue.
Abstract
During repeated or sustained muscle activation, force‐generating capacity becomes limited in a process referred to as fatigue. Multiple factors, including motor unit activation patterns, muscle fibre contractile properties and bioenergetic function, can impact force‐generating capacity and thus the potential to resist fatigue. Given that neuromuscular fatigue depends on interrelated factors, quantifying their independent effects on force‐generating capacity is not possible in vivo. Computational models can provide insight into complex systems in which multiple inputs determine discrete outputs. However, few computational models to date have investigated neuromuscular fatigue by incorporating the multiple levels of neuromuscular function known to impact human in vivo function. To address this limitation, we present a computational model that predicts neural activation, biomechanical forces, intracellular metabolic perturbations and, ultimately, fatigue during repeated isometric contractions. This model was compared with metabolic and contractile responses to repeated activation using values reported in the literature. Once validated in this way, the model was modified to reflect age‐related changes in neuromuscular function. Comparisons between initial and age‐modified simulations indicated that the age‐modified model predicted less fatigue during repeated isometric contractions, consistent with reports in the literature. Together, our simulations suggest that reduced glycolytic flux is the greatest contributor to the phenomenon of age‐related fatigue resistance. In contrast, oxidative resynthesis of phosphocreatine between intermittent contractions and inherent buffering capacity had minimal impact on predicted fatigue during isometric contractions. The insights gained from these simulations cannot be achieved through traditional in vivo or in vitro experimentation alone.
Key points
Muscle fatigue can be defined as the transient decrease in maximal force that occurs in response to muscle use. Fatigue develops because of a complex set of changes within the neuromuscular system that are difficult to evaluate simultaneously in humans.
The skeletal muscle of older adults fatigues less than that of young adults during static contractions. The potential sources of this difference are multiple and intertwined.
To evaluate the individual mechanisms of fatigue, we developed an integrative computational model based on neural, biochemical, morphological and physiological properties of human skeletal muscle.
Our results indicate first that the model provides accurate predictions of fatigue and second that the age‐related resistance to fatigue is due largely to a lower reliance on glycolytic metabolism during contraction.
This model should prove useful for generating hypotheses for future experimental studies into the mechanisms of muscle fatigue.
Abbreviations
- Fmax
maximal force‐generating capacity
- Lceo
optimal contractile element length
- MM
muscle model
- MN
motor neuron
- MVC
maximal voluntary contraction
- PCr
phosphocreatine
- Pi
inorganic phosphate
- Vmax
maximal shortening velocity
Introduction
The mechanisms of muscle fatigue, defined here as the acute decline in force‐generating capacity that accompanies repeated or sustained muscle contraction, are not completely understood because of the interrelated nature of the processes that influence this phenomenon. These processes are typically segregated as central or peripheral in nature. The term ‘central fatigue’ is used to describe a range of neural responses that ultimately reduce the ability to excite skeletal muscle voluntarily (Taylor et al. 2000). Inhibition of α‐motor neurons may result in decreased discharge rate or derecruitment of motor units, starting with the largest, highest‐threshold motor units (Kamen et al. 1995). Peripheral fatigue mechanisms are those located distal to the central nervous system and include reduced excitability at the motor endplate, smaller cytosolic Ca2+ transients, reduced Ca2+ sensitivity and inhibited actin–myosin force generation (Fitts & Balog, 1996; Galea, 2001). The byproducts of bioenergetic processes that maintain [ATP] in the face of changing energetic demands have been implicated for some time in the development of fatigue during repeated or prolonged contractions (Hill, 1929). Through multiple mechanisms, increased intracellular concentrations of inorganic phosphate (Pi) and H+ alter the contractile behaviour of skeletal muscle. Their combined effects ultimately lower force (Debold et al. 2013), rates of relaxation and, possibly, shortening velocity (Fitts & Balog, 1996). Data from in vitro studies suggest that Pi and H+ also reduce force‐generating capacity at the level of the cross‐bridge (Debold et al. 2012, 2013), but the extent to which these results reflect the behaviour of the intact neuromuscular system is not clear. Data from in vivo studies provide inconsistent results regarding metabolites such as [H+] and [ADP] (Kent‐Braun et al. 2002; Rico‐Sanz, 2003), but most support a strong association between diprotonated inorganic phosphate ([H2PO4 −]) and fatigue (Cooke et al. 1988; Miller et al. 1988; Wilson et al. 1988; Kent‐Braun, 1999, 2002; Lanza et al. 2006, 2007).
Although in vitro experiments provide explicit details about systems in isolation, and in vivo studies can describe the combined function of multiple systems, neither approach provides the opportunity to study intracellular metabolites, neural activation and contractile variables directly and simultaneously. Thus, both in vivo and in vitro approaches have limitations for addressing the mechanisms of fatigue. Computational models, on the contrary, can be used to predict the responses of complicated systems whose interrelated components preclude direct measurement or control. Computational models have been developed that successfully predict the function of multiple biophysical systems, ranging from nervous tissue (Heckman & Binder, 1991) to individual sarcomeres within skeletal muscle (Huxley, 1971). However, few models have been proposed that encompass the full range of physiological processes, from neural activation to intracellular bioenergetics, implicated in neuromuscular fatigue. We present a computational model meant to represent this range of physiological processes. In the present work, we extend a previously validated, integrative model of muscle torque production (Callahan et al. 2013) to predict the return to resting metabolite concentrations following contractions and the relationships that exist between bioenergetic perturbation and limitations on force‐generating capacity (i.e. fatigue).
Evidence in the literature suggests that during isometric or low‐velocity contractions, skeletal muscle fatigue occurs to a lesser extent in the muscles of older adults than young (Narici et al. 1991; Ditor & Hicks, 2000; Bilodeau et al. 2001; Callahan & Kent‐Braun, 2011), an observation first termed the ‘fatigue paradox’ by (Narici et al. 1993). Recent analyses indicate that age‐related fatigue resistance is observed least often during dynamic contractions (Callahan & Kent‐Braun, 2011) and most often during sustained (Hunter et al. 1999; Bazzucchi et al. 2005; Mademli & Arampatzis, 2008 b) or intermittent isometric contractions (Ditor & Hicks, 2000; Kent‐Braun et al. 2002; Chung et al. 2007). These results are supported by meta‐analysis of relevant findings in the literature (Christie et al. 2011). Several mechanisms have been proposed to explain age‐related fatigue resistance during isometric contractions, including alterations in motor neuron (MN) behaviour (Allman et al. 2004; Tevald et al. 2010), greater reliance on oxidative metabolism (Kent‐Braun et al. 2002; Lanza et al. 2007), increased metabolic economy (Hepple et al. 2004; Lanza et al. 2007) and lower net production of fatigue‐inducing metabolites (Coggan et al. 1993; Chilibeck et al. 1998; Kent‐Braun et al. 2002; Lanza et al. 2007) in old compared with young adults. However, conclusive evidence indicating the primacy of any of these potential mechanisms is lacking. This is likely to be the result of the many difficulties associated with performing such relative comparisons and the inability to modify any single aspect of the neuromuscular system independently in vivo.
The goal of the present study, therefore, was to formulate a computational model capable of making accurate predictions of neuromuscular fatigue and the attendant physiological responses observed during repeated voluntary contractions in vivo. We then adapted this model to make predictions regarding the effect of age on fatigue to gain insight into potential physiological mechanisms explaining the phenomenon of age‐related fatigue resistance. To accomplish this goal, various components in the model representing specific aspects of neuromuscular function were adjusted to reflect corresponding processes evaluated experimentally in the ankle dorsiflexors of older men. The overall prediction of fatigue in the age‐adapted model was confirmed by comparison with an independent data set available in the literature. Comparisons between the two versions of the model revealed new insights into the mechanisms of fatigue and suggest that higher glycolytic flux and metabolic cost in younger adults have the greatest impact on age‐related fatigue resistance.
Methods
Computational approach
The modular nature of the present model shares components with our previously published model (Callahan et al. 2013), which was based on in vivo data from the human ankle dorsiflexor muscle group during isometric contractions. To arrive at the simulations presented here, the previous model was extended with new functions representing the following: (i) the bioenergetic cost of activation and torque generation; (ii) the recovery of metabolic homeostasis following activation; and (iii) the influence of these competing processes on torque‐generating capacity. Specifically, the present model contains additional functions describing the efflux of H+ resulting from the development of acidosis, synthesis of phosphocreatine (PCr) following each contraction, and a mechanism whereby [H2PO4 −] limits force‐generating capacity. The system of equations that dictate neural excitation, muscle activation, contractile kinetics and metabolic perturbations associated with the development of force is identical to our previously published model (Callahan et al. 2013), unless noted otherwise. Experimental, in vivo data have been reported previously (Callahan et al. 2013; Lanza et al. 2007); all experiments from these studies were carried out in compliance with the Institutional Review Board at the University of Massachusetts Amherst and in accordance with guidelines set forth in the Declaration of Helsinki. All simulations were run using Matlab software (MathWorks, Natick, MA, USA).
The model presented here was parameterized using neural, contractile, bioenergetic and musculoskeletal data from a group of healthy young men (21–35 years old, n = 8; Callahan et al. 2013). Briefly, all steps in the forward integration routine in this model began with a single parameter meant to represent voluntary excitation (S; Fig. 1, step 1). This value serves as the input for a modelled pool of 60 MNs (Fig. 1, step 2), which closely follows a model by Fuglevand et al. (1993) and predicts a firing rate (FR) for each simulated neuron. A calcium transient model of activation follows (Fig. 1, step 3), providing input into a standard Hill muscle model (Fig. 1, step 4). Calculations related to the activation‐dependent fluctuation in metabolite concentrations are integrated with the muscle model to allow for prediction of the metabolic cost of contractions and return to homeostasis with rest. At each stage, this cellular bioenergetic model (Fig. 1, step 4a) interacts with the muscle model by affecting activation (Fig. 1, step 3). The linear sum of forces produced by all muscle models is input to a musculoskeletal model of the ankle joint and current joint torque (Tc) at the ankle is predicted (Fig. 1, step 5). Finally, Tc is compared with the ‘target’ torque, as defined a priori, at each point in time (Tt) for the duration of the fatigue protocol. A difference between Tc and Tt causes an increase or decrease of S such that the difference between Tc and Tt is minimized (Fig. 1, step 6). In this model, functions receive no input beyond initial conditions and Tt.
Figure 1. Computational approach and literature sources for model components .
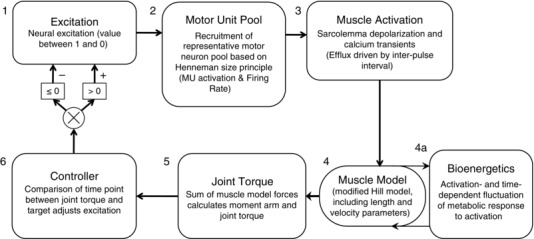
A control function (step 1) dictates excitation to a pool of 60 motor neurons (step 2). Each motor neuron is associated with corresponding fibre‐type‐specific muscle activation kinetics (step 3) and a Hill muscle model (step 4), whose function is modified by predicted concentrations of intracellular metabolites (step 4a). The sum of forces predicted by the Hill muscle models is used in a musculoskeletal model to predict joint torque (step 5), which is compared with a task defined a priori. The result of this comparison is then used to modify excitation (step 6). Abbreviation: MU, motor unit.
Fatigue model parameters
Derivation of the functions describing the control parameter (S), MN activation, force generation in Hill models representing multiple motor units, torque generation and bioenergetic cost have been described previously (Callahan et al. 2013). Additional functions, unique to the present model, were included to reflect the response of the previously published model to repeated activation in young adult males (Y‐Model). In addition, several components of the model were adjusted to reflect age‐related changes in neuromuscular function that have been identified as factors that might mediate the phenomenon of age‐related fatigue resistance; these adjustments to Y‐Model define the age‐adapted model (O‐Model). Differences between O‐Model and Y‐Model are given in Table 1 and described in relevant sections below. Additional differences between O‐Model and Y‐Model relating to neural activation and intracellular metabolism are indicated in Table 2.
Table 1.
Contractile properties and activation kinetics for young and age‐adapted versions of the model
| Parameter | Model | MM1 | MM60 | Weighted average |
|---|---|---|---|---|
| F max (N) | Y‐Model | 0.57 | 54.51 | 28.06 |
| O‐Model | 0.53 | 50.73 | 26.11 | |
| V max (L ceo s−1) | Y‐Model | 12.00 | 18.00 | 16.43 |
| O‐Model | 12.00 | 15.75 | 14.84 | |
| τdeact (ms) | Y‐Model | 92 | 64.6 | 70.2 |
| O‐Model | 120 | 84.3 | 91.6 | |
| τact (ms) | Y‐Model | 60 | 39 | 43.4 |
| O‐Model | 60 | 45 | 48.2 |
Contractile element parameters are as follows: maximal force‐generating capacity (F max); maximal shortening velocity (V max); deactivation time constant (τdeact); and activation time constant (τact). Data are presented for the young (Y‐Model) and old (O‐Model) parameters of the muscle model (MM). To illustrate the range within each variable across all MMs representing the 60 modelled motor units, values are shown for the first (MM1) and last (MM60) individual muscle models (step 4 in Fig. 1) within the overall model, along with their average, weighted by MM force‐generating capacity (F max) in order to provide a relevant comparison with in vivo measures. L ceo, optimal contractile element length.
Table 2.
Variable and parameter values
| Parameters | Model | MM1 | MM60 | Weighted Average | |
|---|---|---|---|---|---|
| Intracellular metabolic variables | PCr (mm) | Y‐Model | 38.6 | 38.6 | 38.56 |
| O‐Model | 37 | 37 | 37.01 | ||
| Glycolytic capacity | Y‐Model | 0.49 | 1.92 | 1.5 | |
| O‐Model | 0.24 | 0.95 | 0.7443 | ||
| pH | Y‐Model | 7.01 | 7.01 | 7.01 | |
| O‐Model | 7.03 | 7.03 | 7.03 | ||
| Intracellular buffering capacity (β) | (Slykes) | Y‐Model | 11.8 | 11.8 | 11.8 |
| O‐Model | 11.8 | 11.8 | 11.8 | ||
| βinherent (Slykes) | Y‐Model | 5 | 5 | 5* | |
| O‐Model | 15 | 15 | 15* | ||
| (Slykes) | Y‐Model | 2.99 | 2.99 | 2.99 | |
| O‐Model | 4.09 | 4.09 | 4.09 | ||
| Motor unit discharge rates | Peak firing rate (Hz) | Y‐Model | 55.6 | 46 | n.a.* |
| O‐Model | 44.6 | 35 | |||
| Minimal firing rate (Hz) | Y‐Model | 8 | 8 | n.a.* | |
| O‐Model | 8 | 8 |
Values for intracellular metabolic, buffering and motor unit variables and parameters (latter denoted by *) for the range of muscle models (MM1–60) meant to reflect motor units in young (Y‐Model) and older (O‐Model) neuromuscular systems. Values reflect those used at time = zero in all simulations. By definition, variables varied during the simulation, while parameters remained constant. The weighted average reflects the average of all MMs, scaled by MM force‐generating capacity, thus providing relevant comparison to in vivo measures.
Modelling intracellular bioenergetics, fatigue and recovery
Fatigue was dependent on the predicted accumulation of H2PO4 − through a negative, linear association between [H2PO4 −] and activation (step 3; see eqn 3). This is meant to reflect the inverse relationship between [H2PO4 −] and Ca2+‐mediated force generation observed in vitro (Nosek et al. 1987) and in vivo (Wilson et al. 1988; Kent‐Braun et al. 2002; Lanza et al. 2006). The model predictions for Pi accumulation were activation dependent. This rate was limited by the square root of the percentage of PCr remaining during contraction, as follows:
| (1) |
A model of glycolysis based on the Michaelis–Menten relationship between [Pi] and glycogen phosphorylase (Chasiotis et al. 1982) was used to predict the rate of proton generation from this metabolic pathway. The K m of this relationship was assumed to be 18.94 mm (Chasiotis et al. 1982; Ren et al. 1988). Protons were produced from non‐oxidative glycolysis, consumed by the creatine kinase reaction (reflected by the rate of Pi accumulation) and buffered by several intracellular processes as previously described (Callahan et al. 2013).
Following each contraction in which modelled intracellular pH was more acidic than the initial value of 7.05, [H+] returned to baseline through a model representing the multiple processes that return postactivation intracellular pH to resting levels (predominately cellular efflux of [H+]). The calculation used to predict efflux was based on reported experimental values (van den Broek et al. 2007) and expressed mathematically by the following equation:
| (2) |
where E rate was the linear rate constant for proton efflux (Kemp et al. 1997) and –pH was the difference between current pH and baseline pH.
Recovery of [Pi] to baseline following activation was modelled after our own experimental observations. In vivo, phosphorus magnetic resonance spectroscopy was used to monitor the recovery to baseline of [Pi] and [PCr] following contractions at multiple intensities in young and older men (Christie et al. 2014). Recovery rates of [Pi] and [PCr] were fit with a third‐order exponential decay or rise to maximum, for Pi and PCr, respectively. The first derivatives of these equations were used to calculate rates of change for [Pi] in the model.
Experimental observation revealed that the recovery kinetics of [Pi] depended on the extent of [PCr] depletion and was independent of pH at the end of the contraction. These effects were reflected in the model by coefficients that related the rate of recovery to the extent of Pi accumulation. Throughout the simulated contraction protocol, [H2PO4 −] was calculated from [Pi] and pH at each time point, according to the following equation:
| (3) |
The accumulation of [H2PO4 −] limited force in the model and thus simulated fatigue by limiting voluntary excitation (S), and muscle activation (Act) to the motor unit recruitment and muscle models, respectively. These limits (ActLim) were based on literature values (Lanza et al. 2007) and expressed mathematically by the following equation:
| (4) |
Modelling the motor neuron pool
The modelled pool of MNs was adjusted to reflect changes in discharge properties of α‐MNs of older adults. Peak firing rates for recruited MNs were reduced from 56 Hz in Y‐Model to 45 Hz (Rubinstein & Kamen, 2005). The range of peak firing rates across 60 simulated MNs was also limited from 10 to 8 Hz (Rubinstein & Kamen, 2005). The minimal firing rate was set to 8 Hz; activation thresholds were identical in Y‐Model and O‐Model. A more detailed explanation of the MN model is presented by Callahan et al. (2013).
Modelling activation kinetics
The equations defining activation and deactivation (i.e. Ca2+) kinetics were altered slightly from those previously based on He et al. (1991). Evidence for age‐related changes in activation kinetics has been described in rodents (Larsson & Salviati, 1989; Weisleder et al. 2006; Russ et al. 2014) and, to a lesser extent, in humans (Delbono et al. 1997; Lamboley et al. 2015). However, it is likely that the magnitude of age‐related changes in activation kinetics is relatively minor when compared with differences in kinetics between muscle fibres of different myosin heavy chain isoforms. It is likely that muscle fibre‐type‐dependent rates of calcium efflux (Calderon et al. 2009) may lead to an overall slowing of activation in older adults, based on their small shift towards a greater population of type I muscle fibres (Jakobsson et al. 1990). To reflect a fibre‐type‐dependent shift in activation kinetics, the average time constant for activation (60 ms) was not changed in O‐Model, but the 35% range of activation time constants was reduced to 25%. In contrast to the limited evidence for age‐related changes in activation kinetics, ample evidence supports the notion of prolonged deactivation in older muscle. Although the rate of calcium uptake from the cytosol varies by muscle fibre type (Stephenson & Williams, 1981), calcium resequestration within a given fibre type can be as much as 35% slower in older compared with younger human skeletal muscle (Hunter et al. 1999). This slowing of deactivation was described mathematically by Thelen (2003) and has been accomplished here by an increase in the average deactivation time constant from 92 (Y‐Model) to 120 ms (O‐Model). Further revision of the model included a 0.004 s increase of the ‘on’ transient period of the Ca2+ signal (from 0.023 to 0.027 s). This was done primarily to ensure that the model was capable of achieving complete activation, despite lower MN firing rates, and is consistent with in vivo data (Chung et al. 2007).
Modelling contractile kinetics
Several variables were altered in the O‐Model to reflect age‐related changes in contractile characteristics (Narici et al. 1991; Ng & Kent‐Braun, 1999), independent of activation (Ca2+) kinetics. These alterations are listed in Table 1. Contractile slowing has been observed in vivo (Narici et al. 1991; Allman et al. 2004; Tevald et al. 2010). Reduced rates of force development have been attributed to altered fibre‐type distribution (Larsson et al. 1997) and age‐related contractile slowing that occurs within fibres of the same type (Ochala et al. 2007). In our approach, this contractile slowing was expressed across the population of muscle models (MMs), each of which corresponds to and receives its activation signal from one of 60 MNs. These were co‐ordinated such that the MN recruited first corresponded to the slowest, least forcefully contracting muscle model, MM1. Although MM1 had similar maximal shortening velocities (V max) to MM1 in Y‐Model, V max in the muscle model associated with the highest threshold MN (MM60) was reduced by 12.5% compared with MM60 in Y‐Model, based on previous reports (Thelen, 2003) and modified to yield adequate force fusion at relevant physiological firing rates (Fig. 2). Given that the range of force‐generating capacities assigned to these models was not linearly distributed, the overall V max of all 60 muscle models was not equal to the arithmetic mean V max of the models; rather, the overall V max [expressed in terms of optimal contractile element lengths (L ceo) per second] was weighted according to muscle fibre force‐generating capacity such that the model contributing the greatest force had the greatest influence on V max. The V max was 16.43L ceo s−1 in Y‐Model and 14.84L ceo s−1 in O‐Model.
Figure 2. Torque–frequency relationships in young and older men .
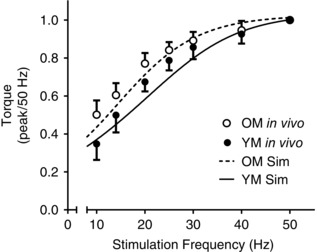
Comparison of experimental torque in response to electrical stimulation of the peroneal nerve with that simulated using the model. Experimental data are indicated by filled (young males, YM) and open circles (older males, OM) representing mean values ± SD at several frequencies. Continuous and dashed lines are five‐parameter sigmoid curves fitted to simulated torque predicted by the Y‐Model and O‐Model, respectively.
In addition to alterations made to the range of V max across the contractile elements, maximal force‐generating capacity (F max) was reduced by 4.6% for O‐Model. This alteration was based on a similar reduction in anterior compartment fat‐free muscle cross‐sectional area observed experimentally (Christie et al. 2014).
Simulation procedures and evaluation
The quality of the model excitation and contractile predictions in an aged neuromuscular system were evaluated by simulating a traditional force–frequency analysis in vivo, as described previously (Callahan et al. 2013). Briefly, a train of ‘stimuli’ was simulated by setting S = 1 for the first 0.029 s of the duration between subsequent MN firings (duration = 1/stimulation frequency) to mimic stimulation of the Ca2+ transient. This simulation was repeated for frequencies between 1 and 50 Hz in Y‐Model and O‐Model. The resulting force–frequency relationships were fitted by five‐parameter asymmetrical sigmoid functions (Prism; GraphPad Software, La Jolla, CA, USA) and compared with in vivo measures from the literature (Tevald et al. 2010).
To test the ability of the model to predict torque, activation and metabolic changes, a 12 s maximal voluntary contraction (MVC) was simulated using both models. In this case, Tt was set to 110% to ensure the Tc was always <Tt, thus producing maximal activation. A 180 s recovery period was simulated following this contraction to allow for testing of recovery dynamics in the model. The output from these simulations was then compared with in vivo data from older men to test the validity of metabolic predictions using the newly formulated model.
To test the ability of the model to predict fatigue, a simulation of six 12 s contractions was run using both Y‐Model and O‐Model. Each contraction was separated by 12 s of rest. This protocol was designed to match published data from our laboratory, which were used for the comparison of fatigue and intracellular metabolites in healthy young and older male cohorts (Lanza et al. 2007). To investigate further which properties of neuromuscular function had the most profound impact on predicted fatigue, multiple simulations were run in which single components of the model were altered and the results compared between Y‐Model and O‐Model. Specifically, equations describing activation‐dependent PCr depletion rate, PCr recovery following activation, inherent intracellular buffering capacity and activation‐dependent glycolytic flux were each exchanged between Y‐Model and O‐Model. Finally, to predict fatigue in ischaemic conditions, during which oxidative metabolism is negligible, simulations were run in Y‐Model and O‐Model for which the parameters predicting PCr synthesis between activations were excluded. Fatigue predicted by these latter simulations was compared with fatigue reported by Lanza et al. (2007), who used cuff occlusion to eliminate blood flow and thus the oxidative recovery of PCr between contractions. All simulations produced data for 135 s with 0.001 s time resolution.
Results
Y‐Model: fatigue
Metabolic perturbations from the Y‐model simulation and corresponding in vivo measures of a single 12 s MVC are illustrated in Fig. 3 A–C. Simulated depletion and recovery of intracellular metabolites compared well with in vivo measures (Lanza et al. 2006), in both rate and amplitude. Similar results were observed in the prediction of pH through the contraction and recovery cycle. Repeated voluntary contractions were simulated, and the responses of selected metabolites are illustrated in Fig. 4 A–C with corresponding in vivo observations (Fig. 4 D–F) for comparison (Lanza et al. 2007). The simulated fatigue response to repeated contractions showed strong concordance with in vivo results (Fig. 5 A; Lanza et al. 2006).
Figure 3. Simulated metabolic response to a 12 s maximal voluntary contraction .
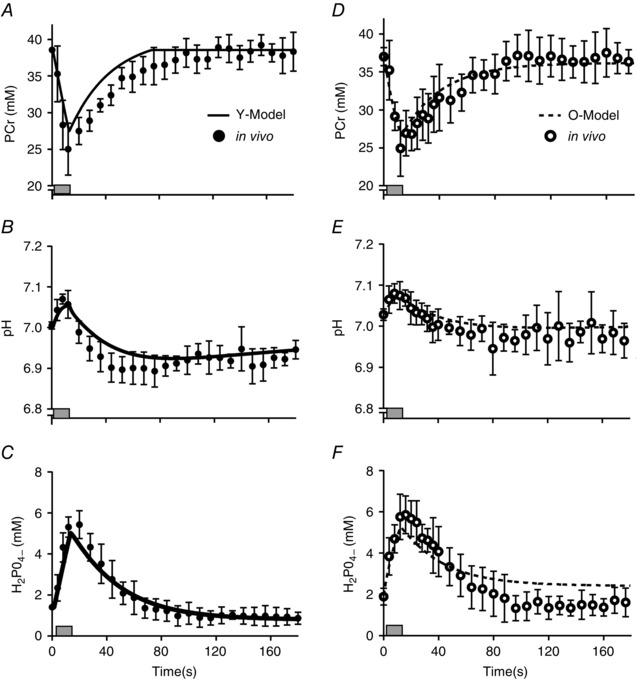
A–C, simulated data from Y‐Model (continuous line) are compared with in vivo observations in young men (filled circles; means ± SD); data are shown for PCr (A), pH+ (B) and H2PO4 − (C). D–F, the same data are provided for older men (open circles; means ± SD) and simulated by the O‐Model (dashed line). Shaded rectangles indicate duration of the contraction.
Figure 4. Simulated repeated maximal voluntary contraction protocol .
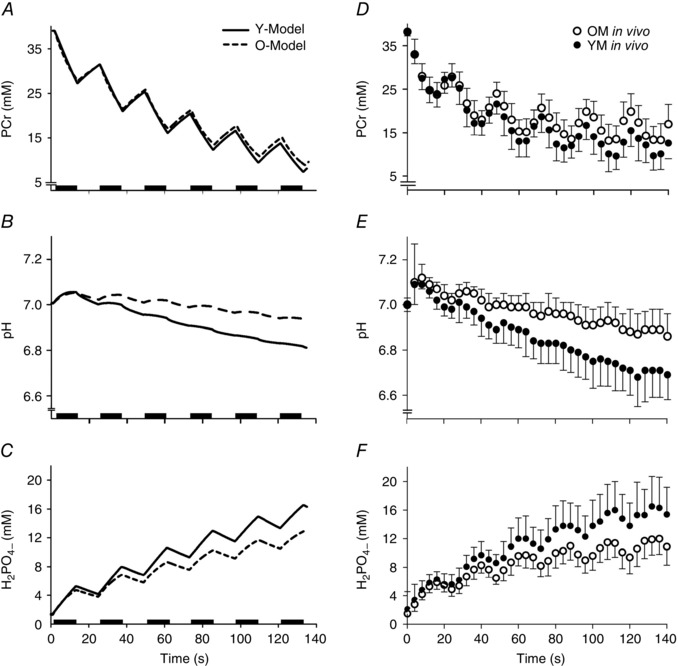
A–C, model output from a simulation of repeated maximal voluntary contractions reveals predicted metabolic responses of intracellular metabolites PCr (A), H+ (B) and H2PO4 − (C). Output from Y‐Model (continuous line) is compared with that from O‐Model (dashed line). D–F, experimental data (Lanza et al. 2007) for PCr (D), H+ (E) and H2PO4 − (F).
Figure 5. Fatigue predicted from model simulation .

A, fatigue predicted by the Y‐model (continuous line) is compared with previously published (Lanza et al. 2007) in vivo observations in young males (filled circles; means ± SD). B, corresponding data from O‐model (dashed line) are compared with previously published (Lanza et al. 2007) in vivo observations in older males (open circles; means ± SD).
O‐Model: activation and metabolic perturbation
Adjustments made to the model to reflect age‐related changes to activation and contractile characteristics were evaluated for accuracy by comparison with in vivo data (Tevald et al. 2010; Callahan et al. 2013). Comparisons were made by simulating a stimulation pattern meant to emulate neuromuscular stimulation at a range of discrete frequencies. The results from these simulations were compared with in vivo data from the literature for both young and older males (Tevald et al. 2010) and are illustrated in Fig. 2. Torque predicted from O‐Model was, in some instances, below observed torque, but within 1 SD of nearly all measured values. Compared with Y‐Model, simulations from O‐Model demonstrated a leftward shift in the torque–frequency relationship, as is reported in studies of the effects of age on the force–frequency relationship (Narici et al. 1991; Tevald et al. 2010).
A simulation of the metabolic responses to a single 12 s MVC using O‐Model are illustrated in Fig. 3 D–F. As with Y‐Model, bioenergetic perturbation and restitution to baseline values for intracellular metabolites agreed well with previously published in vivo measures (Lanza et al. 2007) and unpublished observations from the same data set. A slight over‐prediction of [H2PO4 −] was observed following the contraction (Fig. 3 F), although this may have been an artifact of the spectroscopy measure itself (see Discussion). The simulated bioenergetic response to repeated MVCs predicted by O‐Model are illustrated in Fig. 4 D–F and agree well with in vivo data from the literature (Lanza et al. 2006, 2007; Larsen et al. 2009; Christie et al. 2014), demonstrating reduced acidosis and accumulation of H2PO4 − when compared with Y‐Model and similar PCr depletion (Fig. 4).
O‐Model: age‐related fatigue resistance
The magnitude of fatigue predicted by both models was consistent with in vivo measures (Lanza et al. 2007), as illustrated in Fig. 5 A and B. Comparison of O‐Model with Y‐Model revealed less fatigue in O‐Model (81.1% of initial) than that predicted by Y‐Model (75.2% of initial). This level of fatigue and degree of age‐related resistance agree well with earlier in vivo work using a similar protocol (Lanza et al. 2006, 2007; Chung et al. 2007).
Multiple simulations were run to compare the fatigue response in Y‐Model and O‐Model, with parameters related to glycolytic flux, metabolic cost of contraction and inherent buffering capacity switched between them to investigate the relative impact of each parameter on the fatigue response without altering other age‐related differences. The fatigue predictions for each simulation are presented in Table 3. Although each parameter compared in these analyses affected the fatigue prediction to some extent, switching the parameters that estimated glycolytic flux had the greatest impact on predicted fatigue in Y‐Model and O‐Model. This parameter switch resulted in lesser and greater fatigue predicted from Y‐Model and O‐Model, respectively (Table 3). Switching the rate of Pi recovery between models, such that rate of Pi recovery was reduced in Y‐Model and increased in O‐Model, had the expected result of increasing fatigue in Y‐Model and decreasing fatigue in O‐Model. Changes to inherent buffering capacity and the cost of contraction (rate of PCr depletion) resulted in minimal changes to overall fatigue predicted in both Y‐Model and O‐Model. Finally, eliminating the capacity to resynthesize PCr between activations, thus simulating ischaemia, increased fatigue predicted in both models. These predictions were consistent with in vivo results previously reported by our group (Lanza et al. 2007). In the case of O‐Model, the predictions of fatigue were within 0.1% of the in vivo observation.
Table 3.
Fatigue results from in vivo observations and model simulations
| Fatigue (% initial TTI) | ||||||||
|---|---|---|---|---|---|---|---|---|
| Lanza et al. (2007) | Standard model | Parameter switch | ||||||
| In vivo | Simulated | Inherent buffering | Activation‐dependent | Pi recovery | Glycolytic | |||
| Model | In vivo | (ischaemic) | Simulated | (ischaemic) | capacity | Pi kinetics | kinetics | flux |
| Y‐Model | 75.1 | 62.8 | 75.2 | 67.5 | 76.1 | 76.0 | 73.0 | 80.0 |
| O‐Model | 84.1 | 76.0 | 81.1 | 75.9 | 80.4 | 80.4 | 82.2 | 77.1 |
Fatigue data from in vivo observations (Lanza et al. 2007) and multiple simulations performed by Y‐Model and O‐Model. Fatigue is presented as the time tension integral (TTI) of the last contraction, expressed as a percentage of the TTI of the first contraction. In standard simulations, model parameters were assigned as described in the Methods. In simulations indicated by the ‘parameter switch’ column, the model component indicated in the subheading was altered in Y‐Model to match the corresponding component in O‐Model and vice versa. Simulations were run for all models, and fatigue was calculated as described in the Methods. Switching the glycolytic parameters was the only approach to reverse the prediction of age‐related fatigue resistance fully.
Discussion
Simulations generated by our model and presented here suggest that although multiple age‐related changes in neuromuscular function contribute to fatigue, lesser reliance on glycolytic metabolism is the greatest single factor explaining the phenomenon of age‐related fatigue resistance. The simulations presented here are the first to predict the intracellular bioenergetic responses and subsequent fatigue during repeated isometric contractions in vivo, while presenting accurate activation and contractile kinetic components reflective of the neuromuscular systems of young and older adults.
Although previous models have been developed successfully to capture the effects of age on activation and contractile function (Thelen, 2003; Hasson et al. 2009, 2011) and others have predicted fatigue during prolonged or repeated contractions (Rohmert, 1960; Levin & Mizrahi, 1999; Ding et al. 2000; Xia & Frey Law, 2008; Dideriksen et al. 2011), ours is the first model to do both simultaneously. This approach is necessary to interrogate the multiple potential contributors to fatigue resistance and, ultimately, to estimate their relative contribution to the overall neuromuscular behaviour. Simulations produced by O‐Model and Y‐Model predicted age‐related differences in metabolic variables implicated in fatigue resistance. Comparisons with in vivo data confirm the predictions made using these models and support their use as predictive tools to measure the relative impact of specific physiological variables on neuromuscular fatigue. These claims are substantiated by additional simulations that demonstrate the adaptability of the present model; namely, the ability to predict fatigue in ischaemic conditions.
Predictions of voluntary and stimulated force
Predicted voluntary force during a single 12 s contraction agreed with in vivo observation for both Y‐Model (within 0.2% of in vivo observation; Callahan et al. 2013) and O‐Model (within 3.9% of in vivo observation; Christie et al. 2014). The kinetics of force generation and relaxation in Y‐Model and O‐Model were demonstrated via simulation of torque–frequency relationships and compared with in vivo observation (Fig. 2). These comparisons confirmed accurate reproduction of torque output with increasing stimulation frequency, as well as the age‐related leftward shift in the torque–frequency relationship. These relationships are important in the context of fatigue prediction because the limits (ActLim) on stimulation (S) in the model will decrease motor unit discharge rates and thus reduce force production in a manner consistent with in vivo observations (Rubinstein & Kamen, 2005).
Age‐related fatigue resistance
The present models demonstrate both accuracy and flexibility by predicting age‐related fatigue resistance as well as metabolic responses to relatively brief, maximal activation patterns. The declines in peak torque over the entire sequence of contractions were especially well predicted for both Y‐Model and O‐Model (Fig. 5). It is worth noting, however, that fatigue within each simulated contraction was relatively less than that observed in vivo. This within‐contraction discrepancy could not be resolved unless model parameter values were adjusted such that intracellular metabolic predictions were well outside the range of in vivo observation. In addition, these parameter adjustments yielded simulations with less accurate fatigue predictions across the entirety of the contraction protocol. Given the necessary simplification inherent in any computational model, the lesser rate of fatigue within contractions is likely to reflect one or more secondary factors (altered Ca2+ sensitivity or membrane excitability) that, while not explicitly represented in the present model, nevertheless contribute to fatigue in vivo. Although there would be trade‐offs associated with adding to the complexity of the model, identifying these factors and their relative contributions could be fruitful targets for future extensions of the model.
An important aspect of this study is the result of simulations in which components of one model were substituted with the other in order to evaluate their impact on age‐related fatigue resistance. As shown in Table 3, our model suggests that a greater reliance on glycolytic ATP production has the greatest impact on differences in fatigue predicted by Y‐Model and O‐Model. This observation is consistent with previous hypotheses related to fatigue resistance in ageing (Kent‐Braun et al. 2002; Lanza et al. 2005, 2007). However, our predictions are in apparent contrast to investigations suggesting that oxidative metabolism and metabolic economy explain the most variation in fatigue (Nakagawa et al. 2005; Sirikul et al. 2007). In our models, substituting the Pi kinetics during activation (an index of metabolic cost of contraction) of O‐Model with those of Y‐Model did little to increase glycolytic flux in O‐Model. Therefore, we performed a simulation inspired by published in vivo work from our laboratory (Lanza et al. 2007), in which PCr recovery was inhibited. It was expected that in O‐Model, increased glycolytic flux would result in greater fatigue during ischaemia. These simulations, in which PCr recovery was inhibited in order to mimic contractions in ischaemic conditions, were consistent with experimental results where fatigue (and glycolytic flux) increased substantially compared with conditions in which PCr was allowed to recover. As with the experimental data, simulated fatigue in O‐Model remained less than the fatigue generated by Y‐Model in the same conditions. Interestingly, fatigue within each simulated contraction in conditions of no PCr recovery (i.e. modelled ‘ischaemic’ conditions) was closer to in vivo observations than predictions for contractions in which PCr recovery was not inhibited (i.e. modelled ‘free‐flow’ conditions; data not shown). This result suggests that blood flow may be one potential source of the modest discrepancy between in vivo and simulated within‐contraction fatigue. Overall, these simulations provide further support for the notion that a greater reliance on glycolysis is the greatest single contributor to the phenomenon of age‐related fatigue resistance.
It is important to note that non‐oxidative glycolytic flux itself does not directly cause fatigue but instead produces H+, thus facilitating the formation of H2PO4 − by combination with Pi. Accumulation of H2PO4 − has been suggested to limit force‐generating capacity. The precise mechanisms by which these metabolic byproducts influence fatigue include altered Ca2+ sensitivity (Debold et al. 2013), inhibition of excitation–contraction coupling (Lee & Allen, 1991) and reduced force production by actin–myosin cycling (Debold et al. 2008). Our model is not designed to determine which of these mechanisms ultimately causes fatigue, but experimental evidence (Nelson et al. 2014) and models specifically formulated to investigate fatigue at the cross‐bridge level (Shorten et al. 2007) suggest that elevated [H+] and [Pi] are likely to have additive effects that both reduce force at the cross‐bridge and inhibit Ca2+ sensitivity. Our approach, which uses a Hill‐type model of muscle contraction, was not developed at the scale necessary to investigate fatigue at the level of the sarcomere. Instead, we focused on factors contributing to altered neural activation and intracellular environment and suggest that, among the myriad differences between the neuromuscular systems of young and older adults, a tendency for the young to rely on the glycolytic provision of ATP is the greatest contributor to age‐related differences in acute neuromuscular fatigue.
Methodological considerations
A number of methodological decisions were necessary during the development of this model, and these decisions should be considered when interpreting its results. Values for the parameters incorporated into the model and used to predict metabolic and contractile behaviour fall within the range of in vivo data available from the literature and our own unpublished observations. However, these measures will vary between individuals, and some may depend on factors other than age, such as muscle group or habitual patterns of use (Larsen et al. 2009). In addition, in vivo measures of the intracellular environment depend on multiple factors, not all of which can be quantified precisely. These include, but are not limited to, calcium concentration, buffering capacity and resting metabolic rate. Therefore, our range of inputs were meant to reflect what is currently known about the range of various physiological characteristics and will best reflect group mean responses rather than individual subject characteristics. Likewise, errors in any model can offset one another and lead to reasonable predictions through flawed means. However, the process of developing this phenomenological model included systematic, stepwise comparisons of model output and experimental data at each step (Fig. 1). These comparisons indicated that our inputs produced predictions that were consistent (<2 SD variance in all cases, and <1 SD in the vast majority) with the in vivo functions they were meant to represent. Finally, an advantage of the modular approach taken here is that individual parameters may be revised independently, thus allowing evaluation of the impact of each on force and fatigue.
An explicit prediction of oxidative ATP production is absent from our model. Instead, the contribution of oxidative metabolism to ATP production during contraction and the PCr resynthesis during recovery are implied by predictions of PCr and Pi kinetics, as PCr synthesis following contraction is accomplished primarily via oxidative phosphorylation (Quistorff et al. 1993). At the same time, production of H+ by oxidative metabolism during PCr synthesis following contraction is accounted for in our model. In the simulations presented here, our model provided predictions of metabolic changes entirely consistent with in vivo measures (Kent‐Braun et al. 2002; Lanza et al. 2007).
Despite our attempts to incorporate a wide range of physiological components that might influence fatigue, the complexity of the model does not approach that of the human neuromuscular system. As with all computational models, the interest in fully describing complex relationships was balanced with necessary simplification of computational aspects for which precise experimental descriptions are unavailable. For example, variations in age‐related changes to central activation can be found in the literature, with some finding greater failure in older subjects (Bilodeau et al. 2001; Stackhouse et al. 2001) and others reporting minimal or no difference (Chung et al. 2007; Mademli & Arampatzis, 2008 a; Callahan & Kent‐Braun, 2011). The same can be said of inherent buffering capacity (Parkhouse et al. 1985; Lanza et al. 2005), which itself is difficult to measure directly. Future incarnations of the present model might be adapted to include varying degrees of central activation failure, motor unit behaviour, fibre‐type changes, inherent buffering capacity and control of oxidative metabolism. Although the present model was constrained to isometric contractions, it can easily be extended to simulate dynamic contractions in future work.
Finally, the contributions of altered Ca2+ sensitivity, excitation–contraction coupling and reduced actin–myosin cycling to fatigue are implicit components in this model but do not have explicit mathematical representations in the model formulation. This limits our ability to interrogate the relative contribution of these sites to fatigue. A multiscale model incorporating both musculoskeletal and sarcomeric representations, which has been a persistent challenge in the field, has recently been addressed (Röhrle et al. 2012; Mordhorst et al. 2015). Although these studies addressed different experimental questions from those we have focused on in the present study, our future efforts may benefit from these examples.
Future directions
The present model has been parameterized to represent the function of healthy, physically active younger men, as well as a group of healthy, relatively sedentary older men. The inputs to the model used to characterize these subject groups can be adapted to represent other populations without significant alterations to the computational approach. Clinical populations characterized by altered neural function (multiple sclerosis), cellular metabolism (McCardle's disease or diabetes) or skeletal muscle atrophy (cancer or human immunodeficience virus) could be investigated with the present version of the model simply by changing the model parameter values. The model could also be applied to questions of sex‐specific differences in fatigue or provide expectations for altered fatigue characteristics following disuse or exercise training.
Conclusion
We have presented a novel computational model that accurately predicts fatigue in response to MVC in humans. This model was used to perform simulations, and the results indicate that a greater reliance on glycolytic phosphorylation in younger men is the greatest single contributor to the phenomenon of age‐related fatigue resistance during isometric contractions. Perhaps most importantly, in establishing the utility of this model, we provide a valuable tool that can be used to guide study design and further our understanding of human neuromuscular function.
Additional information
Competing interests
None declared.
Author contributions
D.M.C. and B.R.U.: conception and design; provision of study materials or patients; collection and assembly of data; data analysis and interpretation; and manuscript writing. J.A.K.: conception and design; financial support; administrative support; provision of study materials or patients; data analysis and interpretation; and manuscript writing. All authors have approved the final version of the manuscript and agree to be accountable for all aspects of the work. All persons designated as authors qualify for authorship, and all those who qualify for authorship are listed.
Funding
This work was supported by Office of Extramural Research, National Institutes of Health grants R01 AG21094 (to J.A.K.) and K02 A6023582 (to J.A.K.).
Acknowledgements
The authors thank Drs John Buonaccorsi, Anita Christie, Ned Debold and Ian Lanza for their assistance with this project as well as the volunteers who contributed their time.
This is an Editor's Choice article from the 15 June 2016 issue.
References
- Allman BL, Cheng AJ & Rice CL (2004). Quadriceps fatigue caused by catchlike‐inducing trains is not altered in old age. Muscle Nerve 30, 743–751. [DOI] [PubMed] [Google Scholar]
- Bazzucchi I, Marchetti M, Rosponi A, Fattorini L, Castellano V, Sbriccoli P & Felici F (2005). Differences in the force/endurance relationship between young and older men. Eur J Appl Physiol 93, 390–397. [DOI] [PubMed] [Google Scholar]
- Bilodeau M, Erb MD, Nichols JM, Joiner KL & Weeks JB (2001). Fatigue of elbow flexor muscles in younger and older adults. Muscle Nerve 24, 98–106. [DOI] [PubMed] [Google Scholar]
- Calderon JC, Bolanos P, Torres SH, Rodriguez‐Arroyo G & Caputo C (2009). Different fibre populations distinguished by their calcium transient characteristics in enzymatically dissociated murine flexor digitorum brevis and soleus muscles. J Muscle Res Cell Motil 30, 125–137. [DOI] [PubMed] [Google Scholar]
- Callahan DM & Kent‐Braun JA (2011). Effect of old age on human skeletal muscle force‐velocity and fatigue properties. J Appl Physiol 111, 1345–1352. [DOI] [PMC free article] [PubMed] [Google Scholar]
- Callahan DM, Umberger BR & Kent‐Braun JA (2013). A computational model of torque generation: neural, contractile, metabolic and musculoskeletal components. PLoS ONE 8, e56013. [DOI] [PMC free article] [PubMed] [Google Scholar]
- Chasiotis D, Sahlin K & Hultman E (1982). Regulation of glycogenolysis in human muscle at rest and during exercise. J Appl Physiol Respir Environ Exerc Physiol 53, 708–715. [DOI] [PubMed] [Google Scholar]
- Chilibeck PD, Paterson DH, McCreary CR, Marsh GD, Cunningham DA & Thompson RT (1998). The effects of age on kinetics of oxygen uptake and phosphocreatine in humans during exercise. Exp Physiol 83, 107–117. [DOI] [PubMed] [Google Scholar]
- Christie A, Snook EM & Kent‐Braun JA (2011). Systematic review and meta‐analysis of skeletal muscle fatigue in old age. Med Sci Sports Exerc 43, 568–577. [DOI] [PMC free article] [PubMed] [Google Scholar]
- Christie AD, Tonson A, Larsen RG, DeBlois JP & Kent JA (2014). Human skeletal muscle metabolic economy in vivo: effects of contraction intensity, age, and mobility impairment. Am J Physiol Regul Integr Comp Physiol 307, R1124–R1135. [DOI] [PMC free article] [PubMed] [Google Scholar]
- Chung LH, Callahan DM & Kent‐Braun JA (2007). Age‐related resistance to skeletal muscle fatigue is preserved during ischemia. J Appl Physiol 103, 1628–1635. [DOI] [PubMed] [Google Scholar]
- Coggan AR, Abduljalil AM, Swanson SC, Earle MS, Farris JW, Mendenhall LA & Robitaille PM (1993). Muscle metabolism during exercise in young and older untrained and endurance‐trained men. J Appl Physiol 75, 2125–2133. [DOI] [PubMed] [Google Scholar]
- Cooke R, Franks K, Luciani GB & Pate E (1988). The inhibition of rabbit skeletal muscle contraction by hydrogen ions and phosphate. J Physiol 395, 77–97. [DOI] [PMC free article] [PubMed] [Google Scholar]
- Debold EP, Beck SE & Warshaw DM (2008). Effect of low pH on single skeletal muscle myosin mechanics and kinetics. Am J Physiol Cell Physiol 295, C173–C179. [DOI] [PMC free article] [PubMed] [Google Scholar]
- Debold EP, Longyear TJ & Turner MA (2012). The effects of phosphate and acidosis on regulated thin‐filament velocity in an in vitro motility assay. J Appl Physiol 113, 1413–1422. [DOI] [PubMed] [Google Scholar]
- Debold EP, Walcott S, Woodward M & Turner MA (2013). Direct observation of phosphate inhibiting the force‐generating capacity of a miniensemble of myosin molecules. Biophys J 105, 2374–2384. [DOI] [PMC free article] [PubMed] [Google Scholar]
- Delbono O, Renganathan M & Messi ML (1997). Excitation‐Ca2+ release‐contraction coupling in single aged human skeletal muscle fiber. Muscle Nerve Suppl 5, S88–S92. [DOI] [PubMed] [Google Scholar]
- Dideriksen JL, Enoka RM & Farina D (2011). Neuromuscular adjustments that constrain submaximal EMG amplitude at task failure of sustained isometric contractions. J Appl Physiol 111, 485–494. [DOI] [PubMed] [Google Scholar]
- Ding J, Wexler AS & Binder‐Macleod SA (2000). A predictive model of fatigue in human skeletal muscles. J Appl Physiol 89, 1322–1332. [DOI] [PubMed] [Google Scholar]
- Ditor DS & Hicks AL (2000). The effect of age and gender on the relative fatigability of the human adductor pollicis muscle. Can J Physiol Pharmacol 78, 781–790. [PubMed] [Google Scholar]
- Fitts RH & Balog EM (1996). Effect of intracellular and extracellular ion changes on E–C coupling and skeletal muscle fatigue. Acta Physiol Scand 156, 169–181. [DOI] [PubMed] [Google Scholar]
- Fuglevand AJ, Winter DA & Patla AE (1993). Models of recruitment and rate coding organization in motor‐unit pools. J Neurophysiol 70, 2470–2488. [DOI] [PubMed] [Google Scholar]
- Galea V (2001). Electrical characteristics of human ankle dorsi‐ and plantar‐flexor muscles. Comparative responses during fatiguing stimulation and recovery. Eur J Appl Physiol 85, 130–140. [DOI] [PubMed] [Google Scholar]
- Hasson CJ, Caldwell GE & Van Emmerik RE (2009). Scaling of plantarflexor muscle activity and postural time‐to‐contact in response to upper‐body perturbations in young and older adults. Exp Brain Res 196, 413–427. [DOI] [PubMed] [Google Scholar]
- Hasson CJ, Miller RH & Caldwell GE (2011). Contractile and elastic ankle joint muscular properties in young and older adults. PLoS ONE 6, e15953. [DOI] [PMC free article] [PubMed] [Google Scholar]
- He JP, Levine WS & Loeb GE (1991). Feedback gains for correcting small perturbations to standing posture. IEEE T Automat Contr 36, 322–332. [Google Scholar]
- Heckman CJ & Binder MD (1991). Computer simulation of the steady‐state input‐output function of the cat medial gastrocnemius motoneuron pool. J Neurophysiol 65, 952–967. [DOI] [PubMed] [Google Scholar]
- Hepple RT, Hagen JL, Krause DJ & Baker DJ (2004). Skeletal muscle aging in F344BN F1‐hybrid rats: II. Improved contractile economy in senescence helps compensate for reduced ATP‐generating capacity. J Gerontol A Biol Sci Med Sci 59, 1111–1119. [DOI] [PubMed] [Google Scholar]
- Hill AV (1929). Anaerobic and aerobic activity in isolated muscle. Proceedings of the Royal Society of London. Series B, Containing Papers of a Biological Character 105, 313–322. [Google Scholar]
- Hunter SK, Thompson MW, Ruell PA, Harmer AR, Thom JM, Gwinn TH & Adams RD (1999). Human skeletal sarcoplasmic reticulum Ca2+ uptake and muscle function with aging and strength training. J Appl Physiol 86, 1858–1865. [DOI] [PubMed] [Google Scholar]
- Huxley HE (1971). Structural changes during muscle contraction. Biochem J 125, 85P. [DOI] [PMC free article] [PubMed] [Google Scholar]
- Jakobsson F, Borg K & Edström L (1990). Fiber‐type composition, structure and cytoskeletal protein location of fibers in anterior tibial muscle. Comparison between young adults and physically active aged humans. Acta Neuropathol 80, 459–468. [DOI] [PubMed] [Google Scholar]
- Kamen G, Sison SV, Du CC & Patten C (1995). Motor unit discharge behavior in older adults during maximal‐effort contractions. J Appl Physiol 79, 1908–1913. [DOI] [PubMed] [Google Scholar]
- Kemp GJ, Thompson CH, Taylor DJ & Radda GK (1997). Proton efflux in human skeletal muscle during recovery from exercise. Eur J Appl Physiol Occup Physiol 76, 462–471. [DOI] [PubMed] [Google Scholar]
- Kent‐Braun JA (1999). Central and peripheral contributions to muscle fatigue in humans during sustained maximal effort. Eur J Appl Physiol Occup Physiol 80, 57–63. [DOI] [PubMed] [Google Scholar]
- Kent‐Braun JA, Ng AV, Doyle JW & Towse TF (2002). Human skeletal muscle responses vary with age and gender during fatigue due to incremental isometric exercise. J Appl Physiol 93, 1813–1823. [DOI] [PubMed] [Google Scholar]
- Lamboley CR, Wyckelsma VL, Dutka TL, McKenna MJ, Murphy RM & Lamb GD (2015). Contractile properties and sarcoplasmic reticulum calcium content in type I and type II skeletal muscle fibres in active aged humans. J Physiol 593, 2499–2514. [DOI] [PMC free article] [PubMed] [Google Scholar]
- Lanza IR, Befroy DE & Kent‐Braun JA (2005). Age‐related changes in ATP‐producing pathways in human skeletal muscle in vivo. J Appl Physiol 99, 1736–1744. [DOI] [PubMed] [Google Scholar]
- Lanza IR, Larsen RG & Kent‐Braun JA (2007). Effects of old age on human skeletal muscle energetics during fatiguing contractions with and without blood flow. J Physiol 583, 1093–1105. [DOI] [PMC free article] [PubMed] [Google Scholar]
- Lanza IR, Wigmore DM, Befroy DE & Kent‐Braun JA (2006). In vivo ATP production during free‐flow and ischaemic muscle contractions in humans. J Physiol 577, 353–367. [DOI] [PMC free article] [PubMed] [Google Scholar]
- Larsen RG, Callahan DM, Foulis SA & Kent‐Braun JA (2009). In vivo oxidative capacity varies with muscle and training status in young adults. J Appl Physiol 107, 873–879. [DOI] [PMC free article] [PubMed] [Google Scholar]
- Larsson L, Li X, Yu F & Degens H (1997). Age‐related changes in contractile properties and expression of myosin isoforms in single skeletal muscle cells. Muscle Nerve Suppl 5, S74–S78. [PubMed] [Google Scholar]
- Larsson L & Salviati G (1989). Effects of age on calcium transport activity of sarcoplasmic reticulum in fast‐ and slow‐twitch rat muscle fibres. J Physiol 419, 253–264. [DOI] [PMC free article] [PubMed] [Google Scholar]
- Lee JA & Allen DG (1991). Mechanisms of acute ischemic contractile failure of the heart. Role of intracellular calcium. J Clin Invest 88, 361–367. [DOI] [PMC free article] [PubMed] [Google Scholar]
- Levin O & Mizrahi J (1999). EMG and metabolite‐based prediction of force in paralyzed quadriceps muscle under interrupted stimulation. IEEE Trans Rehabil Eng 7, 301–314. [DOI] [PubMed] [Google Scholar]
- Mademli L & Arampatzis A (2008. a). Effect of voluntary activation on age‐related muscle fatigue resistance. J Biomech 41, 1229–1235. [DOI] [PubMed] [Google Scholar]
- Mademli L & Arampatzis A (2008. b). Mechanical and morphological properties of the triceps surae muscle–tendon unit in old and young adults and their interaction with a submaximal fatiguing contraction. J Electromyogr Kinesiol 18, 89–98. [DOI] [PubMed] [Google Scholar]
- Miller RG, Boska MD, Moussavi RS, Carson PJ & Weiner MW (1988). 31P Nuclear magnetic resonance studies of high energy phosphates and pH in human muscle fatigue. Comparison of aerobic and anaerobic exercise. J Clin Invest 81, 1190–1196. [DOI] [PMC free article] [PubMed] [Google Scholar]
- Mordhorst M, Heidlauf T & Röhrle O (2015). Predicting electromyographic signals under realistic conditions using a multiscale chemo‐electro‐mechanical finite element model. Interface Focus 5, 20140076. [DOI] [PMC free article] [PubMed] [Google Scholar]
- Nakagawa Y, Ratkevicius A, Mizuno M & Quistorff B (2005). ATP economy of force maintenance in human tibialis anterior muscle. Med Sci Sports Exerc 37, 937–943. [PubMed] [Google Scholar]
- Narici M, Bordini M & Cerretelli P (1993). Fatigue paradox in the elderly In Neuromuscular Fatigue, ed. Sargeant A. & Kernell D, pp. 71 Royal Netherlands Academy of Arts and Sciences, Amsterdam. [Google Scholar]
- Narici MV, Bordini M & Cerretelli P (1991). Effect of aging on human adductor pollicis muscle function. J Appl Physiol 71, 1277–1281. [DOI] [PubMed] [Google Scholar]
- Nelson CR, Debold EP & Fitts RH (2014). Phosphate and acidosis act synergistically to depress peak power in rat muscle fibers. Am J Physiol Cell Physiol 307, C939–C950. [DOI] [PMC free article] [PubMed] [Google Scholar]
- Ng AV & Kent‐Braun JA (1999). Slowed muscle contractile properties are not associated with a decreased EMG/force relationship in older humans. J Gerontol A Biol Sci Med Sci 54, B452–B458. [DOI] [PubMed] [Google Scholar]
- Nosek TM, Fender KY & Godt RE (1987). It is diprotonated inorganic phosphate that depresses force in skinned skeletal muscle fibers. Science 236, 191–193. [DOI] [PubMed] [Google Scholar]
- Ochala J, Frontera WR, Dorer DJ, Van Hoecke J & Krivickas LS (2007). Single skeletal muscle fiber elastic and contractile characteristics in young and older men. J Gerontol A Biol Sci Med Sci 62, 375–381. [DOI] [PubMed] [Google Scholar]
- Parkhouse WS, McKenzie DC, Hochachka PW & Ovalle WK (1985). Buffering capacity of deproteinized human vastus lateralis muscle. J Appl Physiol 58, 14–17. [DOI] [PubMed] [Google Scholar]
- Quistorff B, Johansen L & Sahlin K (1993). Absence of phosphocreatine resynthesis in human calf muscle during ischaemic recovery. Biochem J 291, 681–686. [DOI] [PMC free article] [PubMed] [Google Scholar]
- Ren JM, Chasiotis D, Bergström M & Hultman E (1988). Skeletal muscle glucolysis, glycogenolysis and glycogen phosphorylase during electrical stimulation in man. Acta Physiol Scand 133, 101–107. [DOI] [PubMed] [Google Scholar]
- Rico‐Sanz J (2003). Progressive decrease of intramyocellular accumulation of H+ and Pi in human skeletal muscle during repeated isotonic exercise. Am J Physiol Cell Physiol 284, C1490–C1496. [DOI] [PubMed] [Google Scholar]
- Rohmert W (1960). [On the theory of recovery pauses in dynamic work]. Int Z Angew Physiol 18, 191–212. [PubMed] [Google Scholar]
- Röhrle O, Davidson JB & Pullan AJ (2012). A physiologically based, multi‐scale model of skeletal muscle structure and function. Front Physiol 3, 358. [DOI] [PMC free article] [PubMed] [Google Scholar]
- Rubinstein S & Kamen G (2005). Decreases in motor unit firing rate during sustained maximal‐effort contractions in young and older adults. J Electromyogr Kinesiol 15, 536–543. [DOI] [PubMed] [Google Scholar]
- Russ DW, Wills AM, Boyd IM & Krause J (2014). Weakness, SR function and stress in gastrocnemius muscles of aged male rats. Exp Gerontol 50, 40–44. [DOI] [PubMed] [Google Scholar]
- Shorten PR, O'Callaghan P, Davidson JB & Soboleva TK (2007). A mathematical model of fatigue in skeletal muscle force contraction. J Muscle Res Cell Motil 28, 293–313. [DOI] [PubMed] [Google Scholar]
- Sirikul B, Hunter GR, Larson‐Meyer DE, Desmond R & Newcomer BR (2007). Relationship between metabolic function and skeletal muscle fatigue during a 90 s maximal isometric contraction. Appl Physiol Nutr Metab 32, 394–399. [DOI] [PubMed] [Google Scholar]
- Stackhouse SK, Stevens JE, Lee SC, Pearce KM, Snyder‐Mackler L & Binder‐Macleod SA (2001). Maximum voluntary activation in nonfatigued and fatigued muscle of young and elderly individuals. Phys Ther 81, 1102–1109. [PubMed] [Google Scholar]
- Stephenson DG & Williams DA (1981). Calcium‐activated force responses in fast‐ and slow‐twitch skinned muscle fibres of the rat at different temperatures. J Physiol 317, 281–302. [DOI] [PMC free article] [PubMed] [Google Scholar]
- Taylor JL, Allen GM, Butler JE & Gandevia SC (2000). Supraspinal fatigue during intermittent maximal voluntary contractions of the human elbow flexors. J Appl Physiol 89, 305–313. [DOI] [PubMed] [Google Scholar]
- Tevald MA, Foulis SA, Lanza IR & Kent‐Braun JA (2010). Lower energy cost of skeletal muscle contractions in older humans. Am J Physiol Regul Integr Comp Physiol 298, R729–R739. [DOI] [PMC free article] [PubMed] [Google Scholar]
- Thelen DG (2003). Adjustment of muscle mechanics model parameters to simulate dynamic contractions in older adults. J Biomech Eng 125, 70–77. [DOI] [PubMed] [Google Scholar]
- van den Broek NM, De Feyter HM, de Graaf L, Nicolay K & Prompers JJ (2007). Intersubject differences in the effect of acidosis on phosphocreatine recovery kinetics in muscle after exercise are due to differences in proton efflux rates. Am J Physiol Cell Physiol 293, C228–C237. [DOI] [PubMed] [Google Scholar]
- Weisleder N, Brotto M, Komazaki S, Pan Z, Zhao X, Nosek T, Parness J, Takeshima H & Ma J (2006). Muscle aging is associated with compromised Ca2+ spark signaling and segregated intracellular Ca2+ release. J Cell Biol 174, 639–645. [DOI] [PMC free article] [PubMed] [Google Scholar]
- Wilson JR, McCully KK, Mancini DM, Boden B & Chance B (1988). Relationship of muscular fatigue to pH and diprotonated Pi in humans: a 31P‐NMR study. J Appl Physiol 64, 2333–2339. [DOI] [PubMed] [Google Scholar]
- Xia T & Frey Law LA (2008). A theoretical approach for modeling peripheral muscle fatigue and recovery. J Biomech 41, 3046–3052. [DOI] [PubMed] [Google Scholar]