

Abstract
Key points
Reductions in cerebral blood flow (CBF) may be implicated in the development of neuromuscular fatigue; however, the contribution from hypocapnic‐induced reductions (i.e. ) in CBF versus reductions in CBF per se has yet to be isolated.
We assessed neuromuscular function while using indomethacin to selectively reduce CBF without changes in and controlled hyperventilation‐induced hypocapnia to reduce both CBF and .
Increased corticospinal excitability appears to be exclusive to reductions in but not reductions in CBF, whereas sub‐optimal voluntary output from the motor cortex is moderately associated with decreased CBF independent of changes in .
These findings suggest that changes in CBF and have distinct roles in modulating neuromuscular function.
Abstract
Although reductions in cerebral blood flow (CBF) may be involved in central fatigue, the contribution from hypocapnia‐induced reductions in CBF versus reductions in CBF per se has not been isolated. This study examined whether reduced arterial (), independent of concomitant reductions in CBF, impairs neuromuscular function. Neuromuscular function, as indicated by motor‐evoked potentials (MEPs), maximal M‐wave (M max) and cortical voluntary activation (cVA) of the flexor carpi radialis muscle during isometric wrist flexion, was assessed in ten males (29 ± 10 years) during three separate conditions: (1) cyclooxygenase inhibition using indomethacin (Indomethacin, 1.2 mg kg−1) to selectively reduce CBF by 28.8 ± 10.3% (estimated using transcranial Doppler ultrasound) without changes in end‐tidal (); (2) controlled iso‐oxic hyperventilation‐induced reductions in (Hypocapnia), = 30.1 ± 4.5 mmHg with related reductions in CBF (21.7 ± 6.3%); and (3) isocapnic hyperventilation (Isocapnia) to examine the potential direct influence of hyperventilation‐mediated activation of respiratory control centres on CBF and changes in neuromuscular function. Change in MEP amplitude (%M max) from baseline was greater in Hypocapnia tha in Isocapnia (11.7 ± 9.8%, 95% confidence interval (CI) [2.6, 20.7], P = 0.01) and Indomethacin (13.3 ± 11.3%, 95% CI [2.8, 23.7], P = 0.01) with a large Cohen's effect size (d ≥ 1.17). Although not statistically significant, cVA was reduced with a moderate effect size in Indomethacin (d = 0.7) and Hypocapnia (d = 0.9) compared to Isocapnia. In summary, increased corticospinal excitability – as reflected by larger MEP amplitude – appears to be exclusive to reduced , but not reductions in CBF per se. Sub‐optimal voluntary output from the motor cortex is moderately associated with decreased CBF, independent of reduced .
Key points
Reductions in cerebral blood flow (CBF) may be implicated in the development of neuromuscular fatigue; however, the contribution from hypocapnic‐induced reductions (i.e. ) in CBF versus reductions in CBF per se has yet to be isolated.
We assessed neuromuscular function while using indomethacin to selectively reduce CBF without changes in and controlled hyperventilation‐induced hypocapnia to reduce both CBF and .
Increased corticospinal excitability appears to be exclusive to reductions in but not reductions in CBF, whereas sub‐optimal voluntary output from the motor cortex is moderately associated with decreased CBF independent of changes in .
These findings suggest that changes in CBF and have distinct roles in modulating neuromuscular function.
Abbreviations
- CBF
cerebral blood flow
- cSP
cortical silent period
- cVA
cortical voluntary activation
- EMG
electromyography
- MCAv
middle cerebral artery velocity
- MEP
motor evoked potential
- MVC
maximal voluntary contraction
- Mmax
maximal M‐wave
arterial partial pressure of carbon dioxide
end‐tidal partial pressure of carbon dioxide
end‐tidal partial pressure of oxygen
- pVA
peripheral voluntary activation
- RRTMS
maximal relaxation rate from transcranial magnetic stimulation
- RRTw,Pot
maximal relaxation rate of the potentiated twitch
- TCD
transcranial Doppler
- TMS
transcranial magnetic stimulation
inspired flow rate
Introduction
Neuromuscular fatigue is defined as the inability of a muscle or group of muscles to maintain a given level of force (Bigland‐Ritchie & Woods 1984; Gandevia 2001). It can be attributed to many factors, ranging from changes in cortical excitability to excitation–contraction coupling in the muscle tissue itself (Taylor & Gandevia 2001). Recent research suggests that central mechanisms of fatigue may predominate during dynamic exercise (Amann et al. 2006, 2007) and isolated isometric muscle contractions (Millet et al. 2009, 2012), and may be attributed in part to a reduction in cerebral blood flow (CBF) (Nybo & Nielsen 2001; Nybo & Rasmussen 2007; Secher et al. 2008).
Since Nybo and Nielsen (2001) first reported the association between reductions in CBF and impaired performance during prolonged exercise in the heat, research has examined the influence of decreased arterial (), circulatory stress (Ide & Secher 2000) and inadequate cerebral oxygen delivery (Nybo & Rasmussen 2007; Rasmussen et al. 2007) as associated mechanisms contributing to fatigue. Rasmussen et al. (2010) suggested that impaired mitochondrial oxygen tension caused by inadequate CBF may compromise motor cortical output; however, the functional significance of reduced CBF and neuromuscular fatigue has yet to be investigated systematically in detail. Recently, Ross et al. (2012) indicated that the failure of voluntary motor drive during passive heat stress was related to reductions in CBF, which were mediated via hyperventilation‐induced reductions in . In their study, it is interesting to note that, at the point of thermal intolerance, the restoration of the partial pressure of end‐tidal CO2 () towards baseline values restored decrements in voluntary drive despite CBF remaining below baseline levels. These findings are consistent with the view that reductions in may independently impact motor drive and provide an important influence on neuromuscular fatigue.
Decreases in have a profound effect on the neuromuscular system, ranging from the motor axons (Macefield & Burke 1991; Mogyoros et al. 1997) to the motor cortex (Kong et al. 1994; Kukumberg et al. 1996; Seyal et al. 1998; Dulla et al. 2005; Sparing et al. 2007). Hyperventilation‐induced reductions in are associated with the clinical presentation of tetany and paraesthesia, and are linked to spontaneous action potentials (Kong et al. 1994). At the peripheral level, an inverse relationship is observed between and maximal M‐wave (M max) amplitude, presumably due in part to a reduction in plasma calcium concentration (Macefield & Burke 1991). In the CNS, neuronal cells in the hippocampus increase in excitability during conditions of reduced (Dulla et al. 2005). Similarly, reductions in have been shown to increase corticospinal excitability, causing increased amplitude of the motor evoked potential (MEP) and a shortening of the MEP onset latency (Kong et al. 1994; Seyal et al. 1998); however, these findings are not universally accepted (Priori et al. 1995), probably due in part to methodological differences.
Hyperventilation may modulate both the cerebral vasculature and the neuromuscular system independent of changes in . For example, Neubauer et al. (1983) reported a modest increase in total CBF (12%) following isocapnic hyperventilation, induced by carotid sinus nerve stimulation in anaesthetised cats. It was hypothesised that the increase in metabolic activity of the medulla during hyperventilation causes the release of metabolites that mediate local cerebral vasodilatation. Hayen et al. (2013) reported a 4% increase in CBF in response to negative intrathoracic pressures observed during large alterations in tidal volume. Similarly, hyperventilation may be associated with factors, such as an external focus of attention or the perception of effort (Neubauer et al. 1983; Sparing et al. 2007; Ruge et al. 2014), that have an excitatory effect on the motor cortex (Ruge et al. 2014).
Given the functional association between the cerebral vasculature and , the question of primary interest is whether impaired neuromuscular function is specifically mediated by reductions in CBF or preceding reductions in . Therefore, the purpose of this study was to examine the effects of reductions in CBF with and without reduced on neuromuscular function. It was hypothesised that reductions in , independent of changes in CBF, would have a significant role in mediating changes in neuromuscular function.
Methods
Ethical Approval
The experimental protocol and procedures were approved by the Bioscience Research Ethics Board at Brock University (BREB 12–167), and conformed to the latest revision of the Declaration of Helsinki. After an explanation of the experimental procedures and associated risks, all participants provided written informed consent and were screened by a physician.
Participants
Ten healthy male volunteers, who were free from cardiovascular, respiratory and neurological disorders, were recruited from the university and local community. The mean (±SD) age, height, mass and body mass index were 29 ± 10 years, 1.78 ± 0.06 m, 70.7 ± 7.6 kg and 22.2 ± 1.3 kg m−2, respectively.
Experimental Design
Participants were given the opportunity to practise experimental protocols and acquaint themselves with the apparatus during a familiarisation session. Subsequently, participants reported to the laboratory on three separate occasions and were asked to abstain from strenuous exercise and the consumption of alcohol for 24 h and caffeine for 12 h prior to each session. To ensure sufficient recovery from the experimental protocol, sessions were separated by a minimum of 48 h. In a repeated‐measures design, baseline and experimental measures were collected in the following conditions in this order: (1) cyclooxygenase inhibition via oral indomethacin (Indomethacin; 1.2 mg kg−1) administration to selectively reduce CBF (28.8 ± 10.3%) without altering ventilation or arterial blood gases (Fan et al. 2011); (2) controlled hyperventilation (Hypocapnia) to reduce CBF by a comparable extent as condition 1 in the presence of reductions in ( = 30.1 ± 4.5 mmHg); and (3) isocapnic hyperventilation (Isocapnia) to selectively induce hyperventilation without changing or CBF. The Isocapnia condition was performed to examine possible confounds associated with hyperventilation and potential activation of the CNS respiratory control centres (Neubauer et al. 1983). Each condition was presented in a non‐randomised order such that the breathing frequency (f br) utilised in Hypocapnia induced a similar reduction in CBF observed during Indomethacin; the f br utilised during Isocapnia was similar to Hypocapnia.
Indomethacin condition (Indomethacin)
To reduce CBF independent of , participants ingested a 1.2 mg kg−1 dose of indomethacin along with 150 mg of ranitidine to reduce the possibility of gastrointestinal irritation. Participants then rested quietly in the laboratory for 90 min to allow for drug concentrations to peak within the bloodstream (Xie et al. 2006). Indomethacin is a reversible and well‐tolerated cyclooxygenase inhibitor that blunts the prostanoid‐mediated dilatation of the cerebral vasculature, decreasing CBF (Parfenova et al. 1995) without concomitant changes in cerebral metabolic rate (Hohimer et al. 1985; Kraaier et al. 1992) or plasma catecholamines (Staessen et al. 1984; Wennmalm et al. 1984; Green et al. 1987). Additionally, evidence suggests that indomethacin reduces cerebrovascular reactivity to CO2, causing enhanced central chemoreceptor activation (Xie et al. 2006; Fan et al. 2011) with little effect on the peripheral chemoreflex (Fan et al. 2011; Hoiland et al. 2015). Consequently, indomethacin has been used successfully to investigate changes in CBF independent of changes in (Ainslie & Duffin 2009).
Controlled hyperventilation condition (Hypocapnia)
To reduce and hence CBF, participants performed a controlled hyperventilation protocol in which they were instructed to breathe in synchrony with a metronome. The rate of the metronome was adjusted such that the hyperventilation‐induced reduction in CBF was of similar magnitude to that observed during the Indomethacin trial. Dynamic end‐tidal forcing (for more details, refer to the following section) was used to clamp end‐tidal partial pressure of oxygen at iso‐oxia (defined as the mean during the 5 min baseline period).
Isocapnic hyperventilation condition (Isocapnia)
To examine the potential direct influence of hyperventilation‐mediated activation of the CNS respiratory control centres on CBF (Neubauer et al. 1983) and changes in corticospinal excitability (Sparing et al. 2007), participants breathed in synchrony with a metronome set at a rate identical to that of the Hypocapnia condition, while dynamic end‐tidal forcing (for more details, refer to the following section) was used to clamp at eucapnia (defined as the mean during the 5 min baseline period).
Measurements
Respiratory measurements and dynamic end‐tidal forcing
Participants breathed through a mouthpiece attached to a T‐shaped two‐way non‐rebreathing valve (2700, Hans Rudolph, Inc., Shawnee Mission, KS). Inspired flow rate () was measured using a pneumotach (3813, Hans Rudolph) while inspired and expired fractions of O2 and CO2 were sampled at a flow rate of 200 ml min−1 and analysed in real time using a gas analyser (ML206, AD Instruments, Colorado Springs, CO, USA). The and were clamped using a custom end‐tidal forcing system designed by one of the co‐authors (G.L.H.). Using solenoid values to independently control gas flow from cylinders of compressed medical grade breathing air (21% O2, 0.03% CO2, balance N2), 100% N2 and 100% CO2, inspired air volumes were delivered to an air reservoir (∼5 litres) via a humidification chamber (∼500 ml). Inspired air volumes and gas fractions were determined using an algorithm (Koehle et al. 2009) incorporating tidal volume, and error (i.e. the difference between desired and measured end‐tidal partial pressures) to ‘force’ and towards the desired values. Expired air was collected in a ∼2 litres air reservoir, and was vented from the system using a low resistance one‐way valve. In the event that the air volume in the inspired reservoir was lower than tidal volume, the negative pressure (created by the complete emptying of the inspired reservoir) would cause a high resistance one‐way valve connecting the expired reservoir to open, allowing the participant to re‐breathe expired air. Re‐breathing prevents excessive fluctuations in and values, while ensuring that the inspired air volume is sufficient during situations of irregular tidal volume.
Cerebro‐ and cardiovascular measurements
Bi‐lateral middle cerebral artery velocity (MCAv) was assessed using a 2 MHz pulsed transcranial Doppler ultrasound (TCD) system (Doppler‐Box, Compumedics GmbH, Singen, Germany). The probes were positioned over the temporal window and were held in place using a secure and comfortable head frame (M600 Headframe, Spencer Technologies, Seattle, WA, USA). TCD signals were identified and optimised using techniques described by Willie et al. (2011). Heart rate (HR) was measured using a three lead electrocardiogram (MLA2340, AD Instruments) and non‐invasive measurement of oxygen saturation was measured using a pulse oximetry (ML320/F, AD Instruments) device placed on the left ring finger. Beat‐to‐beat blood pressure was measured by finger photoplethysmography (Nexfin, Bmeye, Amsterdam, Netherlands) and was normalised during the data analysis to two repeated manual sphygmomanometer measurements of the brachial artery. All respiratory, cerebrovascular and cardiovascular data were acquired continuously at 1 kHz (PowerLab 16/30, AD Instruments).
Electromyography (EMG) and torque measurements
Electromyography activity of the flexor carpi radialis muscle was measured using surface electrodes (Hush™ Disk Electrodes, Natus Medical Inc., San Carlos, CA, USA). To ensure low impedance values (<5 MΩ), the skin surface was shaved and abraded with electrolyte gel (Nuprep, Weaver and Company, Aurora, CO, USA) then cleansed with isopropyl alcohol. The motor point of the flexor carpi radialis was located by applying a low‐intensity electrical stimulus to the muscle. The point that elicited the largest EMG response at the lowest stimulation intensity was identified as the motor point. The recording electrode was placed over this motor point and the reference electrode was placed 10 mm distal to the recording electrode in a bipolar configuration. A 100 mm circular self‐adhesive ground electrode (Dermatrode, Delsys, Boston, MA, USA) was placed over the olecranon process. EMG signals were band‐pass filtered between 10 and 2000 Hz acquired at a sampling rate of 3 kHz using an analog to digital converter (KeyPoint G4, Dantec, Denmark) and analysed offline (MATLAB 2012b, MathWorks, Natick, MA, USA). Participants were positioned with their forearm in a custom made apparatus (hip and elbow joint angle ∼ 135 deg) designed to isolate isometric forearm flexion of the wrist. A non‐compliant cuff was placed around the participant's forearm, approximately 10 cm proximal to the styloid processes, and the carpal to distal phalanges of the right hand were placed between two aluminium plates. These plates were affixed tangentially to a calibrated load cell and the forearm was positioned such that the styloid process was aligned with the axis of rotation. Torque measurements were acquired using an analog to digital converter at a sampling rate of 3 kHz (LabView 2010, National Instruments, Austin, TX, USA) and analysed offline (MATLAB 2012b).
Motor cortex stimulation
Stimulation of the motor cortex was achieved using transcranial magnetic stimulation (TMS) with a 70 mm figure‐of‐eight coil (Magstim Rapid2, Whitland, Wales, UK). Initially, the cortical site for optimal activation of the flexor carpi radialis was systematically identified using repeated stimulations (separated by ∼ 10 s) at different locations of the scalp until the largest amplitude MEP was recorded. In all cases, the optimal site of activation was ∼3–5 cm contralateral to the vertex, 45 deg relative to the sagittal plane and marked on the silicone swim cap used to cover the participant's scalp, allowing for easy identification and slight adhesion to the coil. The resting motor threshold was estimated by constructing a stimulus response curve, consisting of four TMS stimuli every 10 s at each 5% increment, ranging from 35 to 90% of stimulator output. The resultant data were fitted with a sigmoidal curve of best fit, and solved to determine the stimulator output intensity (%) required to produce an MEP with peak‐to‐peak amplitude of 50 μV (Carroll et al. 2001). The resultant motor threshold was 70 ± 3% and the intensity for subsequent stimulation was delivered at 1.3× motor threshold (91 ± 8%). The maximum within‐trial error was calculated at ∼10% for MEP responses.
Peripheral motor nerve stimulation
A compound M‐wave was evoked using a handheld probe with anode and cathode (inter‐electrode distance of 2 cm) in series, placed in the bicipital groove and proximal to the cubital space (cathode distal to the anode). The anode and cathode were attached to a constant current stimulator (KeyPoint G4, Dantec) that delivered a square wave pulse of 2 ms duration. The median nerve was stimulated at 0.5 mA increments once every 10 s, ranging from 5 mA until reaching a plateau in the peak‐to‐peak M‐wave amplitude (i.e. M max). To ensure a supramaximal response, subsequent motor nerve stimulation was delivered at 1.3× M max. The maximum within‐trial error was calculated as ∼2% for M max responses. M max is representative of maximal EMG in response to activation of the entire motor neuron pool.
Indices of neuromuscular function
A schematic outlining the neuromuscular measurements and corresponding analyses is displayed in Fig. 1. Maximal voluntary contraction (MVC) torque was quantified as the mean torque over a 100 ms epoch immediately prior to TMS during the cortical voluntary activation (cVA) protocol (Fig. 2); the maximum torque value was selected for analysis.
Figure 1. Schematic outlining the neuromuscular measurements and corresponding analyses .
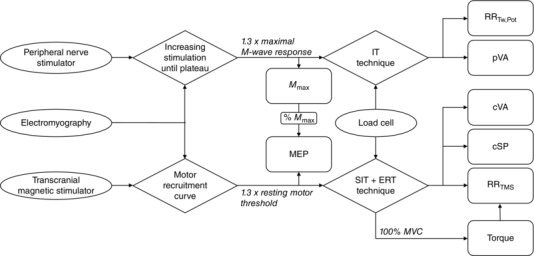
Ovals represent measurement apparatus, diamonds represent experimental protocols and squares represent outcome variables. M max, maximal M‐wave; MEP, motor‐evoked potential; IT, interpolated twitch; SIT, superimposed twitch; ERT, estimated resting twitch; MVC, maximal voluntary contraction; RRTw,Pot, maximal relaxation rate of the potentiated twitch; pVA, peripheral voluntary activation; cVA, cortical voluntary activation; cSP, cortical silent period; RRTMS, maximal relaxation rate of the superimposed TMS.
Figure 2. Torque increments and estimated resting twitch .
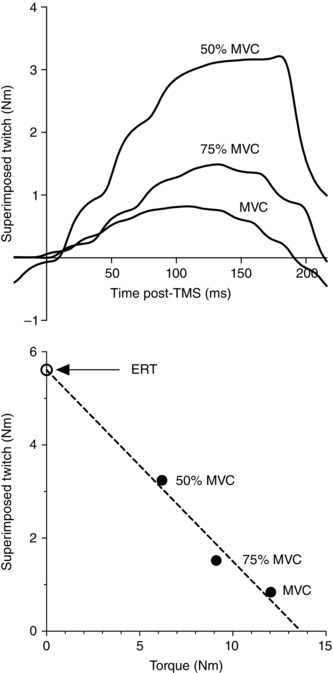
Representative data illustrating (A) torque increments caused by superimposed TMS during MVC, 50% MVC and 75% MVC, and (B) interpolation of estimated resting twitch. MVC, maximal voluntary contraction; ERT, estimated resting twitch.
Peripheral neuromuscular function indices
M max was calculated as the mean peak‐to‐peak amplitude of the EMG response to six consecutive supra‐maximal stimulations of the peripheral motor nerve (see Peripheral motor nerve stimulation above). The maximum relaxation rate of the potentiated twitch (RRTw,Pot) elicited using peripheral nerve stimulation and superimposed twitch response following TMS (RRTMS) were calculated as the steepest rate of decline in force production following stimulation during the peripheral voluntary activation (pVA) and cVA protocols, respectively (Fig. 2). RRTMS was normalised to total torque during the contraction (i.e. product of the voluntary contraction and interpolated twitch). Both RRTw,Pot and RRTMS are indicative of changes in peripheral neuromuscular function (Todd et al. 2005).
Cortical‐spinal indices
Peak‐to‐peak MEP amplitude was normalised to M max to reflect the changes in corticospinal excitability independent of potential changes in muscle fibre action potentials (Gandevia et al. 1999). The cortical silent period (cSP) is representative of cortical inhibition and was analysed using validated procedures (Julkunen et al. 2013) following TMS during the cVA protocol.
Voluntary activation indices
cVA was quantified using the twitch interpolation technique in which the torque response to TMS was examined during a series of submaximal and maximal voluntary contractions. cVA was quantified using the equation (Todd et al. 2003):
where SIT represents the superimposed twitch elicited by TMS (MEP = 82 ± 15% M max) during an MVC and ERT represents the estimated resting twitch response. Due to increased cortical and spinal excitability induced by muscular activity, ERT was estimated by determining the y‐intercept of the linear regression between the superimposed twitch amplitude and voluntary torque during MVC, 50% MVC and 75% MVC (Fig. 2). Similarly, pVA was quantified using the interpolated twitch technique in which the torque increment elicited by peripheral motor nerve stimulation was examined. pVA was quantified using the flowing equation (Merton 1954):
where SIT represents the superimposed twitch elicited by peripheral motor nerve stimulation and Q Tw,pot represents the potentiated twitch elicited ∼1 s following MVC. Both cVA and pVA represent the percentage of motor units voluntarily activated by the CNS during maximal contractions; however, cVA assesses the mechanisms distal to the motor cortex, whereas pVA is restricted to mechanisms distal to the site of electrical stimulation (i.e. the peripheral motor nerve).
Experimental Protocol
Upon arrival to the laboratory, participants’ height and mass were measured using standard laboratory equipment. Participants were positioned in a semi‐recumbent position on an examination table with their back through neck supported by a backrest and their right forearm supported on a side table (hip and elbow angle ∼135 deg). Following instrumentation (∼20 min), participants rested quietly prior to data collection.
The experimental protocol is illustrated in Fig. 3. Initial baseline respiratory, cerebrovascular and cardiovascular measurements were collected over a period of 5 min, followed by baseline neuromuscular measurements (∼15 min). The neuromuscular testing consisted of eliciting six M max and six MEP responses, each separated by 10–12 s (the timing between stimulation was randomised to minimise any confounds of a participant anticipating the stimulus). Subsequently, participants performed three sets of voluntary isometric contractions; each contraction was 3 s in duration and consisted of an MVC, followed by a 50% MVC and a 75% MVC. Participants viewed a monitor that displayed the target torque for submaximal contractions (i.e. 50% MVC and 75% MVC), with the target calculated as a percentage of the previous MVC. Throughout each contraction, single‐pulse TMS was delivered to the motor cortex during a period of stable torque production (approximately 1 s following contraction onset) and each contraction was separated by 10 s. Participants then performed three MVCs, each separated by 10 s. For each MVC, peripheral nerve stimulation was used to elicit a superimposed twitch during a period of stable torque production (approximately 1 s following contraction onset) and a potentiated twitch approximately 1 s following each contraction. Following baseline, the experimental intervention was initiated (either Indomethacin, Hypocapnia or Isocapnia). Once participants stabilised (90 min wash‐in for Indomethacin; approximately 5 min for Hypocapnia and Isocapnia), 5 min of respiratory, cerebrovascular and cardiovascular measurements were collected followed by the same neuromuscular testing protocol.
Figure 3. Schematic outlining the experimental protocol .
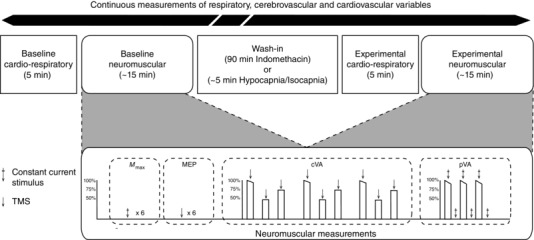
Initial baseline respiratory, cerebrovascular and cardiovascular measurements were collected over a period of 5 min, followed by baseline neuromuscular measurements (∼15 min). The neuromuscular testing (detailed in the dashed rectangle) consisted of eliciting six maximal M‐wave (M max) and six motor evoked potential (MEP) responses followed by the determination of cortical voluntary activation (cVA) and peripheral voluntary activation (pVA). Following baseline, the experimental intervention was initiated (either Indomethacin, Hypocapnia or Isocapnia). Once participants stabilised (90 min wash‐in for Indomethacin; ∼5 min for Hypocapnia and Isocapnia), 5 min of respiratory, cerebrovascular and cardiovascular measurements were collected followed by the same neuromuscular testing protocol. Respiratory, cerebrovascular and cardiovascular variables were measured continuously throughout the experiment. Arrow, TMS; arrow with cross, constant current stimulus.
Statistical Analysis
Normal distribution was confirmed upon visual inspection of the data by frequency distribution. Linear mixed model analyses were conducted to assess the change in respiratory, cerebrovascular, cardiovascular and neuromuscular variables in response to the experimental intervention (dependent variable), with fixed effects for conditions (three levels: Indomethacin, Hypocapnia and Isocapnia), and a random intercept. To adjust for potential differences in baseline measurements across conditions, baseline values were entered into the model as a covariate. Pairwise comparisons, using a Bonferroni correction, were used to identify main effects. Cohen's d effect sizes were calculated using the mean and standard deviation of the difference between conditions and interpreted using the following classification: d = 0.20–0.49 = small effect, d = 0.50–0.79 = moderate effect and d > 0.8 = large effect (Cohen 1988). All statistical analyses were conducted using SPSS 20 (SPSS Inc., Chicago, IL, USA). Data are given in the text as the difference from baseline between conditions (mean ± SD) and 95% confidence interval (CI), whereas data are presented in the tables as absolute values for baseline, experimental and change from baseline measurements (mean ± SD). Data are presented in the figures as individual baseline, experimental measurements with underlying bars representing mean values.
Results
Respiratory, cerebrovascular and cardiovascular responses
Respiratory, cerebrovascular and cardiovascular responses to the experimental conditions (expressed as absolute measurements) are presented in Table 1.
Table 1.
Baseline, experimental and change from baseline to experimental (Delta) cardio‐respiratory data during Indomethacin, Hypocapnia, and Isocapnia conditions
| Indomethacin | Hypocapnia | Isocapnia | |||||||
|---|---|---|---|---|---|---|---|---|---|
| Baseline | Experimental | Delta | Baseline | Experimental | Delta | Baseline | Experimental | Delta | |
| (mmHg) | 109.2 ± 6.9 | 107.3 ± 5.8 | 0.2 ± 0.3 | 110.5 ± 7.3 | 110.0 ± 9.8 | 0.8 ± 1.2 | 109.9 ± 6.7 | 106.0 ± 8.0 | −0.3 ± 1.0 |
| (mmHg) | 41.1 ± 4.2 | 40.6 ± 3.0 | −0.5 ± 3.0 | 41.6 ± 2.9 | 30.1 ± 4.5 | −11.5 ± 2.8 | 42.1 ± 3.2 | 46.3 ± 2.7 | −0.2 ± 1.3 |
| MCAv (cm s−1) | 61.2 ± 7.8 | 43.4 ± 8.1 | −17.7 ± 7.1 | 65.3 ± 9.6 | 50.9 ± 8.1 | −14.3 ± 4.8 | 62.1 ± 6.6 | 62.1 ± 5.8 | 0.0 ± 2.1 |
| f br (breaths min−1) | 14.2 ± 2.4 | 13.9 ± 2.2 | −0.3 ± 2.5 | 14.5 ± 2.8 | 20.5 ± 4.6 | 6.0 ± 4.7 | 13.9 ± 2.9 | 21.1 ± 5.2 | 7.2 ± 3.5 |
| (l min−1) | 8.8 ± 2.1 | 9.0 ± 1.4 | 0.2 ± 1.4 | 9.5 ± 1.4 | 17.1 ± 6.1 | 7.5 ± 5.2 | 9.5 ± 1.6 | 15.9 ± 1.4 | 6.4 ± 1.7 |
| HR (beats min−1) | 59 ± 6 | 51 ± 6 | −7.7 ± 3.8 | 58 ± 6 | 67 ± 10 | 9.1 ± 7.0 | 61 ± 8 | 64 ± 8 | 3.3 ± 4.1 |
| (%) | 97.5 ± 0.9 | 98.3 ± 0.7 | 0.7 ± 0.6 | 97.2 ± 2.1 | 98.7 ± 0.8 | 1.4 ± 2.2 | 97.1 ± 1.1 | 97.2 ± 1.0 | 0.1 ± 0.7 |
| MAP (mmHg) | 91 ± 8 | 96 ± 7 | 4.8 ± 9.4 | 93 ± 14 | 102 ± 13 | 9.1 ± 5.6 | 90 ± 10 | 97 ± 12 | 6.2 ± 3.8 |
, end‐tidal partial pressure of oxygen; , end‐tidal partial pressure of carbon dioxide; MCAv, MCA velocity; f br, breathing frequency, , inspired flow rate; HR, heart rate; , oxygen saturation; MAP, mean arterial pressure. Values are mean ± SD; n = 10 recordings.
Respiratory variables
Compared to Indomethacin, significant differences in change from baseline for f br (7.0 ± 4.7 breath min−1, 95% CI [3.9, 10.2], P < 0.01, d = 2.1; 7.5 ± 4.3 breath min−1, 95% CI [4.3, 10.7], P < 0.01, d = 2.5) and consequently, (7.5 ± 3.6 l min−1, 95% CI [3.0, 9.6], P < 0.01, d = 1.8; 6.1 ± 2.4 l min−1, 95% CI [4.0, 8.2], P < 0.01, d = 2.5) were observed during Hypocapnia and Isocapnia conditions, respectively. By design, the change from baseline in was greater during Hypocapnia than during Indomethacin (−11.0 ± 3.6 mmHg, 95% CI [−14.4, −7.7], P < 0.01, d = 3.1) and Isocapnia (−11.3 ± 4.2 mmHg, 95% CI [−14.7, −8.0], P < 0.01, d = 2.7). There were no significant differences in (all P ≥ 0.56) in response across all conditions.
Cerebro‐ and cardiovascular variables
The change from baseline in MCAv during both Indomethacin (−17.7 ± 7.1 cm s−1 or −28.8 ± 10.3%, 95% CI [−25.1, −10.4], P < 0.01, d = 2.2) and Hypocapnia (−14.3 ± 4.8 cm s−1 or −21.7 ± 6.3%, 95% CI [−9.9, 18.6], P < 0.01, d = 3.0) conditions were greater in comparison to Isocapnia. The change from baseline in HR was greater during Hypocapnia than during Indomethacin (16.9 ± 7.1 beats min−1, 95% CI [10.3, 23.5], P < 0.01, d = 2.4) and Isocapnia (5.9 ± 5.6 beats min−1, 95% CI [0.7, 11.1], P = 0.03, d = 1.1). There was no significant difference in MAP response across all conditions (all P ≥ 0.56).
Neuromuscular function
MVC
The change in torque production (Fig. 4 A) during MVC was similar across all conditions.
Figure 4. Neuromuscular response to Indomethacin, Hypocapnia, and Isocapnia .
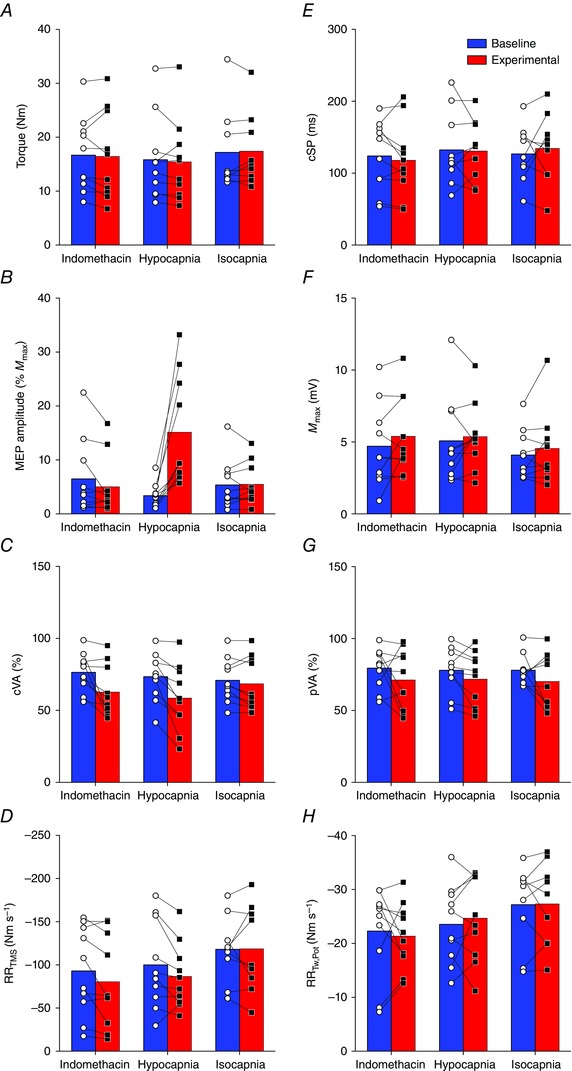
A, voluntary torque production; B, motor evoked potential (MEP) amplitude; C, cortical voluntary activation (cVA); D, maximal relaxation rate of the superimposed TMS (RRTMS); E, cortical silent period (cSP); F, maximal M‐wave (M max); G, peripheral voluntary activation (pVA); H, maximal relaxation rate of the potentiated twitch (RRTw,Pot). Connected pairs of open circles (○) and closed squares (▪) represent individual baseline and experimental data, respectively. Underlying bars represent mean values for baseline (blue) and experimental (red) measurements.
Responses to motor cortex stimulation
The change from baseline in peak to peak MEP amplitude (Fig. 4 B), expressed as a percentage of M max, was greater during the Hypocapnia condition than during Indomethacin (13.3 ± 11.3%, 95% CI [2.8, 23.7], P = 0.01, d = 1.17) and Isocapnia (11.7 ± 9.8%, 95% CI [2.6, 20.7], P = 0.01, d = 1.20). Conversely, the change in cVA (Fig. 4 C) from baseline was greater during both the Indomethacin (−11.3 ± 16.0%, 95% CI [−26.1, 3.6], P = 0.16, d = 0.7) and Hypocapnia (−12.5 ± 14.8%, 95% CI [−25.7, 0.7], P = 0.06, d = 0.9) conditions in comparison to Isocapnia. The change in RRTMS of the superimposed twitch (Fig. 4 D) and change in cortical silent period (cSP; Fig. 4 E) was similar across all conditions.
Responses to peripheral motor nerve stimulation
The change in peak to peak M max amplitude (Fig. 4 F), pVA (Fig. 4 G) and RRTw,Pot (Fig. 4 H) were similar across all conditions.
Discussion
The purpose of this study was to examine neuromuscular function in response to reductions in CBF with and without consequent changes in arterial CO2. It was hypothesised that reductions in , independent of changes in CBF, would mediate changes in neuromuscular function. The primary findings of this study were as follows: (1) increased corticospinal excitability (i.e. MEP amplitude) was associated with reductions in , independent of changes in CBF and the mechanical changes (such as increased tidal volume/respiratory rate) associated with hyperventilation; and (2) reductions in cVA were associated with reduced cerebral blood flow, independent of reduced .
Peripheral neuromuscular function
Reduced CBF and associated with controlled hyperventilation were not associated with significant changes within the muscle fibre itself. The amplitude of M max elicited by stimulation of the median nerve was unaffected across all conditions (Fig. 4 F), suggesting that neuromuscular propagation remained intact. These findings are consistent with data obtained (i.e. no change in M max amplitude) following highly selective cyclooxygenase‐2 inhibition using acetaminophen (Mauger & Hopker 2013) and extends this lack of peripheral response to indomethacin or any other non‐selective cyclooxygenase non‐steroidal anti‐inflammatory drug supplementation. Also consistent with our findings, previous research (Hilbert et al. 2012) indicates that hyperventilation‐induced reductions in ( 16 mmHg below baseline) have no effect on M max amplitude, despite significant reductions in arterial pH obtained via direct blood sampling.
In support of maintained peripheral neuromuscular function, RRTw,Pot and RRTMS were unaffected across conditions (Fig. 4 H, 4 D). These findings are supported by Morrow et al. (1988) who reported no significant changes in performance outcome measures following respiratory alkalosis. Similarly, Spriet et al. (1986) found no significant changes in isometric force production following sciatic nerve stimulation in mice and, furthermore, no significant differences in muscle oxygen uptake, glucose utilisation and total lactate production following induced respiratory alkalosis. This evidence suggests that peripheral neuromuscular function was maintained despite marked reductions in and related respiratory alkalosis.
Corticospinal excitability and reduced
A central finding of the present study is that MEP amplitude (%M max) was increased during Hypocapnia (Fig. 4 B). Our data are in agreement with several previous reports (Seyal et al. 1998; Sparing et al. 2007) using controlled hyperventilation to induce reductions in ; however, this finding is not universally accepted (Kong et al. 1994; Priori et al. 1995). Seyal et al. (1998) reported an inverse relationship between and MEP amplitude during graded hyperventilation and noted significant enhancement of the MEP response when reductions in were greater than 10 mmHg below eucapnia. Similarly, Sparing et al. (2007) observed a significant decrease in the motor threshold and an enhancement of the MEP stimulus–response curve to TMS after hyperventilation resulting in a 15 mmHg reduction in . In contrast to these findings, Kong et al. (1994) and Priori et al. (1995) reported no significant alterations in MEP response during hyperventilation‐induced reductions in . A potential explanation for these conflicting results may be related to methodological issues. For example, Kong et al. (1994) suggested that their measure of motor cortex excitability (namely, post‐stimulus time histograms) may be too insensitive to detect the modest changes associated with reductions in . Similarly, the TMS stimulus intensity utilised by Priori et al. (1995) may have been too high to discriminate differences in MEP amplitude, despite significant reductions in (Seyal et al. 1998). This hypothesis has since been corroborated by Sparing et al. (2007), who reported a significant enhancement in the TMS stimulus–response curve only at intensities lower than 60% of stimulator output.
The mechanistic influence of reduced on motor cortex excitability has been elucidated in rat hippocampal slice preparations (Dulla et al. 2005). The increase in extracellular pH associated with reductions in inhibits ecto‐ATPase activity – a trans‐membrane enzyme that is involved in the hydrolysis of extracellular ATP – causing the accumulation of extracellular ATP and the decrease in extracellular adenosine. Increased extracellular ATP concentrations enhance purinergic receptors, causing an increase in excitatory inputs on interneurons (Khakh et al. 2003), modulation of excitatory post‐synaptic potentials (Pankratov et al. 1998) and facilitation of long‐term potentiation (Almeida et al. 2003). Conversely, decreased extracellular concentrations of adenosine impair A1 receptor activity, reducing the tonic inhibition of glutamate, a neurotransmitter that is responsible for mediating excitatory signals (Johansson et al. 2001). Collectively, these changes are associated with increased neuronal excitability and therefore increased MEP amplitude.
Similar research studies (Priori et al. 1995; Sparing et al. 2007) examining supra‐spinal responses to reductions in reported a 4–15% decrease in cortical inhibition; however, the present data fail to support this observation as cSP was unaffected by the experimental manipulations (Fig. 4 E). It is plausible that the duration of the hyperventilation protocol utilised in the present study was too short to induce significant changes in cortical inhibition. For example, Priori et al. (1995) reported that shortening of the cSP was significant only after 10 min of hyperventilation and lagged significantly behind changes in . Hyperventilation is associated with respiratory alkalosis and a reduction in serum ionised calcium concentration (Davies et al. 1986). The latter factor may modulate the primary inhibitory neurotransmitter GABA and NMDA receptors (Chesler & Kaila 1992; Lee et al. 1996). Specifically, shortening of the cSP is probably mediated through the GABAB receptor (Korchounov et al. 2005), a metabotropic trans‐membrane receptor that is characterised by its coupling to G‐proteins (Bowery et al. 2002) and, consequently, slow time‐course response in motor cortex inhibition (Kohl & Paulsen 2010).
Novel to the present study is the ability to delineate the influence of reduced versus the modulation of the sensory attention effects of hyperventilation. Increased MEP amplitude during Hypocapnia in comparison to Isocapnia suggests that reduced , rather than confounds associated with hyperventilation and potential activation of the CNS respiratory control centres (Neubauer et al. 1983), is associated with the increase in corticospinal excitability. For example, Ruge et al. (2014) provided evidence that attention demands placed on internal or external sources (in the context of the present study, focus on f br or tidal volume represents internal attention, whereas focusing on the sound of the metronome represents external focus of attention) increases corticospinal excitability and reduces GABA‐mediated inhibition in humans. This finding has been postulated elsewhere (Sparing et al. 2007); however, to the best of our knowledge, the present study is the first to systematically investigate this question.
Voluntary activation and cerebral blood flow
Although there were no significant reductions in voluntary torque production, cVA was reduced in comparison to baseline during the Indomethacin and Hypocapnia conditions (Fig. 4 C). Reduced cVA during voluntary contractions occurs because of suboptimal output from the motor cortex, causing a decrease in motor neuron firing frequency and/or motor neuron recruitment (Peters & Fuglevand 1999). As cVA was selectively lower during reductions in CBF independent of reduced (i.e. the Indomethacin condition), these findings suggest that CBF may be an important mechanism regulating voluntary activation in the present study.
Previous research indicates that reductions in voluntary activation occur in response to a variety of stressors, such as fatiguing exercise (Todd et al. 2003), hyperthermia (Morrison et al. 2004; Todd et al. 2005; Thomas et al. 2006; Ross et al. 2012) and hypoxia (Goodall et al. 2010). During passive heating, Ross et al. (2012) observed a progressive decrease in voluntary activation that was associated with thermal hyperpnoea and concomitant reductions in and CBF. Furthermore, breathing a hypercapnic gas mixture (5% CO2) at the point of thermal intolerance caused the partial restoration of voluntary activation, suggesting that cerebrovascular mechanisms, rather than the direct effects of hyperthermia, mediate neuromuscular impairments. The present study supports these findings, suggesting that cerebrovascular mechanisms mediate reductions in voluntary activation and, furthermore, delineate the primary role of CBF (rather than reduced per se) as a modulator of descending drive from the motor cortex.
Previous research (Rasmussen et al. 2007; Nybo & Rasmussen 2007; Secher et al. 2008; Seifert et al. 2009) suggests that impaired cerebral oxygenation, rather than the direct influence of reduced CBF, mediates central neuromuscular fatigue. For example, Rasmussen et al. (2007) reported that reduced maximal handgrip strength occurs in conjunction with lactate spill‐over from cerebral tissue, suggesting that oxygen levels are inadequate to support aerobic metabolism. Impaired oxygenation results in reductions in (estimated) mitochondrial oxygen tension and consequently may impair neuronal function (Rasmussen et al. 2007; Lewis et al. 2014). It is important to note that the present study did not measure cerebral oxygenation, but rather cerebral blood velocity (a surrogate measure of blood flow). Therefore, we cannot exclude the possibility of increased oxygen extraction (e.g. Lewis et al., 2014) in response to cerebral hypoperfusion as a possible compensatory mechanism in the present study.
In addition to the independent influence of changes in CBF on neuromuscular function, increased perception of effort (Berchicci et al. 2013; Lampropoulou & Nowicky 2014) or discomfort during Indomethacin and Hypocapnia may have contributed to the reductions in cVA. Both indomethacin and hyperventilation, via their impact on causing cerebral vasoconstriction, are associated with similar neurological side effects, such as dizziness, nervousness and headache – factors that contribute to an overall sensation of distress. Recently, Lampropoulou & Nowicky (2014) indicated that perception of effort is a primary regulator of voluntary motor control during isometric contractions. Furthermore, Baweja et al. (2011) indicated that high‐amplitude respiration contributes to a lack of motor control during MVC. Although the association between reductions in CBF and increased perception of effort or distress remain speculative at best, the present study excludes the possible psychosomatic modulating effect of elevations in ventilation, rather than reduced or CBF per se, given that reductions in voluntary activation were not observed during the Isocapnia condition (Fig. 4 C).
Quantification of voluntary activation was assessed using both electrical stimulation of the peripheral motor nerve (pVA) and TMS of the motor cortex (cVA). Although both measures represent the magnitude of neural drive to the muscle, comparing the stimulation responses obtained at different locations throughout the neuromuscular system may help to localise the site of impairment (Todd et al. 2004). In the present study, reductions in voluntary activation, assessed as cVA, were greater during Indomethacin and Hypocapnia (Fig. 4 C); however, pVA failed to detect a significant difference in change in voluntary activation across these conditions. Collectively, this evidence suggests that the mechanism(s) that contribute to neuromuscular impairments in response to decreased CBF reside at or above the level of the motor cortex.
Methodological considerations
In the present study, we were limited to measurements of for the estimation of , but this assumption appears tenable, as previous research (Peebles et al. 2007; Willie et al. 2012) demonstrated that accurately reflects measurements of throughout progressive reductions in ( ± 25 mmHg baseline). Measurements of MCAv using TCD provide an index representation of CBF; however, this relationship is only valid assuming the diameter of the MCA does not change during the intervention (Ainslie & Hoiland 2014; Coverdale et al. 2014; Verbree et al. 2014). The stability of the MCA has been confirmed via magnetic resonance imaging during prostaglandin inhibition using a 100 mg oral dose of indomethacin (Xie et al. 2006). Changes in flow are adequately reflected by changes in flow velocity only when conduit artery diameter is unchanged (Valdueza et al. 1997), which appears to be true during moderate changes in MAP (Giller et al. 1993). Recent evidence indicates that MCA diameter may constrict in response to reductions in (Ainslie & Hoiland 2014; Coverdale et al. 2014; Verbree et al. 2014), although small differences in MCAv and flow during reductions in are unlikely to detract from our primary findings; if anything, MCA constriction would underestimate our findings. Also, we only measured blood flow velocity in the territory of the MCA; whether the observed blood flow response was homogenous across all vascular territories in the brain is unknown (Willie et al. 2012; Skow et al. 2013).
The indomethacin dose was supplemented with ranitidine, an H2‐antagonist that inhibits the activity of histamine. Previous research suggests that histamine may have a role in post‐exercise vasodilatation of human skeletal muscle (Martins et al. 1980; Halliwill et al. 2013) and, furthermore, animal models suggest that histamine may act directly on the cerebral vasculature to increase CBF. Therefore, H2‐receptor antagonists alter CBF and its response to different stressors (Audibert et al. 1991), and probably potentiate the reduction in CBF when supplemented with indomethacin.
Note that the present study did not include female participants and therefore we cannot examine the influence of oestrogen and progesterone on corticospinal excitability in response to changes in CBF. Previous research (Brackley et al. 1999; Inghilleri et al. 2004) highlights significant differences in intracranial cerebral circulation throughout the menstrual cycle, where reductions in CBF were associated with the luteal phase in comparison to the follicular phase. Furthermore, hormonal changes associated with the menstrual cycle have been shown to have a direct influence on motor cortex excitability. Therefore, the present results should be interpreted with caution when extrapolating to females.
Conclusions
We demonstrated that increased corticospinal excitability appears to be exclusive to reductions in , but not reductions in CBF itself. In contrast, reductions in cVA were moderately associated with decreased CBF and the loci of fatigue were identified at or above the level of the motor cortex. Our findings further delineate the mechanisms that contribute to central fatigue by demonstrating that reduced versus the normal associated reductions in CBF have distinct effects on the neuromuscular system.
Additional information
Competing interests
The authors have no competing interests to disclose.
Author contributions
The study was performed in the Environmental Ergonomics Laboratory in the Department of Kinesiology and Brock University. (1) Conception and design of the experiment: G.L.H., P.N.A., M.J.G., S.S.C.; (2) collection, analysis and interpretation of the data: G.L.H., C.L.W., P.N.A., C.D.T., D.A.G., D.D.O., S.S.C.; (3) drafting the article or revising it critically for important intellectual content: G.L.H., C.L.W., P.N.A., C.D.T., M.J.G., D.A.G., D.D.O., S.S.C. G.L.H. developed the end‐tidal forcing system (available upon request).
Funding
The study was supported by the Natural Sciences and Engineering Research Council of Canada (NSERC) through a Discovery Grant (#227912‐07, S.S.C.). G.L.H. is supported by an Ontario Graduate Scholarship. S.S.C. and P.N.A. are each supported by a Canada Research Chair.
Acknowledgements
We express our gratitude to the participants for their efforts throughout the study.
References
- Ainslie PN & Duffin J (2009). Integration of cerebrovascular CO2 reactivity and chemoreflex control of breathing: mechanisms of regulation, measurement, and interpretation. Am J Physiol Regul Integr Comp Physiol 296, R1473–1495. [DOI] [PubMed] [Google Scholar]
- Ainslie PN & Hoiland RL (2014). Transcranial Doppler ultrasound: valid, invalid, or both? J Appl Physiol 117, 1081–1083. [DOI] [PubMed] [Google Scholar]
- Almeida T, Rodrigues RJ, de Mendonça A, Ribeiro JA & Cunha RA (2003). Purinergic P2 receptors trigger adenosine release leading to adenosine A2A receptor activation and facilitation of long‐term potentiation in rat hippocampal slices. Neuroscience 122, 111–21. [DOI] [PubMed] [Google Scholar]
- Amann M, Eldridge MW, Lovering AT, Stickland MK, Pegelow DF & Dempsey JA (2006). Arterial oxygenation influences central motor output and exercise performance via effects on peripheral locomotor muscle fatigue in humans. J Appl Physiol 575, 937–952. [DOI] [PMC free article] [PubMed] [Google Scholar]
- Amann M, Romer LM, Subudhi AW, Pegelow DF & Dempsey JA (2007). Severity of arterial hypoxaemia affects the relative contributions of peripheral muscle fatigue to exercise performance in healthy humans. J Physiol 581, 389–403. [DOI] [PMC free article] [PubMed] [Google Scholar]
- Audibert G, Saunier C, Hartemann D, Bigard O & Haberer JP (1991). Effects of H2‐receptor blockers on response of cerebral blood flow to normocapnic hypoxia. Anaesth Analg 72, 532–537. [DOI] [PubMed] [Google Scholar]
- Baweja HS, Patel BK, Neto OP & Christou EA (2011). The interaction of respiration and visual feedback on the control of force and neural activation of the agonist muscle. Hum Mov Sci 30, 1022–1038. [DOI] [PMC free article] [PubMed] [Google Scholar]
- Berchicci M, Menotti F, Macaluso A & Di Russo F (2013). The neurophysiology of central and peripheral fatigue during sub‐maximal lower limb isometric contractions. Front Hum Neurosci 7, 135. [DOI] [PMC free article] [PubMed] [Google Scholar]
- Bigland‐Ritchie B & Woods JJ (1984). Changes in muscle contractile properties and neural control during human muscular fatigue. Muscle Nerve 7, 691–699. [DOI] [PubMed] [Google Scholar]
- Bowery NG, Bettler B, Froestl W, Gallagher JP, Marshall F, Raiteri M, Bonner TI & Enna SJ (2002). International Union of Pharmacology. XXXIII. Mammalian γ‐aminobutyric acidB receptors: structure and function. Pharmacol Rev 54, 247–264. [DOI] [PubMed] [Google Scholar]
- Brackley KJ, Ramsay MM, Broughton Pipkin F & Rubin PC (1999). The effect of the menstrual cycle on human cerebral blood flow: studies using Doppler ultrasound. Ultrasound Obstet Gynecol 14, 52–57. [DOI] [PubMed] [Google Scholar]
- Carroll TJ, Riek S & Carson RG (2001). Reliability of the input–output properties of the cortico‐spinal pathway obtained from transcranial magnetic and electrical stimulation. J Neurosci Methods 112, 193–202. [DOI] [PubMed] [Google Scholar]
- Chesler M & Kaila K (1992). Modulation of pH by neuronal activity. Trends Neurosci 15, 396–402. [DOI] [PubMed] [Google Scholar]
- Cohen J (1988). Statistical Power Analysis for the Behavioural Sciences. Lawrence Earlbaum Associates, Hilsdale, NJ. [Google Scholar]
- Coverdale NS, Gati JS, Opalevych O, Perrotta A & Shoemaker JK (2014). Cerebral blood flow velocity underestimates cerebral blood flow during modest hypercapnia and hypocapnia. J Appl Physiol 117, 1090–1096. [DOI] [PubMed] [Google Scholar]
- Davies HD, Carroll WM & Mastaglia FL (1986). Effects of hyperventilation on pattern‐reversal visual evoked potentials in patients with demyelination. J Neurol Neurosurg Psychiatry 49, 1392–1396. [DOI] [PMC free article] [PubMed] [Google Scholar]
- Dulla CG, Dobelis P, Pearson T, Frenguelli BG, Staley KJ & Masino SA (2005). Adenosine and ATP link to cortical excitability via pH. Neuron 48, 1011–1023. [DOI] [PMC free article] [PubMed] [Google Scholar]
- Fan J‐L, Burgess KR, Thomas KN, Peebles KC, Lucas SJE, Lucas RAI, Cotter JD & Ainslie PN (2011). Influence of indomethacin on the ventilatory and cerebrovascular responsiveness to hypoxia. Eur J Appl Physiol 111, 601–610. [DOI] [PubMed] [Google Scholar]
- Gandevia SC (2001). Spinal and supraspinal factors in human muscle fatigue. Physiol Rev 81, 1725–1789. [DOI] [PubMed] [Google Scholar]
- Gandevia SC, Petersen N, Butler JE & Taylor JL (1999). Impaired response of human motoneurones to corticospinal stimulation after voluntary exercise. J Physiol 521, 749–759. [DOI] [PMC free article] [PubMed] [Google Scholar]
- Giller CA, Bowman G, Dyer H, Mootz L & Krippner W (1993). Cerebral arterial diameters during changes in blood pressure and carbon dioxide during craniotomy. Neurosurgery 32, 737–742. [PubMed] [Google Scholar]
- Goodall S, Ross EZ & Romer LM (2010). Effect of graded hypoxia on supraspinal contributions to fatigue with unilateral knee‐extensor contractions. J Appl Physiol 109, 1842–1851. [DOI] [PubMed] [Google Scholar]
- Green RS, Leffler CW, Busija DW, Fletcher AM & Beasley DG (1987). Indomethacin does not alter the circulating catecholamine response to asphyxia in the neonatal piglet. Pediatr Res 21, 534–537. [DOI] [PubMed] [Google Scholar]
- Halliwill JR, Buck TM, Lacewell AN & Romero SA (2013). Postexercise hypotension and sustained postexercise vasodilatation: what happens after we exercise? Exp Physiol 98, 7–18. [DOI] [PubMed] [Google Scholar]
- Hayen A, Herigstad M, Kelly M, Okell TW, Murphy K, Wise RG & Pattinson KTS (2013). The effects of altered intrathoracic pressure on resting cerebral blood flow and its response to visual stimulation. Neuroimage 66, 479–488. [DOI] [PMC free article] [PubMed] [Google Scholar]
- Hilbert M, Shushakov V & Maassen N (2012). The influence of respiratory acid–base changes on muscle performance and excitability of the sarcolemma during strenuous intermittent hand grip exercise. J Appl Physiol 112, 571–579. [DOI] [PubMed] [Google Scholar]
- Hohimer AR, Richardson BS, Bissonnette JM & Machida CM (1985). The effect of indomethacin on breathing movements and cerebral blood flow and metabolism in the fetal sheep. J Dev Physiol 7, 217–228. [PubMed] [Google Scholar]
- Hoiland RL, Ainslie PN, Wildfong KW, Smith KJ, Bain AR, Willie CK, Foster G, Monteleone B & Day TA (2015). Indomethacin‐induced impairment of regional cerebrovascular reactivity: implications for respiratory control. J Physiol 593, 1291–306. [DOI] [PMC free article] [PubMed] [Google Scholar]
- Ide K & Secher NH (2000). Cerebral blood flow and metabolism during exercise. Prog Neurobiol 61, 397–414. [DOI] [PubMed] [Google Scholar]
- Inghilleri M, Conte A, A Currà, Frasca V, Lorenzano C & Berardelli A (2004). Ovarian hormones and cortical excitability. An rTMS study in humans. Clin Neurophysiol 115, 1063–1068. [DOI] [PubMed] [Google Scholar]
- Johansson B, Halldner L, Dunwiddie TV, Masino SA, Poelchen W, Giménez‐Llort L, Escorihuela RM, Fernández‐Teruel A, Wiesenfeld‐Hallin Z, Xu XJ, Hårdemark A, Betsholtz C, Herlenius E & Fredholm BB (2001). Hyperalgesia, anxiety, and decreased hypoxic neuroprotection in mice lacking the adenosine A1 receptor. Proc Natl Acad Sci USA 98, 9407–9412. [DOI] [PMC free article] [PubMed] [Google Scholar]
- Julkunen P, Kallioniemi E, Könönen M & Säisänen L (2013). Feasibility of automated analysis and inter‐examiner variability of cortical silent period induced by transcranial magnetic stimulation. J Neurosci Methods 217, 75–81. [DOI] [PubMed] [Google Scholar]
- Khakh BS, Gittermann D, Cockayne DA & Jones A (2003). ATP modulation of excitatory synapses onto interneurons. J Neurosci 23, 7426–7437. [DOI] [PMC free article] [PubMed] [Google Scholar]
- Koehle MS, Giles LV, Curtis AN, Walsh ML & White MD (2009). Performance of a compact end‐tidal forcing system. Respir Physiol Neurobiol 167, 155–161. [DOI] [PubMed] [Google Scholar]
- Kohl MM & Paulsen O (2010). The roles of GABAB receptors in cortical network activity. Adv Pharmacol 58, 205–229. [DOI] [PubMed] [Google Scholar]
- Kong K, Ukachoke C, Ashby P & Chapman KR (1994). Excitability of human motor cortex during hyperventilation and hypercapnia. Can J Physiol Pharmacol 72, 909–913. [DOI] [PubMed] [Google Scholar]
- Korchounov A, Ilic TV, Schwinge T & Ziemann U (2005). Modification of motor cortical excitability by an acetylcholinesterase inhibitor. Exp Brain Res 164, 399–405. [DOI] [PubMed] [Google Scholar]
- Kraaier V, Van Huffelen AC, Wieneke GH, Van der Worp HB & Bar PR (1992). Quantitative EEG changes due to cerebral vasoconstriction. Indomethacin versus hyperventilation‐induced reduction in cerebral blood flow in normal subjects. Electroencephalogr Clin Neurophysiol 82, 208–212. [DOI] [PubMed] [Google Scholar]
- Kukumberg P, Benetin J & Kuchar M (1996). Changes of motor evoked potential amplitudes following magnetic stimulation after hyperventilation. Electromyogr Clin Neurophysiol 36, 271–273. [PubMed] [Google Scholar]
- Lampropoulou SI & Nowicky AV (2014). Perception of effort changes following an isometric fatiguing exercise of elbow flexors. Motor Control 18, 146–164. [DOI] [PubMed] [Google Scholar]
- Lee J, Taira T, Pihlaja P, Ransom BR & Kaila K (1996). Effects of CO2 on excitatory transmission apparently caused by changes in intracellular pH in the rat hippocampal slice. Brain Res 706, 210–216. [DOI] [PubMed] [Google Scholar]
- Lewis NCS, Bain AR, MacLeod DB, Wildfong KW, Smith KJ, Willie CK, Sanders ML, Numan T, Morrison SA, Foster GE, Stewart JM & Ainslie PN (2014). Impact of hypocapnia and cerebral perfusion on orthostatic tolerance. J Physiol 592, 5203–5219. [DOI] [PMC free article] [PubMed] [Google Scholar]
- Macefield G & Burke D (1991). Paraesthesiae and tetany induced by voluntary hyperventilation. Increased excitability of human cutaneous and motor axons. Brain 114, 527–540. [DOI] [PubMed] [Google Scholar]
- Martins AN, Doyle TF, Wright SJ & Bass BG (1980). Response of cerebral circulation to topical histamine. Stroke 11, 469–476. [DOI] [PubMed] [Google Scholar]
- Mauger AR & Hopker JG (2013). The effect of acetaminophen ingestion on cortico‐spinal excitability. Can J Physiol Pharmacol 91, 187–189. [DOI] [PubMed] [Google Scholar]
- Merton PA (1954). Voluntary strength and fatigue. J Physiol 123, 553–564. [DOI] [PMC free article] [PubMed] [Google Scholar]
- Millet GY, Aubert D, Favier FB, Busso T & Benoit H (2009). Effect of acute hypoxia on central fatigue during repeated isometric leg contractions. Scand J Med Sci Sports 19, 695–702. [DOI] [PubMed] [Google Scholar]
- Millet GY, Muthalib M, Jubeau M, Laursen PB & Nosaka K (2012). Severe hypoxia affects exercise performance independently of afferent feedback and peripheral fatigue. J Appl Physiol 112, 1335–1344. [DOI] [PubMed] [Google Scholar]
- Mogyoros I, Kiernan MC, Burke D & Bostock H (1997). Excitability changes in human sensory and motor axons during hyperventilation and ischaemia. Brain 120, 317–325. [DOI] [PubMed] [Google Scholar]
- Morrison S, Sleivert GG & Cheung SS (2004). Passive hyperthermia reduces voluntary activation and isometric force production. Eur J Appl Physiol 91, 729–736. [DOI] [PubMed] [Google Scholar]
- Morrow JA, Fell RD & Gladden LB (1988). Respiratory alkalosis: no effect on blood lactate decline or exercise performance. Eur J Appl Physiol Occup Physiol 58, 175–181. [DOI] [PubMed] [Google Scholar]
- Neubauer JA, Strumpf DA & Edelman NH (1983). Regional medullary blood flow during isocapnic hyperpnea in anaesthetized cats. J Appl Physiol Respir Environ Exerc Physiol 55, 447–452. [DOI] [PubMed] [Google Scholar]
- Nybo L & Nielsen B (2001). Middle cerebral artery blood velocity is reduced with hyperthermia during prolonged exercise in humans. J Physiol 534, 279–286. [DOI] [PMC free article] [PubMed] [Google Scholar]
- Nybo L & Rasmussen P (2007). Inadequate cerebral oxygen delivery and central fatigue during strenuous exercise. Exerc Sport Sci Rev 35, 110–118. [DOI] [PubMed] [Google Scholar]
- Pankratov Y, Castro E, Miras‐Portugal MT & Krishtal O (1998). A purinergic component of the excitatory postsynaptic current mediated by P2X receptors in the CA1 neurons of the rat hippocampus. Eur J Neurosci 10, 3898–3902. [DOI] [PubMed] [Google Scholar]
- Parfenova H, Zuckerman S & Leffler CW (1995). Inhibitory effect of indomethacin on prostacyclin receptor‐mediated cerebral vascular responses. Am J Physiol 268, H1884–1890. [DOI] [PubMed] [Google Scholar]
- Peebles K, Celi L, McGrattan K, Murrell C, Thomas K & Ainslie PN (2007). Human cerebrovascular and ventilatory CO2 reactivity to end‐tidal, arterial and internal jugular vein . J Physiol 584, 347–357. [DOI] [PMC free article] [PubMed] [Google Scholar]
- Peters EJ & Fuglevand AJ (1999). Cessation of human motor unit discharge during sustained maximal voluntary contraction. Neurosci Lett 274, 66–70. [DOI] [PubMed] [Google Scholar]
- Priori A, Berardelli A, Mercuri B, Inghilleri M & Manfredi M (1995). The effect of hyperventilation on motor cortical inhibition in humans: a study of the electromyographic silent period evoked by transcranial brain stimulation. Electroencephalogr Clin Neurophysiol 97, 69–72. [DOI] [PubMed] [Google Scholar]
- Rasmussen P, Dawson EA, Nybo L, van Lieshout JJ, Secher NH & Gjedde A (2007). Capillary‐oxygenation‐level‐dependent near‐infrared spectrometry in frontal lobe of humans. J Cereb Blood Flow Metab 27, 1082–1093. [DOI] [PubMed] [Google Scholar]
- Rasmussen P, Nielsen J, Overgaard M, Krogh‐Madsen R, Gjedde A, Secher NH & Petersen NC (2010). Reduced muscle activation during exercise related to brain oxygenation and metabolism in humans. J Physiol 588, 1985–1995. [DOI] [PMC free article] [PubMed] [Google Scholar]
- Ross EZ, Cotter JD, Wilson L, Fan J‐L, Lucas SJE & Ainslie PN (2012). Cerebrovascular and corticomotor function during progressive passive hyperthermia in humans. J Appl Physiol 112, 748–758. [DOI] [PubMed] [Google Scholar]
- Ruge D, Muggleton N, Hoad D, Caronni A & Rothwell JC (2014). An unavoidable modulation? Sensory attention and human primary motor cortex excitability. Eur J Neurosci 40, 2850–2858. [DOI] [PubMed] [Google Scholar]
- Secher NH, Seifert T & Van Lieshout JJ (2008). Cerebral blood flow and metabolism during exercise: implications for fatigue. J Appl Physiol 104, 306–314. [DOI] [PubMed] [Google Scholar]
- Seifert T, Rasmussen P, Secher NH & Nielsen HB (2009). Cerebral oxygenation decreases during exercise in humans with beta‐adrenergic blockade. Acta Physiol (Oxf) 196, 295–302. [DOI] [PubMed] [Google Scholar]
- Seyal M, Mull B & Gage B (1998). Increased excitability of the human corticospinal system with hyperventilation. Electroencephalogr Clin Neurophysiol 109, 263–267. [DOI] [PubMed] [Google Scholar]
- Skow RJ, MacKay CM, Tymko MM, Willie CK, Smith KJ, Ainslie PN & Day TA (2013). Differential cerebrovascular CO2 reactivity in anterior and posterior cerebral circulations. Respir Physiol Neurobiol 189, 76–86. [DOI] [PubMed] [Google Scholar]
- Sparing R, Dafotakis M, Buelte D, Meister IG & Noth J (2007). Excitability of human motor and visual cortex before, during, and after hyperventilation. J Appl Physiol 102, 406–11. [DOI] [PubMed] [Google Scholar]
- Spriet LL, Lindinger MI, Heigenhauser GJ & Jones NL (1986). Effects of alkalosis on skeletal muscle metabolism and performance during exercise. Am J Physiol 251, R833–839. [DOI] [PubMed] [Google Scholar]
- Staessen J, Cattaert A, Fagard R, Lijnen P, Moerman E, De Schaepdryver A & Amery A (1984). Hemodynamic and humoral effects of prostaglandin inhibition in exercising humans. J Appl Physiol 56, 39–45. [DOI] [PubMed] [Google Scholar]
- Taylor JL & Gandevia SC (2001). Transcranial magnetic stimulation and human muscle fatigue. Muscle Nerve 24, 18–29. [DOI] [PubMed] [Google Scholar]
- Thomas MM, Cheung SS, Elder GC & Sleivert GG (2006). Voluntary muscle activation is impaired by core temperature rather than local muscle temperature. J Appl Physiol 100, 1361–1369. [DOI] [PubMed] [Google Scholar]
- Todd G, Butler JE, Taylor JL & Gandevia SC (2005). Hyperthermia: a failure of the motor cortex and the muscle. J Appl Physiol 563, 621–631. [DOI] [PMC free article] [PubMed] [Google Scholar]
- Todd G, Taylor JL & Gandevia SC (2003). Measurement of voluntary activation of fresh and fatigued human muscles using transcranial magnetic stimulation. J Physiol 551, 661–671. [DOI] [PMC free article] [PubMed] [Google Scholar]
- Todd G, Taylor JL & Gandevia SC (2004). Reproducible measurement of voluntary activation of human elbow flexors with motor cortical stimulation. J Appl Physiol 97, 236–242. [DOI] [PubMed] [Google Scholar]
- Valdueza JM, Balzer JO, Villringer A, Vogl TJ, Kutter R & Einhäupl KM (1997). Changes in blood flow velocity and diameter of the middle cerebral artery during hyperventilation: assessment with MR and transcranial Doppler sonography. Am J Neuroradiol 18, 1929–1934. [PMC free article] [PubMed] [Google Scholar]
- Verbree J, Bronzwaer A‐SGT, Ghariq E, Versluis MJ, Daemen MJAP, van Buchem MA, Dahan A, van Lieshout JJ & van Osch MJP (2014). Assessment of middle cerebral artery diameter during hypocapnia and hypercapnia in humans using ultra‐high‐field MRI. J Appl Physiol 117, 1084–1089. [DOI] [PubMed] [Google Scholar]
- Wennmalm A, Carlsson I, Edlund A, Eriksson S, Kaijser L & Nowak J (1984). Central and peripheral haemodynamic effects of non‐steroidal anti‐inflammatory drugs in man. Arch Toxicol Suppl 7, 350–359. [DOI] [PubMed] [Google Scholar]
- Willie CK, Colino FL, Bailey DM, Tzeng YC, Binsted G, Jones LW, Haykowsky MJ, Bellapart J, Ogoh S, Smith KJ, Smirl JD, Day TA, Lucas SJ, Eller LK & Ainslie PN (2011). Utility of transcranial Doppler ultrasound for the integrative assessment of cerebrovascular function. J Neurosci Methods 196, 221–237. [DOI] [PubMed] [Google Scholar]
- Willie CK, Macleod DB, Shaw AD, Smith KJ, Tzeng YC, Eves ND, Ikeda K, Graham J, Lewis NC, Day TA & Ainslie PN (2012). Regional brain blood flow in man during acute changes in arterial blood gases. J Physiol 590, 3261–3275. [DOI] [PMC free article] [PubMed] [Google Scholar]
- Xie AL, Skatrud JB, Morgan B, Chenuel B, Khayat R, Reichmuth K, Lin J & Dempsey JA (2006). Influence of cerebrovascular function on the hypercapnic ventilatory response in healthy humans. J Physiol 577, 319–329. [DOI] [PMC free article] [PubMed] [Google Scholar]