

Abstract
Key points
Xenopus laevis craniofacial development is a good system for the study of Andersen–Tawil Syndrome (ATS)‐associated craniofacial anomalies (CFAs) because (1) Kcnj2 is expressed in the nascent face; (2) molecular‐genetic and biophysical techniques are available for the study of ion‐dependent signalling during craniofacial morphogenesis; (3) as in humans, expression of variant Kcnj2 forms in embryos causes a muscle phenotype; and (4) variant forms of Kcnj2 found in human patients, when injected into frog embryos, cause CFAs in the same cell lineages.
Forced expression of WT or variant Kcnj2 changes the normal pattern of V mem (resting potential) regionalization found in the ectoderm of neurulating embryos, and changes the normal pattern of expression of ten different genetic regulators of craniofacial development, including markers of cranial neural crest and of placodes.
Expression of other potassium channels and two different light‐activated channels, all of which have an effect on V mem, causes CFAs like those induced by injection of Kcnj2 variants. In contrast, expression of Slc9A (NHE3), an electroneutral ion channel, and of GlyR, an inactive Cl− channel, do not cause CFAs, demonstrating that correct craniofacial development depends on a pattern of bioelectric states, not on ion‐ or channel‐specific signalling.
Using optogenetics to control both the location and the timing of ion flux in developing embryos, we show that affecting V mem of the ectoderm and no other cell layers is sufficient to cause CFAs, but only during early neurula stages. Changes in V mem induced late in neurulation do not affect craniofacial development.
We interpret these data as strong evidence, consistent with our hypothesis, that ATS‐associated CFAs are caused by the effect of variant Kcnj2 on the V mem of ectodermal cells of the developing face. We predict that the critical time is early during neurulation, and the critical cells are the ectodermal cranial neural crest and placode lineages. This points to the potential utility of extant, ion flux‐modifying drugs as treatments to prevent CFAs associated with channelopathies such as ATS.
Abstract
Variants in potassium channel KCNJ2 cause Andersen–Tawil Syndrome (ATS); the induced craniofacial anomalies (CFAs) are entirely unexplained. We show that KCNJ2 is expressed in Xenopus and mouse during the earliest stages of craniofacial development. Misexpression in Xenopus of KCNJ2 carrying ATS‐associated mutations causes CFAs in the same structures affected in humans, changes the normal pattern of membrane voltage potential regionalization in the developing face and disrupts expression of important craniofacial patterning genes, revealing the endogenous control of craniofacial patterning by bioelectric cell states. By altering cells’ resting potentials using other ion translocators, we show that a change in ectodermal voltage, not tied to a specific protein or ion, is sufficient to cause CFAs. By adapting optogenetics for use in non‐neural cells in embryos, we show that developmentally patterned K+ flux is required for correct regionalization of the resting potentials and for establishment of endogenous early gene expression domains in the anterior ectoderm, and that variants in KCNJ2 disrupt this regionalization, leading to the CFAs seen in ATS patients.
Key points
Xenopus laevis craniofacial development is a good system for the study of Andersen–Tawil Syndrome (ATS)‐associated craniofacial anomalies (CFAs) because (1) Kcnj2 is expressed in the nascent face; (2) molecular‐genetic and biophysical techniques are available for the study of ion‐dependent signalling during craniofacial morphogenesis; (3) as in humans, expression of variant Kcnj2 forms in embryos causes a muscle phenotype; and (4) variant forms of Kcnj2 found in human patients, when injected into frog embryos, cause CFAs in the same cell lineages.
Forced expression of WT or variant Kcnj2 changes the normal pattern of V mem (resting potential) regionalization found in the ectoderm of neurulating embryos, and changes the normal pattern of expression of ten different genetic regulators of craniofacial development, including markers of cranial neural crest and of placodes.
Expression of other potassium channels and two different light‐activated channels, all of which have an effect on V mem, causes CFAs like those induced by injection of Kcnj2 variants. In contrast, expression of Slc9A (NHE3), an electroneutral ion channel, and of GlyR, an inactive Cl− channel, do not cause CFAs, demonstrating that correct craniofacial development depends on a pattern of bioelectric states, not on ion‐ or channel‐specific signalling.
Using optogenetics to control both the location and the timing of ion flux in developing embryos, we show that affecting V mem of the ectoderm and no other cell layers is sufficient to cause CFAs, but only during early neurula stages. Changes in V mem induced late in neurulation do not affect craniofacial development.
We interpret these data as strong evidence, consistent with our hypothesis, that ATS‐associated CFAs are caused by the effect of variant Kcnj2 on the V mem of ectodermal cells of the developing face. We predict that the critical time is early during neurulation, and the critical cells are the ectodermal cranial neural crest and placode lineages. This points to the potential utility of extant, ion flux‐modifying drugs as treatments to prevent CFAs associated with channelopathies such as ATS.
Abbreviations
- ATS
Andersen–Tawil Syndrome
- β‐gal
beta‐galactosidase
- CFA
craniofacial anomaly
- DN
dominant negative
- GFP
greed fluorescent protein
- GlyR
glycine receptor, a Cl– channel
- KCNJ2
inwardly rectifying potassium channel subfamily J member 2, a.k.a. ATFB9, cardiac inward rectifier potassium channel, IRK1, HHIRK1, HIRK1, KIR2.1, LQT7, SQT3
- KCNJ11
inwardly rectifying potassium channel subfamily J member 11
- KCNQ1
potassium channel, voltage gated KQT‐like subfamily Q member 1
- Kir2.1
protein encoded in KCNJ2
- Kir6.2
protein encoded in KCNJ11
- KvLQT
protein encoded in KCNQ1
- NHE3
cation proton antiporter 3
- PDMS
poly(dimethylsiloxane)
- PIP2
phosphoinositol bisphosphate
- ROI
region of interest
- SLC9A3
solute carrier family 9 subfamily A member 3
- Vmem
resting membrane voltage or resting potential
- WISH
whole mount in situ hybridization
Introduction
Mutations in the Kir2.1 inwardly rectifying potassium‐channel gene KCNJ2 correlate with 60% of examined cases of Andersen–Tawil Syndrome (ATS, OMIM no. 600681), a rare, autosomal‐dominant disorder characterized by cardiac arrhythmias, periodic paralysis, and a suite of skeletal and craniofacial anomalies (CFAs) (Donaldson et al. 2004; Yoon et al. 2006; Weir et al. 2011). Those CFAs include broad forehead and nose, wide set eyes (hypertelorism), low set ears, a small lower jaw (micrognathia), joined digits (syndactyly) and inward curving of fingers and/or toes (clinodactyly) (Tristani‐Firouzi, 2006) (Fig. 1). Of the approximately 45 known ATS‐associated KCNJ2 variants, about half have been specifically reported to cause CFAs. Importantly, it has been proposed that binding of alcohol to Kir2.1, a known target, leads to the CFAs associated with fetal alcohol syndrome (Bates, 2013). Thus understanding the etiology of these CFAs is important not only for ATS, but is also critical for our understanding of an all‐too‐common suite of birth defects. While the contributions of mutated Kir2.1 to arrhythmias and paralysis have been studied extensively in both mammals and a new zebrafish model (Leong et al. 2010), the etiology of CFAs remains entirely unexplained (Rajakulendran et al. 2010; Nguyen et al. 2013). Because of our studies on the role of membrane voltage (V mem) during development (Adams, 2008; Vandenberg et al. 2011; Pai et al. 2012, 2015; Tseng & Levin, 2013 a; Levin, 2014), we hypothesized that it is Kir2.1's role in establishing correct patterns of V mem across the nascent face that is required for normal craniofacial development. We tested this hypothesis in the embryonic frog Xenopus laevis, a model system frequently used to understand normal developmental mechanisms and their genetic disruption, and increasingly used for studies of craniofacial development (Seufert et al. 1994; Beck & Slack, 2001; Gross & Hanken, 2005, 2008; Kerney et al. 2007; Robert & Cohen, 2011; Barnett et al. 2012; Chernet & Levin, 2013; Li et al. 2013; Pratt & Khakhalin, 2013; Singh et al. 2013).
Figure 1. External craniofacial anomalies characteristic of Andersen‐Tawil Syndrome .
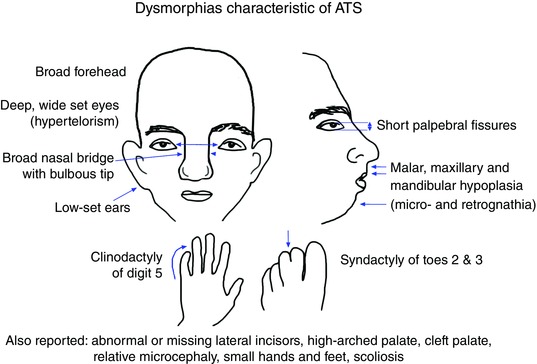
One of the three features used for diagnosis of ATS, craniofacial anomalies are seen in a majority of patients. These features are variably penetrant, however, with different patients showing different degrees of severity and different subsets of those shown. The characteristics shown here are frequently mentioned; a more inclusive list can be found in Yoon et al. (2006).
Kir2.1 (NP_000882.1), encoded in KCNJ2 (NM_000891.2), is the potassium, inwardly rectifying channel, subfamily J member 2a. It is a 427 amino acid, two‐pass, transmembrane protein, with both termini located in the cytoplasm. Kir2.1 homotetramers form a K+ channel that contributes to the potassium efflux that is critical for the repolarization of excitable cell membranes after an action potential, the so‐called IK current. Kir2.1 is negatively regulated (at membrane potentials positive to its equilibrium potential) by binding of spermine, spermidine and Mg2+ (Yang et al. 1995), and by phosphorylation of Tyr242. It is positively regulated (at potentials negative to its equilibrium potential) by binding of phosphoinositol bisphosphate (PIP2); three PIP2 binding sites have been identified in the long C terminus of the protein, at amino acids 175–206, 207–246 and 324–365 (Soom et al. 2001). Kir2.1 is critical for controlling the membrane voltage of cardiac myocytes; it is the effect of mutations on the QT interval and the U‐wave that are thought to cause the cardiac arrhythmia. This symptom is the source of the synonym LQT for long Q‐T interval (Hedley et al. 2009). Importantly, however, Kir2.1 also contributes to the resting potential (V mem) of undifferentiated embryonic cells, including those found in Xenopus embryos. Its effect on cellular functions go way beyond propagation of action potentials (Jongsma & Wilders, 2001).
We have previously shown that there is a dynamic pattern of resting V mem regionalization in the developing Xenopus embryo (Vandenberg et al. 2011), and that gradients of V mem across cell sheets in vivo serve as instructive cues that establish organ position during embryogenesis (Adams et al. 2006; Lange et al. 2011; Levin, 2012; Levin & Stevenson, 2012; Pai et al. 2012; Beane et al. 2013; Pai & Levin, 2013; Tseng & Levin, 2013). Moreover, numerous studies have now revealed various mechanisms by which changes in V mem are transduced into biochemical signals, including voltage‐gated calcium channels, voltage‐sensitive phosphatases, gap junctional communication, integrin‐dependent signals and inorganic‐phosphate sensitive processes (Stewart et al. 2007; Levin & Stevenson, 2012). V mem effects on serotonin transport (Lobikin et al. 2012) are particularly interesting in this context because of a recent report providing evidence of a role for serotonin receptor 2B during craniofacial morphogenesis (Reisoli et al. 2010). V mem has been shown to regulate cell proliferation, migration and orientation, all processes important to the development of the facial features that are abnormal in ATS patients (Sundelacruz et al. 2009; Levin, 2012; Adams & Levin, 2013). Because V mem is regulated by Kir2.1 (Hinard et al. 2008; van Vliet et al. 2010), we formulated the first hypothesis concerning the etiology of ATS‐associated CFAs: normal Kir2.1 channel activity is required for correct regionalization of V mem during craniofacial development, and that abnormalities in V mem patterns cause the CFAs of ATS. To test this hypothesis, we first established that Xenopus laevis craniofacial development is a useful model for probing the functional role of K+ channels in craniofacial development. Then we characterized the function of Kir2.1 channels in craniofacial patterning, and we describe the first use of optogenetics in non‐neural tissues to control voltage‐dependent craniofacial patterning events in vivo.
Methods
Xenopus laevis
Xenopus embryos were collected according to standard protocols (Sive et al. 2000) in 0.1× modified Marc's Ringer solution (MMR), pH 7.8. Embryos were staged according to Nieuwkoop & Faber (1994). The Tufts University IACUC approved all experimental procedures involving the use of animals (Protocol M2014‐79). Animals were killed by the standard accepted overdose of MS‐222 (Tricaine) followed by freezing.
Mus musculus
C57BL/6 J mice were purchased from The Jackson Laboratory (Bar Harbor, ME, USA). Embryonic day 0.5 (E0.5) was designated as noon on the day plugs were observed. Embryos were harvested at the developmental stages indicated, and fixed in 4% paraformaldehyde overnight prior to in situ hybridization procedure.
mRNA for injection
Capped, synthetic mRNAs (Sive et al. 2000) were injected into the animal hemisphere of Xenopus embryos at the 1‐, 2‐ or 4‐cell stage; preliminary experiments revealed no difference in frequency of CFAs among these three stages so the data were pooled. Further information about all mRNAs injected is given in Table 1. All mRNA levels were titred so that general toxicity was minimized and thus did not confound results. Embryos were then raised as usual to stage 45 when they were scored for CFAs. Only tadpoles otherwise in good health were scored for CFAs. Each variant was given a fluorescent protein reporter that was chosen based on having a spectrum that does not overlap with the spectra of the membrane voltage reporting dyes.
Table 1.
Sources and doses of injected mRNA constructs
| mRNA expressed | Dose | Source | References |
|---|---|---|---|
| ARCH | 60 pg | E. Boyden | (Chow et al. 2010) |
| KCNJ2 | 2.1 ng | L. Jan, P. Backx | (Jongsma & Wilders, 2001; Tristani‐Firouzi et al. 2002) |
| KCNJ2‐D71V | 2.0 ng | this lab | (Bendahhou et al. 2003; Donaldson et al. 2003) |
| KCNJ2‐T75R | 1.4 ng | this lab | (Donaldson et al. 2003) |
| KCNJ2‐T192A | 2.0 ng | this lab | (Tristani‐Firouzi & Etheridge, 2010) |
| KCNJ2‐R218W | 2.8 ng | this lab | (Yoon et al. 2006; Weir et al. 2011) |
| KCNJ2‐Y242F | 1.8 ng | S. Konig, L. Bernheim | (Jongsma & Wilders, 2001; Hinard et al. 2008; Bates, 2013) |
| KCNJ11‐K185Q | 0.50 ng | B. Schwappach | (Gloyn et al. 2006; Flanagan et al. 2009) |
| KCNQ1‐Y101C‐V244M | 2.0 ng | this lab | (Jespersen et al. 2005; Morokuma et al. 2008; Peroz et al. 2008) |
| PMA1.2 | 0.20 ng | M. Montero‐Lomeli | (Masuda & Montero‐Lomeli, 2000) |
All constructs were subcloned into PCS2+ for improved expression in Xenopus cells.
In situ hybridization
Whole mount in situ hybridization (WISH) on Xenopus was performed using standard protocols (Harland, 1991). The ISH probe for the Xenopus homologue of KCNJ2 was purchased from Bioscience International (Thomas Scientific) (Swedesboro, NJ, USA; IMAGE ID 4680451); the complete list of ISH probes used in Xenopus is given in Table 2. After staining, embryos were re‐fixed in 4% paraformaldehyde, and dehydrated in 100% ethanol overnight to remove background staining. Images were manipulated with Photoshop to increase clarity; no data were added or subtracted.
Table 2.
Sources of probes used for Xenopus in situ hybridization
| ISH probes | Source & ID (IMAGE or other) | References (if available) |
|---|---|---|
| FGF8 | Thermo Scientific 6983047 | (Shigetani et al. 2000; Creuzet et al. 2004; Hans et al. 2005; Abe et al. 2008) |
| FOXE4 | Gift from H. El‐Hodiri | (Zilinski et al. 2004) |
| Xenopus KCNJ2 | Open Biosystems 4680451 | (Tristani‐Firouzi et al. 2002; Bendahhou et al. 2003; Hattori et al. 2012) |
| Mus KCNJ2 | Open Biosystems 8860860 | |
| OTX2 | Gift from V. Schneider | (Ogino et al. 2008; Saint‐Germain et al. 2004; Steventon et al. 2012) |
| PAX2 | Bioscience International 8859926 | (Hans et al. 2004; McCarroll et al. 2012) |
| PAX6 | Gift from J‐P Saint‐Jeannet | (Purcell et al. 2005; Plageman et al. 2010) |
| SIX1 | Bioscience International 7974697 | (Ahrens & Schlosser, 2005; Moody et al. 2010) |
| SLUG | European Xenopus Resource Centre clone pmx363 | (Heeg‐Truesdell & LaBonne, 2004; Mancilla & Mayor, 1996) |
| SOX10 | Gift from C. LaBonne | (Aoki et al. 2003; Honore et al. 2003) |
| SOX3 | Bioscience International 6635221 | (Rizzoti & Lovell‐Badge, 2007; Abello et al. 2010) |
| FZ3 | P. Klein | (Deardorff et al. 2001; Rasmussen et al. 2001) |
Thermo Scientific, Pittsburgh, PA, USA; Bioscience International (Thomas Scientific), Swedesboro, NJ, USA; Open Biosystems (GE Dharmacon), Lafayette CO, USA; European Xenopus Resource Centre. Portsmouth, UK.
WISH in mice was performed as previously described (Andreeva et al. 2012). For sectioned ISH, OCT‐embedded, developmentally staged specimens were serially cryosectioned at 10 μm intervals. E9.5 embryos were sectioned transversely, and E12.5 and E14.5 mouse heads were sectioned coronally. The mouse KCNJ2 cDNA clone was purchased from Open Biosystems (Lafayette CO, USA; clone 8860860). A 518 bp fragment of the 5′ untranslated region of the KCNJ2 cDNA clone was subcloned into PCRII vector (Life Technologies, Grand Island, NY, USA). DIG‐labelled antisense riboprobe was generated using the DIG RNA Labelling Kit (Roche Applied Science, Indianapolis, IN, USA).
Microscopy
Fluorescence microscopy was performed on an Olympus BX‐61 compound microscope with a metal halide illumination source. The microscope was controlled using MetaMorph. For lower magnification/resolution images, a Nikon SMZ‐1500 was used.
Membrane voltage measurement
We measured membrane voltage using the oxonol dye DiBAC4(3) (Epps et al. 1994), DiBAC4(3) paired with CC2‐DMPE (Adams & Levin, 2012) or Oxonol VI (Pouliquin et al. 1999). DiBAC4(3) and Oxonol VI stock solutions were made up at 1.9 mm in DMSO then diluted to 0.9 μm in 0.1× MMR, pH 7.5. CC2‐DMPE was diluted from a 5 mm stock to 5 μm in 0.1× MMR, pH 7.5. Test embryos were allowed to soak in CC2‐DMPE for at least 1 h (when using CC2‐DMPE) then rinsed. Embryos were soaked in DiBAC4(3) or Oxonol VI for at least 30 min prior to imaging, then left in the dye for imaging. CC2 fluorescence was monitored using a filter set of λex 405/20, D 400, λem 460/50. DiBAC4(3) and Oxonol VI were imaged using a filter set of λex 470/20, D 485, λem 520/20. The location of variant expression was recorded by separately imaging the position of the fluorescent protein marker. All images from a given day were made at a single exposure that was set by using as much as possible of the camera's dynamic range, i.e. the widest spread of pixel values possible without under‐ or over‐exposing. Images were darkfield and flatfield corrected prior to measurement of mean intensity using MetaMorph.
Manipulation of images using two dyes was performed as described by Adams & Levin (2012). Briefly, corrected CC2 images are divided by their corresponding DiBAC images. The resulting ratio image is a snapshot of relative V mem across the surface of the embryo, with brighter regions representing more negative cells. A standard analysis of images made using a single dye was performed as follows: two regions of interest (ROI) were established on the corresponding image of the marker (e.g. Fig. 6 E), and ROIs were chosen by thresholding for the brightest 25–30% of pixels (variant expressing cells), or the dimmest (non‐expressing cells); to avoid inclusion of saturated pixels or signal from outside the embryo, regions were further modified by eye as necessary. ROIs were then transferred to the image of the dye fluorescence (e.g. Fig. 6 D). The ROI statistics command was then used to calculate the average intensity of fluorescence (R) from cells within each ROI. R is actually a dimensionless measure of average intensity defined as the pixel value; for 12‐bit images such as these, this value ranges from 0 to 4095. The average of the signals from cells within the construct‐expressing region is then subtracted from the average of the non‐expressing region, the baseline, giving ∆R. ∆R is then normalized to R from the non‐expressing cells. Thus, the final dimensionless measure of V mem is given as ∆R/R. This ratio is inversely proportional to the degree of hyperpolarization of the membrane and can be used to compare among images taken at different times and exposures.
Figure 6. Disruption of the normal regionalization of Vmem domains caused by injection of mRNA encoding D71V .
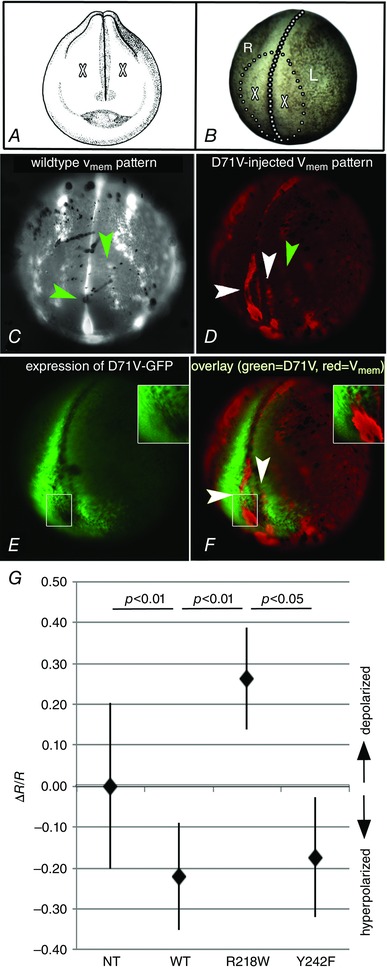
Examples of V mem regionalization in normal and variant injected embryos. During neurulation, Xenopus embryos have a dynamic regionalization of V mem across the ectoderm that is disrupted when variant KCNJ2 is expressed. Green arrowheads indicate normal domains of hyperpolarization (brighter) while white arrows point to abnormal regions of hyperpolarization. The anterior of each embryo is shown, and dorsal is up; the injected embryo is angled slightly to the right. A, drawing from Nieuwkoop & Faber (1994) showing frontal view of a stage 19 embryo. Dorsal is up. The added X's indicate position of cells that will make the eyes. B, brightfield image of a stage 19 embryo in the same orientation as the embryo in C–F. The midline is indicated by large dots, while small dots circle the area that will become the face. A in A, X's indicate the positions of the future eyes. R and L = right and left side of the embryo. C, the normal pattern of V mem variation in a late neurula (stage 19). Brighter indicates relatively hyperpolarized (more negative) while dimmer indicates relatively depolarized (less negative). The upper arrow points to a stripe of hyperpolarized cells found in the region where eyes and olfactory bulbs will form. The lower arrow points to the anterior end of the closing neural tube which is consistently more negative than the surrounding cells. D, the V mem pattern in an embryo injected on the right side with the D71V variant; brighter red reveals cells that are hyperpolarized relative to less bright cells. While expression is mostly on the right side, there is some expression on the left side at the anterior most end of the embryo. The green arrowhead points to a normal region of hyperpolarization, while the white arrowheads indicate two abnormal regions of hyperpolarization, a bend to the right and extra stripe. Inset: diagram showing the stage and orientation of the embryo. E, expression of D71V‐GFP in the same embryo; the dotted line indicates the midline. Note that there are areas within the expression domain of the depolarizing variant Kir2.1 that have much lower expression, or lack expression entirely (inset). F, interestingly, the regions of ectopic hyperpolarization that are present within the overall expression domain of the variant line up with the areas showing low to no expression of the depolarizing variant (white arrowheads and inset). G, relative V mem of ectoderm cells in embryos measured using DiBAC4(3) and Oxonol VI. As predicted, the wild‐type and the gain‐of‐function variant Y242F hyperpolarize while the loss‐of‐function variant R218W depolarizes (Kruskal–Wallis, df = 3, H = 21.34, P < 0.001; Dunn's post hoc as shown; sample sizes were: NT 33 embryos; WT 16; R218W 4; Y242F 7; error bars = standard deviation).
Optogenetics
To establish the use of optogenetics reagents for control of developmental bioelectricity, we designed a new system specialized for long‐term observation and stimulation of Xenopus embryos. Our optogenetics system (Supplementary Fig. S1) is built around a Nikon AZ100 stereomicroscope with a 5× objective. A Spectra 4 four‐colour light engine (Lumencor) with LEDs of 390, 475, 542 and 633 nm is connected by fibre optic cable to the port on the microscope normally used for the fluorescent light source. As light leaves the cable, it passes through an adjustable pinhole that determines the spot size. The light is then further reduced in size and focused onto the specimen by a 5× objective lens. The scope is equipped with a Ludl MAC6000 computer controlled XY stage, allowing repeated illumination of multiple points. An Andor LUCA‐R EMCCD camera sends images to the computer. All these components of the system are controlled by NIS Elements AR software except the brightness of the LEDs, which is controlled by Lumencor software.
To hold embryos in place during light treatments and time‐lapse imaging, we have created a Xenopus embryo‐imaging chip (Akagi et al. 2012) using microfluidics (Fig. S2). The microfluidic device was adapted from a previously reported platform. It consists of a main channel, for medium perfusion, lined with embryo niches, each of which is perforated at its base with a small channel connecting the trap to the main channel; the difference in pressure across the two openings of the niche helps to immobilize the embryo within the niche. Originally designed for zebrafish embryos, the size of the niches, or traps, was modified to accommodate the larger Xenopus embryos. Each trap has a diameter of 1.7 mm and a depth of 1.5 mm. A 1 mm wide vacuum channel, running around the chip, was added to the design to allow for reversible bonding of the trap to a slide or clear plastic sheet. The fabrication of the microfluidic devices was similar to that described by Akagi et al. (2012). Briefly, moulds were laser cut in 1.5 mm thick poly‐methyl methacrylate sheets and used for poly(dimethylsiloxane) (PDMS) moulding (Sylgard 184; Dow Corning Corp., Midland, MI, USA). PDMS was thoroughly mixed with curing agent at a 10:1 ratio, degassed and poured onto the mould and cured at 80°C for 2 h. The devices were trimmed off the moulds and inlet and outlet holes of 3 mm in diameter were punched to allow for embryo loading and medium perfusion. A 1 mm hole was also punched along the vacuum channel. The devices were then reversibly bonded to pieces of transparency sheet by applying suction to the vacuum channels. Tubing of 1 mm inner diameter, connected to the device with barbed‐end adapters, formed a closed‐loop perfusion system. Flow was applied via a Gilson Minipuls Evolution peristaltic pump at a rate of 5–10 ml min−1. To prevent bubble formation during the initial medium filling, the channels were first flushed with ethanol and subsequently washed with 0.1× MMR. The embryos were then loaded one by one into the chip by aspirating them through the tubing from their storage reservoir and along the main channel. Each embryo flows along the main channel until it reaches an empty trap and falls in. The flow then keeps the embryos in their separate niches. Upon completion of the assay, vacuum application was stopped and the film was separated from the PDMS device, allowing for the extraction of the embryos one row at a time.
Statistics
χ2 tests were used to compare the proportion of treated embryos with one or more CFAs or mis‐expressed markers, with the proportion in matched, uninjected embryos and with the proportion in negative controls. For the optogenetic experiments, injected embryos exposed to light were compared with injected embryos kept in the dark. χ2 comparisons were performed using the raw number of tadpoles analysed (replicates pooled); each dish of tadpoles was considered a replicate. Effect size was chosen a priori to be the percentage of CFAs in negative controls plus 10%. Box and whiskers plots describing the data show proportions from replicates; whiskers extend to the 10th and 90th percentiles (see Fig. 4).
Figure 4. Box and whisker plots illustrating the differences in proportions of CFAs resulting from injections of different mRNAs .
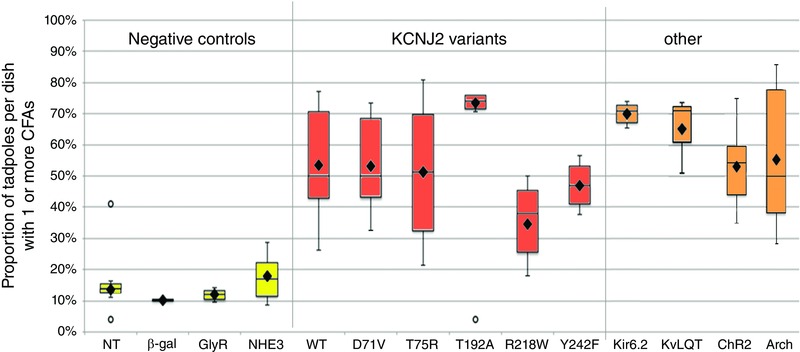
Box plots show median and 1st and 3rd quartiles; the whiskers extend to the 10th and 90th percentiles; the dot indicates the mean. Controls are shown in yellow, KCNJ2 variants in red and other translocators in orange. None of the control mRNAs (β‐gal, GlyR, NHE3) caused a meaningful increase in the proportion of CFAs; the mean proportion of CFAs in negative controls was 14%. All the variants of KCNJ2 caused greater than 30% of tadpoles to develop CFAs, well above our threshold of 24% for biological significance; all of these differences were highly significant (Table 3). Two other potassium channels, Kir6.2 (KCNJ11) and KvLQT (KCNQ1), plus a light‐activated cation channel (ChR2‐D156A) and a light‐activated hydrogen ion pump (Arch) likewise caused meaningful increases in the proportion of tadpoles developing CFAs.
Results
We first examined endogenous expression patterns of KCNJ2 in Xenopus and mouse embryos. We found that in stage 14 (neural plate stage) Xenopus embryos, KCNJ2 is expressed in a broad dorsoanterior area, but is excluded from the midline and two roughly circular regions lateral to the midline at the anterior end, roughly coincident with the position of Pax6 expression (Fig. 2 A). By stage 17 (late neural fold stage), expression is clear on both sides of the anterior neural folds (Fig. 2 B, green arrows), approximately overlapping slug expression domains. In many samples, there appeared to be a second region of expression posterior to the future head, at the approximate level of the future second pharyngeal cleft (Fig. 2 B, orange arrow). By stage 27 (early tailbud), there is clear expression in the somites (Fig. 2 C), while expression in the head is no longer clearly distinguishable from sense strand controls (insets in Fig. 2 B and C). To confirm that there is a similar localization in mammals, we examined murine embryos. In mice, KCNJ2 is expressed in a punctate pattern lateral to the neural folds, and at the midline, at stage E8.5 (Fig. 2 D). By E9.5 staining in developing somites is visible (Fig. 2 E), and sections show expression in the frontonasal process (Fig. 2 F). In WISH at stage E10.5 there is high expression in the mandible particularly in the posterior region where the mandible contacts the maxilla and in the mandibular process (Fig. 2 G). In sections at stage E12.5, staining is obvious in the mandibles and in the palatal shelves (Fig. 2 H). By E14.5, after fusion of the palatal shelves, staining is strongest at the tip of the nasal cavity (Fig. 2 I). We also find KCNJ2‐positive cells in the condensing mesenchyme and cartilage of the developing anterior limb (Fig. 2 J). This is consistent with the phenotype of KCNJ2 −/− mice, which have cleft palate (Zaritsky et al. 2000) and with the jaw phenotypes seen in ATS patients. We conclude that in both frog and mouse, KCNJ2 is present at a time and place consistent with a role in craniofacial patterning.
Figure 2. WISH for KCNJ2 in Xenopus and mouse embryos .
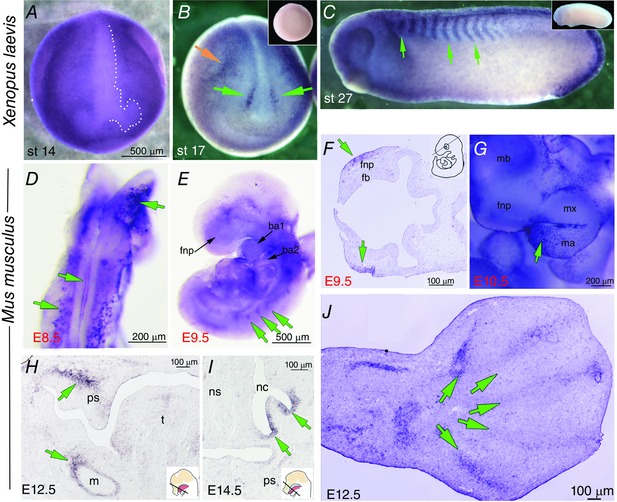
Species are indicated on the left. A, a dorsal‐anterior view of a stage 14 Xenopus embryo dehydrated in methanol following fixation. The KNCJ2 signal is much lighter in the midline and two oval areas on either side at the anterior end, the area outlined by white dots. B, a neurulating Xenopus embryo showing KCNJ2 signal on the anterior neural folds (lower green arrows). Upper green arrow points to expression at the approximate position of the second pharyngeal cleft. Inset is sense strand control. C, stage 27 Xenopus embryo showing strong KCNJ2 staining in the somites (green arrows). Inset is sense strand control. D, in situ hybridization of KCNJ2 mRNA expression in an E8.5 mouse embryo (dorsal view of whole‐mount embryo). KCNJ2 mRNA is detected in the midline of the fusing neural tube, and in a punctate bilateral expression pattern lateral to the midline and in anterior neural tissues (green arrows). E, lateral view of whole‐mount embryo at E9.5 showing KCNJ2 mRNA expression in the craniofacial region including the frontonasal prominence (fnp) and branchial arches 1 and 2, and in the forming somites (green arrows). F, sectioned ISH of E9.5 mouse embryo revealed KCNJ2 expression in the epithelium of the frontonasal prominence (fnp) (green arrows). A schematic in the right top corner indicates the approximate plane of section. G, lateral view of whole‐mount embryo craniofacial region at E10.5 revealed KCNJ2 expression in the frontonasal prominence (fnp), in the mandibular process (ma) (green arrow) including along the border with the maxillary process (mx). H and I, sectioned ISH revealed KCNJ2 mRNA expression in neural crest‐derived mesenchymal cells of the palatal shelves (ps), in mesenchymal cells surrounding the developing Meckel's cartilage (m) and in the olfactory epithelium of nasal cavity (nc) in E13.5 (H) and E15.5 (I) embryos (green arrows). Inserts adapted from d'Amaro et al. (2012). J, at E12.5 KCNJ2 mRNA was detected in condensations of the developing forelimb digits (green arrows). Abbreviations: ba1, branchial arch 1; ba2, branchial arch 2; fb, forebrain; fnp, frontonasal prominence; m, Meckel's cartilage; mb, midbrain; ma, mandibular process; mx, maxillary process; nc, nasal cavity; ns, nasal septum; ps, palatal shelf; t, tongue.
To test the functional role of ATS‐associated KCNJ2 variants in our frog model, we also injected wild‐type (WT) constructs as an additional gain of function test; the full list of reagents made and used is given in Table 1. We titred each mRNA construct to a concentration that minimized but did not universally prevent lethality, and thus we had an internal control for protein activity. Paired uninjected and mRNA‐injected embryos were raised to stage 45, and then scored for the presence of CFAs (Fig. 3); only otherwise‐normal embryos were counted. Each tadpole was counted once and assigned a category of: normal, CFA positive or unscorable. Four other constructs were tested: another dominant‐negative potassium channel variant (Kcnq1‐Y101C‐V244M); another dominant negative potassium inward‐rectifying channel variant (Kcnj11‐K185Q); and two optogenetic reagents, ChR2‐D156A, a light‐activated cation channel, and Arch, a light‐activated hydrogen pump (see Table 1).
Figure 3. Tadpole craniofacial anomalies caused by injection of mRNA for KCNJ2 variants .
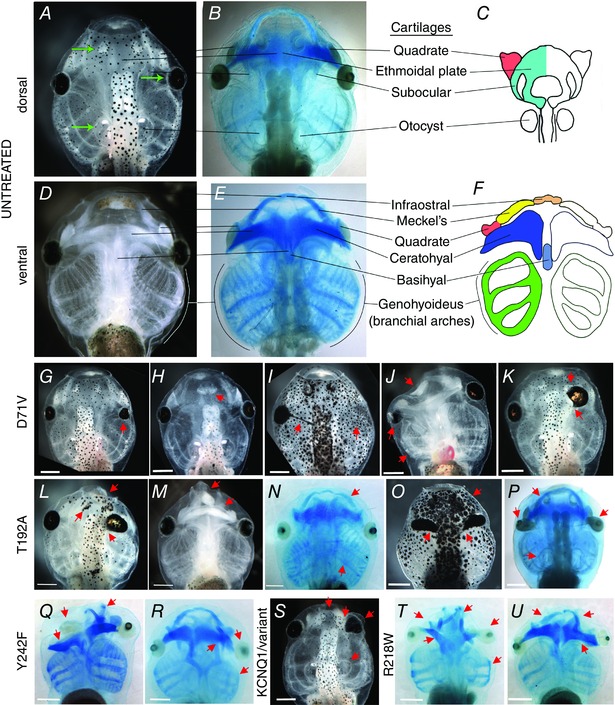
Anterior is up in all panels; view is dorsal except in D–F, J, M, Q and U. All scale bars = 0.5 mm. A‐F, normal wildtype head of the stage 46 tadpole. A and D, darkfield; B and E, Alcian blue staining; C and F, after Reisoli et al. (2010). G–U, both the range of phenotypes seen and the commonality of the phenotypes resulting from all the variants tested. G–K, heads of tadpoles that were injected with the dominant negative Kcnj2 variant D71V. Illustrated are typical anomalies: G, small eye; H, fusion of the two olfactory bulbs; I, pigmented optic nerve and missing eye; J, anomalies restricted to one side include a small misshapen eye with misplaced lens, grossly undersized branchial arches and malformed Meckel's cartilage; K, fusion of the brain eye and olfactory bulb on the right side. L–P, heads of tadpoles injected with T192A. L, the leftmost arrow points to a malformed olfactory bulb, while the other two arrows point to the same anomalies seen in D71V‐injected tadpoles J and K, namely malformed Meckel's cartilage and fusion of the brain with the eye. M, another commonly seen malformation is the narrowing of the anterior most end with malformed or absent infraostral and Meckel's cartilages. N, an example of a more subtle phenotype of differences in size of Meckel's cartilages and the branchial arches. O, a commonly seen eye phenotype, shown in an tadpole with bilateral anomalies. In these tadpoles the optic nerve is both pigmented and thickened, looking like an extension of the eye. This embryo also has a malformed olfactory bud. P, this embryo shows the same inequality of Meckel's cartilages seen in N, combined with gross malformations of both eyes. The otic capsule is also misshapen in this tadpole. Q and R, tadpoles expressing the Y242F variant. Q, the ceratohyals of this tadpole are badly distorted, while at least one of Meckel's cartilages is located in the wrong place. The right eye of this tadpole lacked a lens. R, a more subtle effect of Y242F showing distorted ethmoidal plate, a badly positioned eye, and, like the D71V tadpole in J, small branchial arches on one side. S, similar phenotypes are caused by injection of a different potassium channel, including abnormal narrowing anteriorly and concomitant loss of Meckel's cartilages and probably the infraostral cartilage, fusion of the olfactory bulb and eye, misshapen eye, and a misshapen otic capsule, like the T192A‐injected tadpole in P, which lacks an otolith. T and U, tadpoles grown from R218W‐injected embryos. T, this tadpole has distorted Meckel's cartilages and quadrate, malformed eyes, malformed ethmoidal plate, and small branchial arches on one side. U, deformed Meckel's and ceratohyal cartilages, one bad eye and small branchial arches, resulting from R218W injection as well as injection of the other variants.
Three negative controls were performed, by injections of mRNA encoding: GFP3; β‐gal; GlyR (an inactive Cl− channel); and SLC9A3 (Nhe3), an electroneutral sodium–hydrogen exchanger. Averaging the proportions of CFAs among the controls, we determined a background level of 14% CFA‐positive embryos, thus establishing 24% (14% background +10% additional effect decided a priori) as the threshold for a biologically meaningful effect (Fig. 4). Although we observed a higher percentage of CFAs in control‐injected embryos compared with untreated embryos, the increase was neither biologically meaningful by our standard nor statistically significant (Table 3).
Table 3.
Statistical comparisons of craniofacial anomalies in treated and control tadpoles
| Induced craniofacial anomaly data | |||||||
|---|---|---|---|---|---|---|---|
| Variant injected | N ctrl | N exp | reps | % ctrl | % exp | χ2 | P |
| Negative controls compared with matched uninjected controls | |||||||
| β‐gal | 74 | 166 | 2 | 4 | 10 | 2.57 | 0.109 |
| GlyR | 60 | 123 | 2 | 10 | 12 | 0.19 | 0.662 |
| SLC9A3 (NHE3) | 131 | 282 | 7 | 14 | 17 | 0.72 | 0.397 |
| Experimentals compared with matched uninjected controls | |||||||
| Kcnj2‐WT (Kir2.1) | 167 | 222 | 3 | 9 | 68 | 138 | <0.001 |
| ‐D71V | 644 | 736 | 22 | 8 | 60 | 403 | <0.001 |
| ‐T75R | 129 | 198 | 2 | 7 | 59 | 88 | <0.001 |
| ‐T192A | 299 | 256 | 6 | 4 | 29 | 32 | <0.001 |
| ‐R218W | 292 | 224 | 3 | 3 | 31 | 76 | <0.001 |
| ‐Y242F | 117 | 51 | 2 | 2 | 43 | 50 | <0.001 |
| Kcnj11‐K185Q (Kir6.2) | 114 | 113 | 3 | 2 | 68 | 107 | <0.001 |
| Kcnq1‐Y101C‐V244M (KvLQT) | 71 | 117 | 2 | 23 | 45 | 9.86 | 0.002 |
| Experimentals compared with pooled negative controls | |||||||
| Kcnj2‐WT (Kir2.1) | 571 | 222 | 14 | 68 | 268 | <0.001 | |
| ‐D71V | 571 | 736 | 14 | 60 | 332 | <0.001 | |
| ‐T75R | 571 | 198 | 14 | 59 | 183 | <0.001 | |
| ‐T192A | 571 | 256 | 14 | 29 | 23 | <0.001 | |
| ‐R218W | 571 | 224 | 14 | 31 | 40 | <0.001 | |
| ‐Y242F | 571 | 94 | 14 | 54 | 100 | <0.001 | |
| Kcnj11‐K185Q (Kir6.2) | 571 | 113 | 14 | 68 | 184 | <0.001 | |
| Kcnq1‐Y101C‐V244M (KvLQT) | 571 | 117 | 14 | 45 | 76 | <0.001 | |
| Experimentals compared with experimentals held in the dark | |||||||
| ChR2 + light | 136 | 327 | 14 | 26 | 38 | 6.63 | 0.010 |
| Arch + light (st 11–14) | 144 | 208 | 12 | 32 | 44 | 4.99 | 0.026 |
| Arch + light (st 20–24) | 31 | 30 | 1 | 13 | 13 | .002 | 0.960 |
N ctrl, control sample size; N exp, experimental sample size; reps, replicates; % ctrl, percent of control animals with one or more CFAs; % exp, percent of treated animals with one or more CFAs; x2, value of chi‐squared; p, probability of false positive.
The most common abnormalities found were of the eye, jaws and branchial arches (Fig. 3). Eyes were found to be small or misshapen (Fig. 3 G, I–L, O–Q, S), frequently having a non‐circular cross section, and even connecting directly to the brain (Fig. 3 K, L, O). The optic nerve was also found to be pigmented and in some cases grossly increased in diameter, making the eye appear cylindrical (Fig. 3 I, L, O). Jaws were found that had malformed individual elements, such as small or bent Meckel's cartilage (Fig. 3 J, K, M, N, P), as well as having individual cartilages incorrectly arranged with respect to one another (Fig. 3 Q, T).
Each variant tested gave rise to each of the common phenotypes described above. Careful analysis revealed no conspicuous correlations between variant type and abnormality or affected structure. We found that all of the Kcnj2 variants caused large and significant increases (the smallest change was a doubling of the proportion; P ≤ 0.002 in all cases) in the proportion of CFA‐positive tadpoles, as did two additional constructs that are known to affect V mem: Kir6.2 and KvLQT (Fig. 4, Table 3). The two optogenetic reagents caused higher proportions of the same suite of CFAs, although the proportions caused by Arch were significant only at somewhat lower stringency: light‐exposed Arch‐injected tadpoles had 44% affected, compared with 32% of dark‐maintained (P = 0.026; Table 3). We conclude that induced overexpression of WT Kcnj2 and expression of all five variants tested causes CFAs in Xenopus tadpoles. Moreover, and importantly, these CFAs are found in the same lineages as those affected in humans, i.e. in organs descended from cranial neural crest cells and placodes. Controls show that this is not due to injection of mRNA, expression of non‐Xenopus genes or expression of electroneutral ion channels, i.e. those that do not change V mem.
To determine whether other aspects of ATS besides craniofacial defects would also be recapitulated in Xenopus, and whether identifying additional effects would be useful as positive controls in variant expression experiments, we examined muscle. Because there is no established assay for periodic paralysis in this model system, we explored whether the somite‐specific expression of KCNJ2 (Fig. 2 C) might lead to structural abnormalities in variant‐expressing muscles. Using polarized light microscopy to gauge the structure of the chevrons and the organization of muscle fibres in the tail, we found that in some variant‐injected tadpoles abnormal organization appeared in the cells expressing the variant (Fig. 5 A–C). Examining D71V‐injected tail ultrastructure using immunohistochemistry, we also found that the organization of fibronectin is highly disrupted (Fig. 5 D–G). We found similar changes to structure in two other variants, evidenced by the disruption both to the chevron shape and to fibre orientation (Fig. 5 H–L). Given that an additional tissue that is found to be abnormal in ATS patients is also abnormal in Xenopus, we reaffirm our conclusion that Xenopus tadpole development is an appropriate model for the study of the mechanisms of CFAs and other diverse phenotypes associated with ATS.
Figure 5. Skeletal muscle phenotype caused by injection of mRNA for variant KCNJ2 .
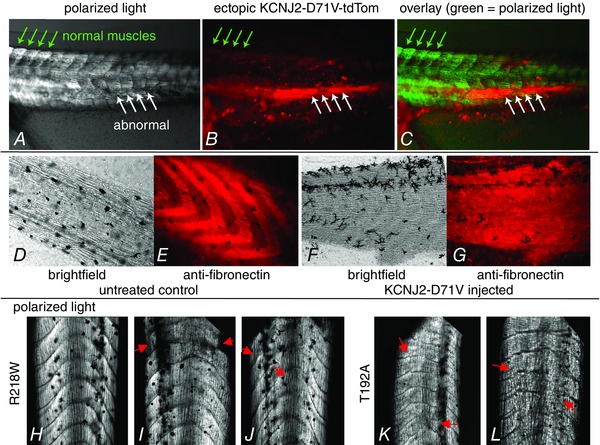
Images of the skeletal muscle phenotypes observed in injected tadpole tails; in A–C anterior is to the left and dorsal is up, in D–G anterior is to the right and dorsal is up and in H–L anterior is up. A, live tadpole tail imaged using polarized light. Normal muscles, indicated by the green arrows, yield clear, organized, light patterns. In contrast, abnormal muscles are obviously disordered. B, expression of D71V‐tdTomato in the same tail. C, overlay of A and B shows the overlap of variant KCNJ2 expression with the position of abnormal muscle structure, and its absence from the normal muscle (now pseudocoloured green). D–G, a comparison of the organization of fibronectin in normal tails versus tails injected with variant KCNJ2 lacking a fluorescent protein. In the injected animal (F, G) the normal pattern of expression has been severely disrupted, although the muscles look normally organized in brightfield. H, polarized light image of an R218W‐injected animal that nonetheless shows normal organization of the tail muscles. I and J, tails from R218W‐expressing tadpoles show characteristic alterations to the normal chevron pattern of the muscle blocks. Red arrows indicate especially large deviations. K and L, tails from T192A‐expressing tadpoles also display the same types of deviations from the normal morphology, illustrating a similarity of muscle phenotypes that parallels the similarity of CFAs induced by different variants.
To test whether expression of variant potassium channels could affect the pattern of V mem regionalization in the developing face (Fig. 6 C), we imaged V mem in neurula stage embryos expressing D71V. Fluorescent protein tags or co‐injected lineage tracer revealed the location of the ectopically expressed channel proteins, while the V mem reporting dye pair CC2‐DMPE and DiBAC3(4) was used to monitor resting voltage (Adams & Levin, 2012). We found that in D71V‐expressing embryos, the normal pattern of hyperpolarization was altered (compare Fig. 6 D to 6 C). In the example shown, the stripe of hyperpolarization normally found to the right of and parallel to the neural tube is missing (Fig. 6 D) in the region where the depolarizing variant D71V is expressed (Fig. 6 E). Note, however, that small groups of cells within the overall domain of D71V expression lacked green fluorescence (e.g. Fig. 6 E inset); remarkably, these cells, which are depolarized in a normal embryo and would be depolarized by any D71V present, were found to be hyperpolarized, (Fig. 6 F and inset). We interpret this as consistent with the hypothesis that Kir2.1 variants affect developmentally regulated V mem patterns and that they can act both cell‐autonomously and in adjacent cells. To confirm that other variants can also affect V mem, we used DiBAC4(3) and Oxonol VI to look at V mem in embryos injected with variants. We found that expression of WT, R218W and Y242F all caused the changes in V mem predicted by published electrophysiological measurements done in oocytes (Fig. 6 G; Tristani‐Firouzi et al. 2002; Hinard et al. 2008). For the remainder of the experiments, we focused our efforts on a deeper examination of the D71V loss of function and the WT gain of function.
To determine if there is a link between this ion flux‐dependent pathway and the genetic pathways known to regulate craniofacial development, we examined expression patterns of key markers of neural crest and placodes in injected embryos, including Fgf8, Six1, Pax2, Sox3, Fz3, Slug, Sox10, Otx2, FoxE4 and Pax6 (Sanchez‐Martin et al. 2002; Bhattacharyya et al. 2004; Heeg‐Truesdell & LaBonne, 2004 a,b; Zilinski et al. 2004; Liu et al. 2006; Vernon & LaBonne, 2006; Zaghloul & Moody, 2007; Wahlbuhl et al. 2012; Zhang et al. 2012; Wong et al. 2013; Chen et al. 2014; Garcez et al. 2014; Klimova & Kozmik, 2014). We found disruption of the normal patterns of all the markers we tested (Supplementary Fig. S3; see Fig. 7 for a representative subset) in embryos expressing variant D71V and WT (Table 4). D71V led to biologically meaningful and statistically significant increases in mispatterning of Otx2 and Six1, and, at a slightly lower level of statistical significance, Sox3. WT led to changes in FoxE4 and Otx2. In the same way that we found instances of each of the variants causing each of the phenotypes, and were unable to discern any correlations between particular variants and specific dysmorphias, we found that both increases and decreases in gene expression domains could be caused by either of the variants (Fig. 7 B). Given the wide variety of effects seen, our data are consistent with the hypothesis that V mem variation can affect craniofacial gene expression patterns. Moreover, our findings are consistent with other studies showing that hyperpolarization and depolarization of V mem can both cause the same morphological abnormalities (Jurkat‐Rott et al. 2010; Vandenberg et al. 2011; Pai et al. 2012). Figure 8 A is a diagram illustrating how a gradient such as membrane potential can regulate downstream effectors in a narrow band of operating parameters, so that those effectors would be inhibited by a change in either direction from the optimum. Specifically, transmembrane proteins and enzymes that transduce a voltage signal into a biochemical signal have membrane voltage optima at which they function; both hyperpolarization and depolarization impair functionality of the downstream cascades. Thus, because V mem acts through downstream biochemical effectors, such as gap junctions, voltage‐sensitive phosphatases, serotonin transport and voltage‐gated channels, among others, deviations from normal, in either direction, cause the same ultimate morphological abnormalities.
Figure 7. Whole‐mount ISH for well‐known markers of craniofacial development in embryos injected with mRNA encoding D71V .
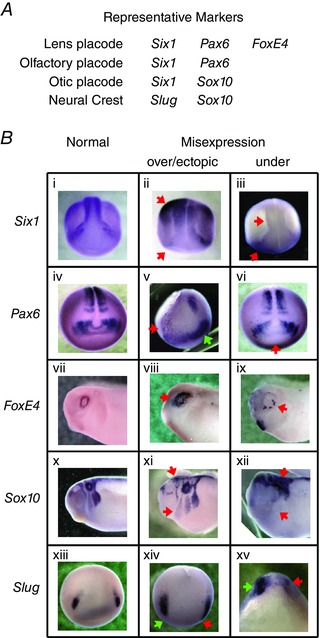
Shown is a subset of the WISHs performed (see also Supplementary Fig. S3). This set represents at least two markers each of the relevant tissues, i.e. neural crest and the three placodes studied. A, chart showing locations of marker expression. B, normal (1st column), over‐expressed (2nd column) and under‐expressed (3rd column) examples from each of five representative markers. Red arrows point to positions of abnormal signal patterns; the green arrow in v points to normal expression on the side opposite the disrupted pattern. The patterns we saw, even in injected embryos that did not have significantly more misexpression than background, are consistent with incorrect or incomplete differentiation (ii, iii, v, vi, viii, ix) and anomalies in neural crest migration (xi, xii, xiv, xv). To date, we have not detected any correlation between the types or magnitudes of disruptions caused and the identity of the ion flux‐perturbing construct injected.
Table 4.
Statistics comparing prevalence of mispatterned markers in treated and control embryos
| Gene misexpression data | ||||||||
|---|---|---|---|---|---|---|---|---|
| Variant injected | Probe | N ctrl | N exp | reps | % ctrl | % exp | χ2 | P |
| Experimentals compared with uninjected controls | ||||||||
| ‐D71V | ||||||||
| FoxE4 | 100 | 128 | 4 | 15 | 23 | 2.5 | 0.112 | |
| Otx2 | 84 | 123 | 5 | 4 | 19 | 10.4 | 0.001 | |
| Pax6 | 83 | 105 | 3* | 6 | 12 | 2.2 | 0.141 | |
| Six1 | 174 | 30 | 3* | 13 | 43 | 17.0 | 0.001 | |
| Slug | 68 | 83 | 3* | 13 | 22 | 1.8 | 0.178 | |
| Sox3 | 85 | 50 | 3* | 8 | 20 | 4.0 | 0.047 | |
| KCNJ2‐WT | ||||||||
| FoxE4 | 100 | 70 | 4 | 15 | 34 | 8.7 | 0.003 | |
| Otx2 | 84 | 12 | 3* | 4 | 42 | 19.9 | <0.001 | |
| Pax6 | 83 | 73 | 3* | 6 | 10 | 0.7 | 0.404 | |
| Six1 | 174 | 30 | 3* | 13 | 0 | 4.3 | 0.039 | |
| Slug | 68 | 11 | 3* | 13 | 27 | 1.4 | 0.229 | |
| Sox3 | 85 | 24 | 3* | 8 | 17 | 1.5 | 0.226 | |
*Where not known, replicate number was estimated using the lab standard practice of three samples of 30 each, at a minimum. N ctrl, control sample size; N exp, experimental sample size; reps, replicates; % ctrl, percent of control animals with one or more CFAs; % exp, percent of treated animals with one or more CFAs; x2, value of chi‐squared; p, probability of false positive.
Figure 8. CFA induction .
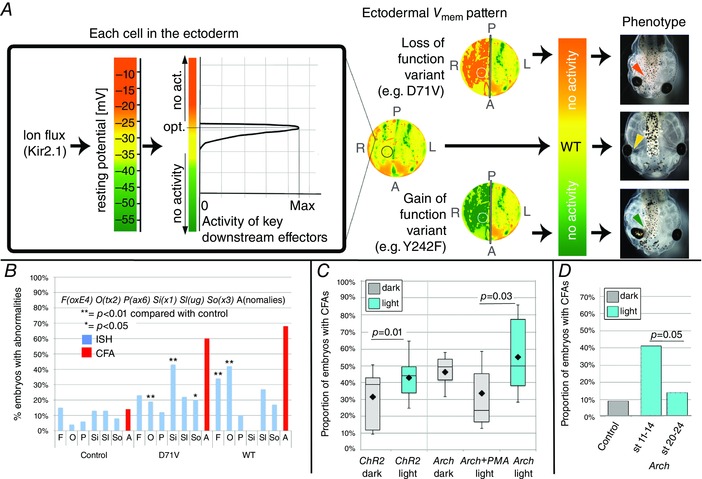
A, diagram illustrating our hypothesis about how either depolarizing or hyperpolarizing a cell membrane away from the optimal V mem for the downstream effectors can lead to the same effect on phenotype. In every cell membrane, flux through ion channels, such as Kir2.1, or pumps sets the resting potential of the membrane. V mem influences downstream effectors by affecting activity levels, in much the same way that temperature influences protein activity, and deviation from the optimum lowers activity. The example in this graph shows an effector that works optimally at a V mem we have assigned the colour yellow, and drops off rapidly either above or below that value. The embryo‐wide distribution of all of the cells’ V mem values (e.g. Fig. 6 C) is the regionalization that we call the ‘electric face’. To illustrate how gain‐ and loss‐of‐function variants, acting in a subset of individual cells, might disrupt the wild‐type pattern and lead to dysmorphia, we have schematically represented changes to ‘V mem’ by using Photoshop to artificially change the colours that represent the different V mem values. The three circular representations of embryos are pseudocoloured copies of the wild‐type embryonic V mem pattern shown in Fig. 6 C. The first is the wild‐type pattern. The upper illustration represents how inhibition of Kir2.1 on the right‐hand side would result in depolarization of that side, as represented by orange, while the lower represents hyperpolarization (green) due to gain of Kir2.1 function. On each of the three schemes is a circle indicating the position of the cells that will form the area between the right eye and the brain. The lack of signalling by downstream effectors in these regions leads to abnormal morphology of the tadpole; the hyperpolarized and the depolarized conditions give rise to the same phenotype because both changes move the V mem out of the range that permits protein activity. The micrographs at the far right side are photos of actual tadpoles that were treated as indicated: the top tadpole was injected with the loss‐of‐function variant D71V, the bottom with the gain‐of‐function variant Y242F. B, a comparison of the proportion of D71V and WT injected tadpoles with misexpressed patterning genes (blue bars), versus the proportion with CFAs (red bars). Data on abnormal WISH patterns were pooled, and thus blue bars represent totals (see Table 4 for statistics); CFAs were counted for each of the biological replicates separately, and therefore the red bars represent means. Only three expression patterns were found to be significantly affected by expression of a variant, Otx2, Six1 and FoxE4 (Table 4). The number of CFAs was found to exceed the number of cases of misexpression of any single patterning gene. C, optogenetics can be used to manipulate V mem. Expression of the light‐activated cation channel ChR2‐D156A causes a higher number of CFAs when injected embryos are exposed to blue light. Because we found evidence that Arch depolarizes in the dark, we compared Arch in the light to the results of pairing Arch with the constitutively active H+ pump PMA1, a protocol that reduced the dark phenotype. Box plots as in Fig. 4. D, optogenetics can be used to explore the timing of important electrophysiological events. Exposure to light causes an increase in the number of CFAs in embryos expressing Arch only if exposure occurs during early neurulation. The same exposure at later stages has no effect on craniofacial morphology (Table 3).
To gain further insight into the steps leading from bioelectric regulation to morphology, we next compared the numbers of embryos injected with D71V (loss of function) or WT that developed a significant number of abnormal WISH patterns to the number of embryos that developed CFAs (Fig. 8 B). We found that D71V caused mispatterning of the anterior neural fate and placode markers Otx2 and Six1, (Ahrens & Schlosser, 2005; Ogino et al. 2008; Christophorou et al. 2009; Steventon et al. 2012), and Sox3, a pharyngeal pouch marker (Rizzoti & Lovell‐Badge, 2007), suggesting an effect on neural crest. WT KCNJ2 injection caused mispatterning of Otx2 and FoxE4, the latter a marker of the lens placode (Schlosser, 2006). However, both variants cause a higher frequency of CFAs than can be explained by the frequency of misexpression of a single patterning gene. We interpret these data to indicate that use of any single one of the definitive markers in this field underestimates the effect on morphogenesis and that the transcriptional consequences of bioelectric pattern change can vary among affected individuals.
We next tested the spatial requirements for correct V mem in normal craniofacial patterning. Because variant channels expressed from injected mRNA cannot be regulated experimentally, we used optogenetics to take control of the spatial location of K+ flux in vivo. We injected mRNA encoding Channelrhodopsin2‐D156A (ChR2‐D156A), a blue‐light‐activated cation channel (Lin et al. 2009) into embryos, then, with a custom‐made apparatus for holding embryos (Supplementary Figs S1 and S2), we exposed embryonic regions to the desired optical stimulation. Because light cannot penetrate to the interior of the opaque embryo, only channels expressed in the outermost layer of cells – the ectoderm – can be activated. This treatment caused a significant increase in the number of CFAs relative to both the untreated and the dark‐raised injected controls (Fig. 8 C); uninjected embryos were unaffected by the light regimens used here (data not shown). These data suggest that abnormal ion flux only in the ectoderm is sufficient to cause CFAs. This is consistent with our hypothesis that changes to ectodermal V mem contribute to the CFAs of ATS because both neural crest and placodes originate in the ectoderm.
We next exploited optogenetics to explore the timing of when K+ flux is important for craniofacial patterning. For these experiments we used the optogenetic reagent Archaerhodopsin (Arch), a light‐activated H+ pump (Chow et al. 2010). We have previously shown that Arch hyperpolarizes early blastomeres of Xenopus, using electrophysiology; we have also shown that it is active when expressed in Xenopus tadpoles, by comparing the pH of Arch‐expressing cells under strongly versus weakly activating wavelengths (Adams et al. 2013). Those data revealed that in the presence of activating wavelengths, Arch indeed hyperpolarizes Xenopus cells. In addition, we had to address another aspect of Arch's activity: electrophysiological recording data suggested that in the dark, Arch‐expressing embryos were depolarized relative to untreated embryos (Adams et al. 2013), and indeed control experiments showed that this pump caused CFAs even when embryos were kept in the dark. We therefore theorized that Arch might be running in reverse when in the dark. To test this idea, we co‐injected arch mRNA with mRNA for the hyperpolarizing, constitutively active yeast H+‐exporting pump pma1.2. If Arch was importing H+ in the dark, then in the dark the two activities should balance each other and CFAs would not appear. Indeed, that is what we found (Fig. 8 B). We concluded from those experiments that Arch may actively pump H+ into the cell when it is in the dark, and that inward flux is balanced by efflux due to Pma1.2. When exposed to light, however, Arch‐injected embryos had more CFAs than control embryos (Table 3; Fig. 8 B).
Once we had determined how to prevent the Arch dark phenotype, we examined timing. We exposed some Arch+pma embryos to light during late‐gastrula/early‐neurula stages and others during tailbud stages, then compared the effect of the light treatment on structures derived from ectodermal cells that were exposed during both time periods. Only the embryos exposed early developed CFAs, indicating a role for V mem during the early stages of craniofacial patterning (Table 4; Fig. 8 D).
To further test whether the effect on craniofacial development was due to modulation of K+ flux or if it was specific to Kir2.1, we injected mRNA encoding a variant version of another inwardly rectifying potassium channel, Kir6.2 (KCNJ11‐K185Q, hyperactive) and of a voltage‐gated potassium channel KvLQT [KCNQ1‐Y101C‐V244M, dominant negative (DN)]. Both of these constructs caused the same suite of CFAs (Table 3). We conclude that craniofacial patterning relies on the KCNJ2 gene because of the bioelectrical state induced by K+ flux, not due to another function of the Kir2.1 protein. Because both of our optogenetic manipulations vary membrane potential without changing Kir2.1 activity, and because Arch changes H+ flux, we interpret these data as consistent with the hypothesis that V mem is the relevant parameter for regulating the events of developmental craniofacial patterning.
Discussion
Overview: bioelectricity as an endogenous component of craniofacial patterning
While cardiac arrhythmias in ATS have a clear basis in electrophysiology of the heart, the developmental patterning defects (CFAs) associated with ATS had been unexplained. Here we present evidence for the first proposed mechanism by which variants in the inward‐rectifying potassium channel KCNJ2, the genetic basis of 60% of ATS cases, can lead to morphological anomalies. We first confirmed expression of Kir2.1 in the developing face in both Xenopus and mouse. Next, we found that Kir2.1 activity contributes to creating the endogenous pattern of V mem regionalization (the bioelectric face prepattern) during early neurula stages. This regionalization precedes and functionally regulates the gene expression domains known to pattern the neural crest and placodes. We further demonstrate that it is V mem, rather than some other function of Kir2.1, that is the critical parameter for establishment of correct craniofacial anatomy. Finally, using optogenetics, we showed that it is changes in the resting voltage of ectodermal cells during neural plate stages that lead to CFAs. These data link biophysical and genetic pathways to provide a mechanistic explanation for the human craniofacial dysmorphias caused by Kir2.1 channel malfunction.
Control of bioelectric cell states by the Kir2.1 ion channel
Injection of mRNA encoding ATS‐associated variants of KCNJ2 into Xenopus embryos perturbed the normal bioelectric face pattern. V mem reporter dyes showed that cells expressing the dominant negative D71V were depolarized relative to non‐expressing cells, consistent with our predictions. That imaging also confirmed that Kir2.1 can affect V mem in undifferentiated cells; that is, its function does not depend on its being located in an excitable cell. Interestingly, we also found that cells adjacent to the depolarized D71V‐expressing cells were hyperpolarized relative to the normal pattern. Because the effect on V mem in these cells was in the opposite direction to that produced by the dominant negative variant, we exclude the possibility that nearby cells are expressing the variant protein at a level too low to detect. One possible explanation involves physiological regulatory loops implemented by voltage‐gated ion channels and electrical synapses (Levin, 2013), which could induce nearby cell resting potential to change when the voltage of injected cells was perturbed. The effect of depolarized D71V‐expressing cells could be on the expression or activity of hyperpolarizing channels, ion transporters or gap junctions in the adjacent cells, and may represent another example of non‐cell‐autonomous bioelectric signalling, recently described for tumour formation (Chernet & Levin, 2014; Chernet et al. 2014), brain patterning (Pai, 2015 a,b), and neural network reorganization (Ye et al. 2015). Note that non‐cell‐autonomous signalling by bioelectric and chemical pathways adds a further layer to the importance of a correct pattern that can be disrupted by either depolarization or hyperpolarization, as the relative difference in V mem among cell groups is also an important instructive factor.
In addition to affecting V mem autonomously and in neighbouring cells, abnormal KCNJ2 activity affects transcription: we find that expression of KCNJ2 variants disrupts the expression domains of genes known to be functional drivers of face patterning (Table 4, Fig. 7, Supplement Fig. S3). Using optogenetics, we were able to narrow down the timing of V mem’s importance to early during neurulation (Fig. 8 D), and show that changing the V mem of only the ectoderm is sufficient to cause the CFAs. Our interpretation of this evidence is that the pattern of V mem regionalization in the anterior ectoderm and developing face is critical for normal morphogenesis; disrupting K+ flux, as happens in human ATS embryos, can change that pattern and thus lead to CFAs in cranial neural crest and placode lineages.
Bioelectric pattern regulates development: endogenous voltage distributions
Using KCNJ2‐independent methods of altering resting potential, we demonstrate that it is V mem control, not some other protein‐specific function of Kir2.1, that is the critical parameter for face morphogenesis. Our data on Arch phenotypes are consistent with previous results showing that manipulation of V mem by alteration of H+ flux also causes CFAs and disrupts expression patterns of relevant genes (Vandenberg et al. 2011). This is also critical evidence of the importance of V mem rather than the chemical activity of one ion, or a particular ion channel gene product, and consistent with other craniofacial defect syndromes that result from chloride (Homanics et al. 1997) or sodium (Chong et al. 2015) channelopathies. Thus, we propose that the endogenous pattern of physiological gradients necessary for normal craniofacial development is mediated by KCNJ2 and other channels; however, the necessary‐and‐sufficient trigger for cell behaviour during correct or abnormal pattern formation is not a specific gene product but a physiological state – the distribution of resting potentials that can, in principle, be modulated by several means.
Consistent with the importance of specific V mem patterns, we found that broad misexpression of either depolarizing or hyperpolarizing channel constructs caused the same suite of CFAs. We interpret this to mean that there are specific ranges of V mem within which the downstream effectors can operate properly – a situation that has been observed not only in the case of sodium channels in muscle (Jurkat‐Rott et al. 2010) but also in canonical biochemical signalling via such embryonic signalling pathways such as Notch, BMP, Sonic hedgehog and FGF (Shi et al. 2009; Hori et al. 2013; Ren & Ambros, 2015). Pushing cells out of that zone, in either direction, disturbs the tightly orchestrated ion flux‐dependent events of morphogenesis. We show here that broad misexpression of a functional channel variant does indeed disrupt the endogenous spatial pattern of differential V mem. This phenomenon, where a particular range of values is required, has been found for both biochemical pathways, such as the retinoic acid pathway (Koide et al. 2001) and bioelectric pathways (Vandenberg et al. 2011; Pai et al. 2012).
When the same channels are expressed in cardiac and skeletal muscle cells, later in development, these variants lead to the cardiac arrhythmias and paralysis that are the other two defining characteristics of ATS (Zhang et al. 2005; Sung et al. 2006; Rajakulendran et al. 2010; Tristani‐Firouzi & Etheridge, 2010; Kukla et al. 2014). While we did not test for arrhythmias or paralysis, our variant‐expressing tadpoles did exhibit a developmental defect in their skeletal muscles, specifically changes to somite organization; in D71V‐expressing tails, we found abnormal fibronectin distribution and co‐localization of the variant‐expressing cells with the badly organized muscles. This occurred with variable penetrance, revealing further commonalities with the effects on human development of ATS, which can cause the formation of tubular aggregates in muscle in some patients, but not all (Pouget, 2008). These commonalities are another indication that Xenopus development is a good model system for studying the mechanisms by which KCNJ2 variants lead to the variably penetrant defects seen in ATS (King et al. 2012; Wheeler & Liu, 2012; Pratt & Khakhalin, 2013). Likewise, these data provide new insights into endogenous physiological regulators of muscle development in vivo (Lobikin, 2015).
In our system, the variability in penetrance may be explained by variation in the ratio of normal, endogenous Kir2.1 to the exogenous variants. For example, in the case of T192A, a single WT Kir2.1 subunit in the tetramer is sufficient to allow some K+ flux through the channel. Depending on how variant subunits are incorporated into the Kir2.1 channel, the effect on V mem could vary considerably. Thus, on top of variability in mRNA half‐life and translation efficiency, the variation in the number of variant subunits present in the channels could explain variable penetrance in both our system and in humans. Lastly, additional genetic heterogeneity with respect to other proteins that regulate bioelectric cell states can also contribute to penetrance variability within a population of affected individuals.
Changes in gene expression: a mechanism for bioelectric control of morphology
Changes in V mem levels and distribution affected the expression patterns of genes known to be critical for normal patterning of the face. Again, consistent with the variability in CFAs of ATS patients, changes to these expression patterns varied, causing expansion of domains, reduction of domains and ectopic expression (Fig. 7, Supplementary Fig. S3). We did not detect any correlations between the proportion of each of these types of change and the proportion of any particular CFA; nonetheless, once it becomes possible technically to follow particular mRNAs in vivo during craniofacial development of Xenopus, high‐resolution, longitudinal studies could reveal important interconnections between V mem, gene expression domain and morphological variation.
We found that a greater percentage of embryos develop CFAs than reveal faulty patterning gene expression at earlier stages. Perhaps the simplest possibility is that there are other voltage‐responsive genes functioning in craniofacial development in addition to the one we examined. As has been proposed previously in the context of laterality defects (Vandenberg & Levin, 2013), disruption of the endogenous bioelectric pattern could affect different genes in different embryos, suggesting an underlying stochastic mechanism. This interpretation is also consistent with the previously discussed variability of CFAs in ATS patients. Another possibility is that we undercounted expression pattern defects by choosing to treat unstained embryos as unscorable rather than abnormal. This decision was made to reduce the possibility of counting false negatives; moreover, our CFAs do not phenocopy the effects of nulls in any of the markers we examined. Future studies of the factors responsible for inter‐embryo variability in the transduction processes linking V mem changes to transcriptional responses, and of the properties of the craniofacial gene regulatory networks, will no doubt shed light on this important issue.
Optogenetics in non‐neural contexts: a new application to development
Optogenetics, the expression of light‐activated and de‐activated channels and pumps in cells, has proven to be a game‐changing technique for studies of neurons and other excitable cells (Wyart et al. 2009; Arrenberg et al. 2010; Liu & Tonegawa, 2010; Diester et al. 2011; Yizhar et al. 2011; Bernstein et al. 2012; Simmich et al. 2012; Tanaka et al. 2012). Here, we present the first proof‐of‐principle that optogenetics is useful for studying and, importantly, manipulating the electrical state of cells during embryonic patterning in vivo. We applied this technique to the ectoderm in developing Xenopus embryos, achieving bioelectrical perturbation with more temporal and spatial resolution than has been possible before now. Because of the widespread role of electrical signalling in stem cell regulation and morphogenesis (Adams, 2008; Stroh et al. 2011; Aprea & Calegari, 2012; Levin, 2012, 2013; Pai & Levin, 2013; Yang et al. 2013; Wang et al. 2014), we believe that application of optogenetics to non‐neural, non‐excitable cells will become a transformative tool for understanding the role of biophysical signals in numerous birth defects.
Using optogenetics we were able to demonstrate that hyperpolarizing the ectoderm at the beginning of neurulation is sufficient to cause CFAs, while altering V mem after morphogenesis has begun has no effect on morphology of the tadpole face. Between stages 14 (the end of early exposures) and 20 (the beginning of late exposures) the neural tube and neural crest leave the surface of the embryo; during the period of stages 20–24, however, ectodermal cells that will contribute to the eyes, ears, nose, and jaws and branchial arches are still on the surface of the embryo (Nieuwkoop & Faber, 1994). Moreover, craniofacial patterning genes are still expressed in the ectoderm at these stages (Fig. 7, Supplementary Fig. S3) indicating that patterning is still active in the ectoderm during the late stages. Thus, the placode‐derived structures studied have ectodermal components that were exposed to light during late exposure but were, nonetheless, generally unaffected. The results of V mem changes on the expression patterns of craniofacial patterning genes expressed early during patterning also suggests that V mem’s role is earlier than the onset of organogenesis. We interpret all of these data to mean that V mem is important before neural tube stages, and that its effects on morphology are mediated, at least in part, through its effects on patterning genes.
Beyond KCNJ2: other channelopathies of embryogenesis
A number of human channelopathies, genetic syndromes caused by ion channel variants, induce patterning defects in tissues other than excitable nerve and muscle. Examples include variants in: the calcium channel CACNA1C that causes Timothy Syndrome, a cardiac insufficiency accompanied by syndactyly and CFAs like those seen in ATS (Splawski et al. 2004); ANKH, an anion transporter associated with craniometaphyseal dysplasia (Kornak et al. 2010); KCNK9, which causes Birk–Barel Mental Retardation Dysmorphism Syndrome, with CFAs similar to those seen in ATS (Barel et al. 2008); GABA‐A, a chloride channel (Homanics et al. 1997; Lalande et al. 1999; Liljelund et al. 2005; Galanopoulou, 2010; Roden et al. 2010; Horvath et al. 2013) that has been associated with Angelman Syndrome, another syndrome with CFAs; and NALCN, a sodium channel that causes facial dysmorphism (Koroglu et al. 2013). In light of recent findings on the endogenous bioelectrical controls of growth and form (Adams, 2008; Levin, 2012; Levin & Stevenson, 2012), this Xenopus model of the potassium channelopathy ATS is an ideal context in which to learn how to study the ways that ion channels contribute to the normal development of facial morphology.
Particularly interesting also is the recent finding that the L‐type voltage‐gated calcium channel Cav1.2 is expressed in the developing mandible of mice at the same time and place as KCNJ2, and the phenotype of the gain‐of‐function variant, in both mouse and humans, is mandibular hypertrophy (Ramachandran et al. 2013). Voltage‐gated calcium channels are known to transduce V mem signals into well‐characterized downstream biochemical signalling pathways (West et al. 2001; Nakanishi & Okazawa, 2006; Greer & Greenberg, 2008), and, as Ramachandran et al. (2013) suggest, the loss‐of‐function phenotype is likely to be a small mandible, one of the characteristics of KCNJ2 variant‐induced ATS.
It is likely that numerous ion channels work together to regulate the bioelectric circuits responsible for craniofacial patterning. Interestingly, perturbations of these pathways not only arise from genetic defects, but also can have an environmental or epigenetic etiology. Because birth defects can be induced by teratogenic compounds that affect ion channel function (Tomson & Battino, 2009; Hernandez‐Diaz & Levin, 2014), our data point to the need for caution in using ion channel‐targeting pharmaceuticals during pregnancy. However, there is another perspective, as shown by recent work in which brain defects induced by a mutated Notch protein were prevented by expression of exogenous ion channels (Pai, 2015). Our data thus reveal new experimental approaches for understanding and someday preventing teratologies in craniofacial development.
These data are the first mechanistic dissection of the role of the inward‐rectifying K+ channel Kir2.1 in craniofacial development, and we present a novel hypothesis for the etiology of CFAs in patients with ATS as well as the CFAs that characterize other channelopathies. Our results are consistent with those of Leong et al. (2014) who mention abnormal brain and eye development resulting from injection of either the WT construct or a deletion variant in zebrafish, indicating evolutionary conservation of the role of KCNJ2 in anterior development. Future work will explore how V mem is integrated with other signalling pathways during craniofacial development. Transduction mechanisms that have been shown to connect V mem to transcriptional and epigenetic targets include serotonin transport, butyrate and histone‐deacetylases, voltage‐sensitive phosphatases and calcium‐mediated signalling (Adams & Levin, 2013). These can now be tested to determine whether one of these mediates the effects of V mem change on expression of specific genes in the nascent face. Because of their mechanical roles, integrins are also an intriguing possibility for the downstream targets of V mem changes during craniofacial morphogenesis (Hart, 2008; Becchetti & Arcangeli, 2010).
In summary (Fig. 9), we have presented evidence that the CFAs associated with ATS are initiated during early craniofacial development and are caused by the effect of potassium channel malfunction on the spatial distribution of V mem of cells in the anterior ectoderm. The anomalies in V mem that occur early in neurulation lead to misexpression of developmentally regulated craniofacial genes, and those genes subsequently mispattern the neural crest and placode lineages. This mispatterning then contributes to abnormalities in craniofacial development. Importantly, our demonstration of a role for potassium channels in craniofacial development suggests a clear roadmap for biomedical strategies that exploit already approved ion channel‐modulating drugs to ameliorate the symptoms of an important class of birth defects.
Figure 9. Schematic of hypothesis .
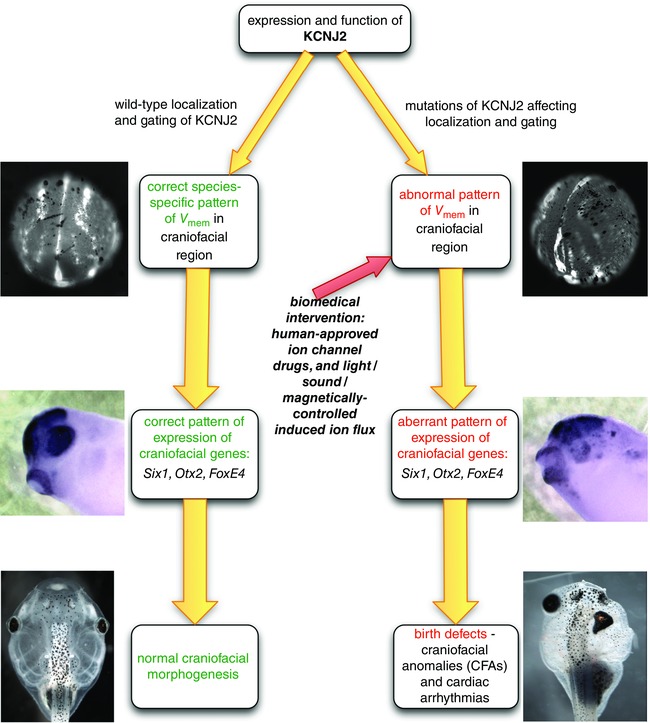
Transcription of KCNJ2 in the embryonic face, together with other ion channels, establishes endogenous patterns of V mem across the anterior ectoderm. This pattern can be disrupted by changes in KCNJ2 expression, intracellular localization or gating properties, all of which can be induced by KCNJ2 variants. Because these voltage patterns regulate transcription of downstream genetic targets known to be important for patterning the face, this model predicts how KCNJ2 channelopathies result in craniofacial dysmorphias. As V mem can be altered by many distinct channels, these findings suggest a novel control point for therapeutic intervention, using optogenetics and/or ion channel drugs to manipulate non‐neural bioelectric signalling during embryogenesis and perhaps restore normal patterning despite KCNJ2 variants or other channelopathies.
Additional information
Competing interests
The authors declare they have no competing interests.
Author contributions
D.S.A.: conception, design and execution of experiments, collection, assembly, analysis and interpretation of Xenopus data, drafting and revising the article and design and creation of figures. S.G.M.U.: design and implementation of modifications of the chip for optogenetics, drafting of the manuscript; J.A.: initial design and modifications of the chip for optogenetics; D.W.: initial design and modifications of the chip for optogenetics; critical revision of the manuscript; V.A.: collection and interpretation of mouse gene expression data; P.C.Y.: design and interpretation of experiments, critical revision of the manuscript; A.D.‐L.: collection, assembly, analysis and interpretation of Xenopus data; J.‐F.P.: design and construction of mRNA constructs used in frog experiments, collection of Xenopus data; M.L.: conception and design of the experiments, analytical interpretation of data, drafting and critical revision of the manuscript, design of figures. The chip used for holding embryos was built by J.A. and D.W. in the lab of D.W. and modified by S.G.M.U. in the lab of Dr Roger Kamm. Immunohistochemistry of mouse sections was preformed by V.A. in the lab of P.Y.C. The remaining experiments were conducted in the labs of D.S.A. and M.L. at the Tufts Centre for Regenerative and Developmental Biology.
Funding
This work was supported by NSF (DBI‐1152279) (M.L.); DARPA subaward W911NF‐11‐2‐0054 (M.L.); National Science Foundation Science and Technology, Centre for Emergent Behaviours of Integrated Cellular Systems (CBET‐0939511) (S.U); NIH (HD081326, AR061988) (M.L.); NIH (RHD081326A) (D.S.A. & M.L.); Australian Research Council Grant No. DE130101046 (D.W.); Vice‐Chancellor's Senior Research Fellowship, RMIT University, Australia (D.W.); and The Australia Endeavour Awards, Department of Education, Employment and Workplace Relations, Australia (J.A., D.W.).
Authors' translational perspective
Mutations in ion channels result in human syndromes, called channelopathies, that often include devastating facial deformities. While cardiac arrhythmias resulting from ion channel dysfunction are well understood, the reason for craniofacial anomalies, i.e. head and face defects in channelopathies such as Andersen‐Tawil Syndrome (ATS) have heretofore remained mysterious. Our data in vertebrate animal models reveal why potassium channels are important for the normal formation of the head. During early development, activity of ion channels contributes to establishing stereotypic patterns of electrical states (bioelectricity) in cells of the nascent face. Our results support the hypothesis that these bioelectric patterns rely on the ATS‐implicated potassium channel Kir2.1, encoded in the KCNJ2 gene, and that these Kir2.1‐dependent patterns are required for correct gene expression and anatomy of the head and face. KCNJ2 mutants identified in ATS patients cause aberrant patterns of bioelectrical signalling when expressed in Xenopus embryos. That, in turn, alters expression profiles of key genes, and results in abnormal development. Thus, our data provide an explanation for the etiology of craniofacial anomalies associated with channelopathies and with prenatal exposure to chemical compounds, such as alcohol, that affect ion channel function. Moreover, by characterizing the bioelectric prepattern for face formation, our results suggest that minimally invasive tracking of bioelectric states could allow early detection of defects. Even more importantly, it raises the exciting possibility that targeted electroceuticals, i.e. ion channel‐modifying drugs already approved for human use, could be employed to prevent or repair these defects in utero.
Supporting information
Fig. S1. (A) Components of a system for using optogenetics in Xenopus (not to scale). This custom optogenetics station was built on an existing microscopy platform consisting of a Nikon AZ100 stereo microscope with an Intensilight mercury illumination source, a Volpi LED brightfield light source and a Ludl MAC5000 XYZ stage controller. The additional commercial component was a Lumencor Spectra4 LED light source with a fibreoptic light guide. This provides illumination at four wavelengths, shown as an inset above the machine. Custom equipment included an adaptor to feed the Spectra 4 fibreoptic cable into the microscope via the fluorescence input port on the top rear of the scope; the light path is represented here by a purple line. Included in the adaptor is an easily accessible slot for a changeable baffle with an aperture that can be made to any size, thus allowing fine control over the size of the spot of light reaching the specimen. After passing through the aperture, the light is reflected down through the 5× objective, further reducing its diameter (not shown), then onto the specimen. The second custom component is a bracket for holding a fluid‐filled light guide coming from the Intensilight. The bracket feeds the white light past an interchangeable band pass filter (a filter that allows green light through is shown). The light from this source is not focused, but rather can be used to illuminate the entire embryo. This feature was added to allow simultaneous activation or deactivation of all the light‐gated translocators that might be expressed, while the pinpoint of light coming through the objective allows precision and aiming of the spot towards a particular feature of interest without illuminating other channels. The final custom component is a DAQ board that allows the computer, running NIS Elements, to control all the components, allowing versatile and fine control over location and timing of illumination. (B) A red spot generated by the red Spectra 4 LED, shining on a standard business card, to show shape, and (C) as seen on the monitor to show size. The innermost ring indicates a 100 μm radius. (D) A Xenopus gastrula‐stage embryo expressing EOS‐FP, a fluorescent marker that undergoes a permanent change from green to red when exposed to UV light. We used this technique to illustrate how the LED light can illuminate a small area without affecting the rest of the embryo. Black and white: the embryo under bright‐field illumination; the embryo is approximately 1.2 mm in diameter. Green: EOS‐FP fluorescence everywhere except the spot in the middle that was illuminated with the UV Spectra4 LED for 6 s. Red: the EOS‐FP that has been converted to red by UV illumination. The spot is 200 μm in diameter.
Fig. S2. (A) Chip used to hold the embryos in place for time‐lapse imaging and/or repeated exposure to light. The trap (Adams et al. 2014; Zhu et al. 2014) is made of PDMS and has been filled with blue dye to show the shape of the microfluidics chamber. White arrows indicate the direction of flow of medium circulated by a peristaltic pump (not shown) at 5–10 ml min−1. The channel is surrounded by a second channel (lighter blue ink) that is connected to a vacuum; this vacuum channel seals the chip to the plastic sheet and prevents leaks. (B) A close up showing an individual embryo slot. White lines indicate the widths of the openings facing the channel; the difference leads to the pressure gradient that holds the embryos in place (direction indicated by arrow). (C) Image of a chip with embryos in each slot. Also visible are the attached tubes bringing medium to the chip.
Fig. S3. WISH for craniofacial patterning genes in embryos injected with the dominant negative (DN) D71V mRNA and with WT KCNJ2. Ten markers were used to characterize the effect of the DN and WT KCNJ2s on craniofacial patterning. The marker is indicated to the left of each row; two columns of images each are presented for untreated controls (No Treatment), embryos injected with the D71V DN variant, and embryos injected with the WT KCNJ2 construct. The normal pattern, at two different stages, is shown in the two left most columns. Examples of mispatterning of the markers are shown in the other columns. There was no consistent difference between the effects of the DN and the WT, indicating that the direction of change of V mem does not prescribe a particular subset of defects.
Acknowledgements
We thank Amanda Allen and Erin Switzer for expert animal care, Joan Lemire for plasmid creation, Roger Kamm for useful discussions on bioengineering, and many generous colleagues who shared reagents, as listed in Tables 1 and 2.
References
- Abe M, Maeda T & Wakisaka S (2008). Retinoic acid affects craniofacial patterning by changing Fgf8 expression in the pharyngeal ectoderm. Dev Growth Differ 50, 717–729. [DOI] [PubMed] [Google Scholar]
- Abello G, Khatri S, Radosevic M, Scotting PJ, Giraldez F & Alsina B (2010). Independent regulation of Sox3 and Lmx1b by FGF and BMP signalling influences the neurogenic and non‐neurogenic domains in the chick otic placode. Dev Biol 339, 166–178. [DOI] [PubMed] [Google Scholar]
- Adams DS (2008). A new tool for tissue engineers: ions as regulators of morphogenesis during development and regeneration. Tissue Eng Part A 14, 1461–1468. [DOI] [PubMed] [Google Scholar]
- Adams DS, Lemire JM, Kramer RH & Levin M (2014). Optogenetics in developmental biology: using light to control ion flux‐dependent signals in Xenopus embryos. Int J Dev Biol 58, 851–861. [DOI] [PMC free article] [PubMed] [Google Scholar]
- Adams DS & Levin M (2012). Measuring resting membrane potential using the fluorescent voltage reporters DiBAC4(3) and CC2‐DMPE. Cold Spring Harb Protoc 2012, 459–464. [DOI] [PMC free article] [PubMed] [Google Scholar]
- Adams DS & Levin M (2013). Endogenous voltage gradients as mediators of cell–cell communication: strategies for investigating bioelectrical signals during pattern formation. Cell Tissue Res 352, 95–122. [DOI] [PMC free article] [PubMed] [Google Scholar]
- Adams DS, Robinson KR, Fukumoto T, Yuan S, Albertson RC, Yelick P, Kuo L, McSweeney M & Levin M (2006). Early, H+‐V‐ATPase‐dependent proton flux is necessary for consistent left–right patterning of non‐mammalian vertebrates. Development 133, 1657–1671. [DOI] [PMC free article] [PubMed] [Google Scholar]
- Adams DS, Tseng AS & Levin M (2013). Light‐activation of the Archaerhodopsin H+‐pump reverses age‐dependent loss of vertebrate regeneration: sparking system‐level controls in vivo . Biology Open 2, 306–313. [DOI] [PMC free article] [PubMed] [Google Scholar]
- Ahrens K & Schlosser G (2005). Tissues and signals involved in the induction of placodal Six1 expression in Xenopus laevis . Dev Biol 288, 40–59. [DOI] [PubMed] [Google Scholar]
- Akagi J, Khoshmanesh K, Evans B, Hall CJ, Crosier KE, Cooper JM, Crosier PS & Wlodkowic D (2012). Miniaturized embryo array for automated trapping, immobilization and microperfusion of zebrafish embryos. PLoS One 7, e36630. [DOI] [PMC free article] [PubMed] [Google Scholar]
- Andreeva V, Cardarelli J & Yelick PC (2012). Rb1 mRNA expression in developing mouse teeth. Gene Expr Patterns 12, 130–135. [DOI] [PMC free article] [PubMed] [Google Scholar]
- Aoki Y, Saint‐Germain N, Gyda M, Magner‐Fink E, Lee Y‐H, Credidio C & Saint‐Jeannet J‐P. (2003). Sox10 regulates the development of neural crest‐derived melanocytes in Xenopus . Dev Biol 259, 19–33. [DOI] [PubMed] [Google Scholar]
- Aprea J & Calegari F (2012). Bioelectric state and cell cycle control of mammalian neural stem cells. Stem Cells Int 2012, 816049. [DOI] [PMC free article] [PubMed] [Google Scholar]
- Arrenberg AB, Stainier DY, Baier H & Huisken J (2010). Optogenetic control of cardiac function. Science 330, 971–974. [DOI] [PubMed] [Google Scholar]
- Barel O, Shalev SA, Ofir R, Cohen A, Zlotogora J, Shorer Z, Mazor G, Finer G, Khateeb S, Zilberberg N & Birk OS (2008). Maternally inherited Birk Barel mental retardation dysmorphism syndrome caused by a mutation in the genomically imprinted potassium channel KCNK9. Am J Hum Genet 83, 193–199. [DOI] [PMC free article] [PubMed] [Google Scholar]
- Barnett C, Yazgan O, Kuo HC, Malakar S, Thomas T, Fitzgerald A, Harbour W, Henry JJ & Krebs JE (2012). Williams Syndrome Transcription Factor is critical for neural crest cell function in Xenopus laevis . Mech Dev 129, 324–338. [DOI] [PMC free article] [PubMed] [Google Scholar]
- Bates EA (2013). A potential molecular target for morphological defects of fetal alcohol syndrome: Kir2.1. Curr Opin Genet Dev 23, 324–329. [DOI] [PubMed] [Google Scholar]
- Beane WS, Morokuma J, Lemire JM & Levin M (2013). Bioelectric signalling regulates head and organ size during planarian regeneration. Development 140, 313–322. [DOI] [PMC free article] [PubMed] [Google Scholar]
- Becchetti A & Arcangeli A (2010). Integrins and ion channels in cell migration: implications for neuronal development, wound healing and metastatic spread. Adv Exp Med Biol 674, 107–123. [DOI] [PubMed] [Google Scholar]
- Beck CW & Slack JM (2001). An amphibian with ambition: a new role for Xenopus in the 21st century. Genome Biol 2, reviews1029. [DOI] [PMC free article] [PubMed] [Google Scholar]
- Bendahhou S, Donaldson MR, Plaster NM, Tristani‐Firouzi M, Fu YH & Ptacek LJ (2003). Defective potassium channel Kir2.1 trafficking underlies Andersen‐Tawil syndrome. J Biol Chem 278, 51779–51785. [DOI] [PubMed] [Google Scholar]
- Bernstein JG, Garrity PA & Boyden ES (2012). Optogenetics and thermogenetics: technologies for controlling the activity of targeted cells within intact neural circuits. Curr Opin Neurobiol 22, 61–71. [DOI] [PMC free article] [PubMed] [Google Scholar]
- Bhattacharyya S, Bailey AP, Bronner‐Fraser M & Streit A (2004). Segregation of lens and olfactory precursors from a common territory: cell sorting and reciprocity of Dlx5 and Pax6 expression. Dev Biol 271, 403–414. [DOI] [PubMed] [Google Scholar]
- Chen Z, Huang J, Liu Y, Dattilo LK, Huh SH, Ornitz D & Beebe DC (2014). FGF signalling activates a Sox9–Sox10 pathway for the formation and branching morphogenesis of mouse ocular glands. Development 141, 2691–2701. [DOI] [PMC free article] [PubMed] [Google Scholar]
- Chernet BT, Fields C & Levin M (2014). Long‐range gap junctional signalling controls oncogene‐mediated tumorigenesis in Xenopus laevis embryos. Front Physiol 5, 519. [DOI] [PMC free article] [PubMed] [Google Scholar]
- Chernet BT & Levin M (2013). Transmembrane voltage potential is an essential cellular parameter for the detection and control of tumor development in a Xenopus model. Dis Model Mech 6, 595–607. [DOI] [PMC free article] [PubMed] [Google Scholar]
- Chernet BT & Levin M (2014). Transmembrane voltage potential of somatic cells controls oncogene‐mediated tumorigenesis at long‐range. Oncotarget 5, 3287–3306. [DOI] [PMC free article] [PubMed] [Google Scholar]
- Chong JX, McMillin MJ, Shively KM, Beck AE, Marvin CT, Armenteros JR, Buckingham KJ, Nkinsi NT, Boyle EA, Berry MN, Bocian M, Foulds N, Uzielli ML, Haldeman‐Englert C, Hennekam RC, Kaplan P, Kline AD, Mercer CL, Nowaczyk MJ, Klein Wassink‐Ruiter JS, McPherson EW, Moreno RA, Scheuerle AE, Shashi V, Stevens CA, Carey JC, Monteil A, Lory P, Tabor HK, Smith JD, Shendure J, Nickerson DA, University of Washington Centre for Mendelian Genomics & Bamshad MJ (2015). De novo mutations in NALCN cause a syndrome characterized by congenital contractures of the limbs and face, hypotonia, and developmental delay. Am J Hum Genet 96, 462–473. [DOI] [PMC free article] [PubMed] [Google Scholar]
- Chow BY, Han X, Dobry AS, Qian X, Chuong AS, Li M, Henninger MA, Belfort GM, Lin Y, Monahan PE & Boyden ES (2010). High‐performance genetically targetable optical neural silencing by light‐driven proton pumps. Nature 463, 98–102. [DOI] [PMC free article] [PubMed] [Google Scholar]
- Christophorou NA, Bailey AP, Hanson S & Streit A (2009). Activation of Six1 target genes is required for sensory placode formation. Dev Biol 336, 327–336. [DOI] [PubMed] [Google Scholar]
- Creuzet S, Schuler B, Couly G & Le Douarin NM (2004). Reciprocal relationships between Fgf8 and neural crest cells in facial and forebrain development. Proc Natl Acad Sci USA 101, 4843–4847. [DOI] [PMC free article] [PubMed] [Google Scholar]
- d'Amaro R, Scheidegger R, Blumer S, Pazera P, Katsaros C, Graf D & Chiquet M (2012). Putative functions of extracellular matrix glycoproteins in secondary palate morphogenesis. Front Physiol 3, 377. [DOI] [PMC free article] [PubMed] [Google Scholar]
- Deardorff MA, Tan C, Saint‐Jeannet JP & Klein PS (2001). A role for frizzled 3 in neural crest development. Development 128, 3655–3663. [DOI] [PubMed] [Google Scholar]
- Diester I, Kaufman MT, Mogri M, Pashaie R, Goo W, Yizhar O, Ramakrishnan C, Deisseroth K & Shenoy KV (2011). An optogenetic toolbox designed for primates. Nat Neurosci 14, 387–397. [DOI] [PMC free article] [PubMed] [Google Scholar]
- Donaldson MR, Jensen JL, Tristani‐Firouzi M, Tawil R, Bendahhou S, Suarez WA, Cobo AM, Poza JJ, Behr E, Wagstaff J, Szepetowski P, Pereira S, Mozaffar T, Escolar DM, Fu YH & Ptacek LJ (2003). PIP2 binding residues of Kir2.1 are common targets of mutations causing Andersen syndrome. Neurology 60, 1811–1816. [DOI] [PubMed] [Google Scholar]
- Donaldson MR, Yoon G, Fu YH & Ptacek LJ (2004). Andersen‐Tawil syndrome: a model of clinical variability, pleiotropy, and genetic heterogeneity. Annals of medicine 36 Suppl 1, 92–97. [DOI] [PubMed] [Google Scholar]
- Epps DE, Wolfe ML & Groppi V (1994). Characterization of the steady‐state and dynamic fluorescence properties of the potential‐sensitive dye bis‐(1,3‐dibutylbarbituric acid)trimethine oxonol (Dibac4(3)) in model systems and cells. Chem Phys Lipids 69, 137–150. [DOI] [PubMed] [Google Scholar]
- Flanagan SE, Clauin S, Bellanne‐Chantelot C, de Lonlay P, Harries LW, Gloyn AL & Ellard S (2009). Update of mutations in the genes encoding the pancreatic beta‐cell KATP channel subunits Kir6.2 (KCNJ11) and sulfonylurea receptor 1 (ABCC8) in diabetes mellitus and hyperinsulinism. Hum Mutat 30, 170–180. [DOI] [PubMed] [Google Scholar]
- Galanopoulou AS (2010). Mutations affecting GABAergic signalling in seizures and epilepsy. Pflugers Arch 460, 505–523. [DOI] [PMC free article] [PubMed] [Google Scholar]
- Garcez RC, Le Douarin NM & Creuzet SE (2014). Combinatorial activity of Six1‐2‐4 genes in cephalic neural crest cells controls craniofacial and brain development. Cell Mol Life Sci 71, 2149–2164. [DOI] [PMC free article] [PubMed] [Google Scholar]
- Gloyn AL, Siddiqui J & Ellard S (2006). Mutations in the genes encoding the pancreatic beta‐cell KATP channel subunits Kir6.2 (KCNJ11) and SUR1 (ABCC8) in diabetes mellitus and hyperinsulinism. Hum Mutat 27, 220–231. [DOI] [PubMed] [Google Scholar]
- Greer PL & Greenberg ME (2008). From synapse to nucleus: calcium‐dependent gene transcription in the control of synapse development and function. Neuron 59, 846–860. [DOI] [PubMed] [Google Scholar]
- Gross JB & Hanken J (2005). Cranial neural crest contributes to the bony skull vault in adult Xenopus laevis: insights from cell labelling studies. J Exp Zoolog B Mol Dev Evol 304, 169–176. [DOI] [PubMed] [Google Scholar]
- Gross JB & Hanken J (2008). Review of fate‐mapping studies of osteogenic cranial neural crest in vertebrates. Dev Biol 317, 389–400. [DOI] [PubMed] [Google Scholar]
- Hans S, Liu D, Christison J & Westerfield M (2005). Fgf8 in otic placode induction. FASEB J 19, A1368–A1368. [Google Scholar]
- Hans S, Liu D & Westerfield M (2004). Pax8 and Pax2a function synergistically in otic specification, downstream of the Foxi1 and Dlx3b transcription factors. Development 131, 5091–5102. [DOI] [PubMed] [Google Scholar]
- Harland RM (1991). In situ hybridization: an improved whole mount method for Xenopus embryos. In Xenopus laevis: Practical uses in cell and molecular biology, ed. Kay BK. & Peng HB, pp. 685–695. Academic Press, San Diego. [DOI] [PubMed] [Google Scholar]
- Hart FX (2008). The mechanical transduction of physiological strength electric fields. Bioelectromagnetics 29, 447–455. [DOI] [PubMed] [Google Scholar]
- Hattori T, Makiyama T, Akao M, Ehara E, Ohno S, Iguchi M, Nishio Y, Sasaki K, Itoh H, Yokode M, Kita T, Horie M & Kimura T (2012). A novel gain‐of‐function KCNJ2 mutation associated with short‐QT syndrome impairs inward rectification of Kir2.1 currents. Cardiovasc Res 93, 666–673. [DOI] [PubMed] [Google Scholar]
- Hedley PL, Jorgensen P, Schlamowitz S, Wangari R, Moolman‐Smook J, Brink PA, Kanters JK, Corfield VA & Christiansen M (2009). The genetic basis of long QT and short QT syndromes: a mutation update. Hum Mutat 30, 1486–1511. [DOI] [PubMed] [Google Scholar]
- Heeg‐Truesdell E & LaBonne C (2004). A slug, a fox, a pair of sox: transcriptional responses to neural crest inducing signals. Birth Defects Res C Embryo Today 72, 124–139. [DOI] [PubMed] [Google Scholar]
- Hernandez‐Diaz S & Levin M (2014). Anticonvulsants teratogenic mechanism involves alteration of bioelectrically‐controlled processes in the embryo. A hypothesis. Reprod Toxicol 47, 111–114. [DOI] [PMC free article] [PubMed] [Google Scholar]
- Hinard V, Belin D, Konig S, Bader CR & Bernheim L (2008). Initiation of human myoblast differentiation via dephosphorylation of Kir2.1 K+ channels at tyrosine 242. Development 135, 859–867. [DOI] [PubMed] [Google Scholar]
- Homanics GE, DeLorey TM, Firestone LL, Quinlan JJ, Handforth A, Harrison NL, Krasowski MD, Rick CE, Korpi ER, Makela R, Brilliant MH, Hagiwara N, Ferguson C, Snyder K & Olsen RW (1997). Mice devoid of gamma‐aminobutyrate type A receptor beta3 subunit have epilepsy, cleft palate, and hypersensitive behaviour. Proc Natl Acad Sci USA 94, 4143–4148. [DOI] [PMC free article] [PubMed] [Google Scholar]
- Honore SM, Aybar MJ & Mayor R (2003). Sox10 is required for the early development of the prospective neural crest in Xenopus embryos. Dev Biol 260, 79–96. [DOI] [PubMed] [Google Scholar]
- Hori K, Sen A & Artavanis‐Tsakonas S (2013). Notch signalling at a glance. J Cell Sci 126, 2135–2140. [DOI] [PMC free article] [PubMed] [Google Scholar]
- Horvath E, Horvath Z, Isaszegi D, Gergev G, Nagy N, Szabo J, Sztriha L, Szell M & Endreffy E (2013). Early detection of Angelman syndrome resulting from de novo paternal isodisomic 15q UPD and review of comparable cases. Mol Cytogenet 6, 35. [DOI] [PMC free article] [PubMed] [Google Scholar]
- Jespersen T, Grunnet M & Olesen SP (2005). The KCNQ1 potassium channel: from gene to physiological function. Physiology (Bethesda) 20, 408–416. [DOI] [PubMed] [Google Scholar]
- Jongsma HJ & Wilders R (2001). Channelopathies: Kir2.1 mutations jeopardize many cell functions. Curr Biol 11, R747–750. [DOI] [PubMed] [Google Scholar]
- Jurkat‐Rott K, Holzherr B, Fauler M & Lehmann‐Horn F (2010). Sodium channelopathies of skeletal muscle result from gain or loss of function. Pflugers Arch 460, 239–248. [DOI] [PMC free article] [PubMed] [Google Scholar]
- Kerney R, Gross JB & Hanken J (2007). Runx2 is essential for larval hyobranchial cartilage formation in Xenopus laevis . Dev Dyn 236, 1650–1662. [DOI] [PubMed] [Google Scholar]
- King MW, Neff AW & Mescher AL (2012). The developing Xenopus limb as a model for studies on the balance between inflammation and regeneration. Anat Rec 295, 1552–1561. [DOI] [PubMed] [Google Scholar]
- Klimova L & Kozmik Z (2014). Stage‐dependent requirement of neuroretinal Pax6 for lens and retina development. Development 141, 1292–1302. [DOI] [PubMed] [Google Scholar]
- Koide T, Downes M, Chandraratna RA, Blumberg B & Umesono K (2001). Active repression of RAR signalling is required for head formation. Genes Dev 15, 2111–2121. [DOI] [PMC free article] [PubMed] [Google Scholar]
- Kornak U, Brancati F, Le Merrer M, Lichtenbelt K, Hohne W, Tinschert S, Garaci FG, Dallapiccola B & Nurnberg P (2010). Three novel mutations in the ANK membrane protein cause craniometaphyseal dysplasia with variable conductive hearing loss. Am J Med Genet Part A 152A, 870–874. [DOI] [PubMed] [Google Scholar]
- Koroglu C, Seven M & Tolun A (2013). Recessive truncating NALCN mutation in infantile neuroaxonal dystrophy with facial dysmorphism. J Med Genet 50, 515–520. [DOI] [PubMed] [Google Scholar]
- Kukla P, Biernacka EK, Baranchuk A, Jastrzebski M & Jagodzinska M (2014). Electrocardiogram in Andersen‐Tawil syndrome. New electrocardiographic criteria for diagnosis of type‐1 Andersen‐Tawil syndrome. Curr Cardiol Rev 10, 222–228. [DOI] [PMC free article] [PubMed] [Google Scholar]
- Lalande M, Minassian BA, DeLorey TM & Olsen RW (1999). Parental imprinting and Angelman syndrome. Adv Neurol 79, 421–429. [PubMed] [Google Scholar]
- Lange C, Prenninger S, Knuckles P, Taylor V, Levin M & Calegari F (2011). The H+ vacuolar ATPase maintains neural stem cells in the developing mouse cortex. Stem Cells Dev 20, 843–850. [DOI] [PMC free article] [PubMed] [Google Scholar]
- Leong IU, Skinner JR, Shelling AN & Love DR (2010). Zebrafish as a model for long QT syndrome: the evidence and the means of manipulating zebrafish gene expression. Acta Physiol (Oxf) 199, 257–276. [DOI] [PubMed] [Google Scholar]
- Leong IUS, Skinner JR, Shelling AN & Love DR (2014). Expression of a mutant kcnj2 gene transcript in zebrafish. ISRN Mol Biol 2014, 14. [DOI] [PMC free article] [PubMed] [Google Scholar]
- Levin M (2012). Molecular bioelectricity in developmental biology: new tools and recent discoveries: control of cell behaviour and pattern formation by transmembrane potential gradients. Bioessays 34, 205–217. [DOI] [PMC free article] [PubMed] [Google Scholar]
- Levin M (2013). Reprogramming cells and tissue patterning via bioelectrical pathways: molecular mechanisms and biomedical opportunities. Wiley Interdiscip Rev Syst Biol Med 5, 657–676. [DOI] [PMC free article] [PubMed] [Google Scholar]
- Levin M (2014). Molecular bioelectricity: how endogenous voltage potentials control cell behaviour and instruct pattern regulation in vivo . Mol Biol Cell 25, 3835–3850. [DOI] [PMC free article] [PubMed] [Google Scholar]
- Levin M & Stevenson CG (2012). Regulation of cell behaviour and tissue patterning by bioelectrical signals: challenges and opportunities for biomedical engineering. Annu Rev Biomed Eng 14, 295–323. [DOI] [PMC free article] [PubMed] [Google Scholar]
- Li HY, Grifone R, Saquet A, Carron C & Shi DL (2013). The Xenopus homologue of Down syndrome critical region protein 6 drives dorsoanterior gene expression and embryonic axis formation by antagonising polycomb group proteins. Development 140, 4903–4913. [DOI] [PubMed] [Google Scholar]
- Liljelund P, Handforth A, Homanics GE & Olsen RW (2005). GABAA receptor beta3 subunit gene‐deficient heterozygous mice show parent‐of‐origin and gender‐related differences in beta3 subunit levels, EEG, and behaviour. Brain Res Dev Brain Res 157, 150–161. [DOI] [PubMed] [Google Scholar]
- Lin JY, Lin MZ, Steinbach P & Tsien RY (2009). Characterization of engineered channelrhodopsin variants with improved properties and kinetics. Biophys J 96, 1803–1814. [DOI] [PMC free article] [PubMed] [Google Scholar]
- Liu W, Lagutin OV, Mende M, Streit A & Oliver G (2006). Six3 activation of Pax6 expression is essential for mammalian lens induction and specification. EMBO J 25, 5383–5395. [DOI] [PMC free article] [PubMed] [Google Scholar]
- Liu X & Tonegawa S (2010). Optogenetics 3.0. Cell 141, 22–24. [DOI] [PubMed] [Google Scholar]
- Lobikin M, Chernet B, Lobo D & Levin M (2012). Resting potential, oncogene‐induced tumorigenesis, and metastasis: the bioelectric basis of cancer in vivo . Phys Biol 9, 065002. [DOI] [PMC free article] [PubMed] [Google Scholar]
- Lobikin M, Pare J‐F, Kaplan DL, & Levin M (2015). Selective depolarization of transmembrane potential alters muscle patterning and muscle cell localization in embryonic Xenopus laevis . Int J Dev Biol 59, 303–311. [DOI] [PMC free article] [PubMed] [Google Scholar]
- Mancilla A & Mayor R (1996). Neural crest formation in Xenopus laevis: mechanisms of Xslug induction. Dev Biol 177, 580–589. [DOI] [PubMed] [Google Scholar]
- Masuda CA & Montero‐Lomeli M (2000). An NH2‐terminal deleted plasma membrane H+‐ATPase is a dominant negative mutant and is sequestered in endoplasmic reticulum derived structures. Biochem Cell Biol 78, 51–58. [PubMed] [Google Scholar]
- McCarroll MN, Lewis ZR, Culbertson MD, Martin BL, Kimelman D & Nechiporuk AV (2012). Graded levels of Pax2a and Pax8 regulate cell differentiation during sensory placode formation. Development 139, 2740–2750. [DOI] [PMC free article] [PubMed] [Google Scholar]
- Moody SA, Mhaske P, Pignoni F, Yan B & Neilson KM (2010). Identification of novel candidate Six1‐interacting proteins with potential roles in cranial placode development. Dev Biol 344, 455–456. [Google Scholar]
- Morokuma J, Blackiston D & Levin M (2008). KCNQ1 and KCNE1 K+ channel components are involved in early left‐right patterning in Xenopus laevis embryos. Cell Physiol Biochem 21, 357–372. [DOI] [PMC free article] [PubMed] [Google Scholar]
- Nakanishi S & Okazawa M (2006). Membrane potential‐regulated Ca2+ signalling in development and maturation of mammalian cerebellar granule cells. J Physiol 575, 389–395. [DOI] [PMC free article] [PubMed] [Google Scholar]
- Nguyen HL, Pieper GH & Wilders R (2013). Andersen‐Tawil syndrome: clinical and molecular aspects. Int J Cardiol 170, 1–16. [DOI] [PubMed] [Google Scholar]
- Nieuwkoop PD & Faber J (1994). Normal Table of Xenopus laevis (Daudin): A Systematical and Chronological Survey of the Development from the Fertilized Egg till the End of Metamorphosis. Garland Publishers, New York. [Google Scholar]
- Ogino H, Fisher M & Grainger RM (2008). Convergence of a head‐field selector Otx2 and Notch signalling: a mechanism for lens specification. Development 135, 249–258. [DOI] [PMC free article] [PubMed] [Google Scholar]
- Pai V & Levin M (2013). Bioelectric controls of stem cell function In Stem Cells, ed. Calegari F & Waskow C, pp. 106–148. CRC Press, Boca Raton, FL. [Google Scholar]
- Pai VP, Aw S, Shomrat T, Lemire JM & Levin M (2012). Transmembrane voltage potential controls embryonic eye patterning in Xenopus laevis . Development 139, 313–323. [DOI] [PMC free article] [PubMed] [Google Scholar]
- Pai VP, Lemire JM, Chen Y, Lin G, and Levin M (2015. b). Local and long‐range endogenous resting potential gradients antagonistically regulate apoptosis and proliferation in the embryonic CNS. Int J Dev Biol 59, 327–340. [DOI] [PMC free article] [PubMed] [Google Scholar]
- Pai VP, Lemire JM, Pare JF, Lin G, Chen Y & Levin M (2015. a). Endogenous gradients of resting potential instructively pattern embryonic neural tissue via Notch signalling and regulation of proliferation. J Neurosci 35, 4366–4385. [DOI] [PMC free article] [PubMed] [Google Scholar]
- Peroz D, Rodriguez N, Choveau F, Baro I, Merot J & Loussouarn G (2008). Kv7.1 (KCNQ1) properties and channelopathies. J Physiol 586, 1785–1789. [DOI] [PMC free article] [PubMed] [Google Scholar]
- Plageman TF, Chung MI, Lou M, Smith AN, Hildebrand JD, Wallingford JB & Lang RA (2010). Pax6‐dependent Shroom3 expression regulates apical constriction during lens placode invagination. Development 137, 405–415. [DOI] [PMC free article] [PubMed] [Google Scholar]
- Pouget J (2008). [A new type of periodic paralysis: Andersen‐Tawil syndrome]. Bull Acad Natl Med 192, 1551–1556; discussion 1556–1557. [PubMed] [Google Scholar]
- Pouliquin P, Grouzis J & Gibrat R (1999). Electrophysiological study with oxonol VI of passive NO3 – transport by isolated plant root plasma membrane. Biophys J 76, 360–373. [DOI] [PMC free article] [PubMed] [Google Scholar]
- Pratt KG & Khakhalin AS (2013). Modeling human neurodevelopmental disorders in the Xenopus tadpole: from mechanisms to therapeutic targets. Dis Model Mech 6, 1057–1065. [DOI] [PMC free article] [PubMed] [Google Scholar]
- Purcell P, Oliver G, Mardon G, Donner AL & Maas RL (2005). Pax6‐dependence of Six3, Eya1 and Dach1 expression during lens and nasal placode induction. Gene Expr Patterns 6, 110–118. [DOI] [PubMed] [Google Scholar]
- Rajakulendran S, Tan SV & Hanna MG (2010). Muscle weakness, palpitations and a small chin: the Andersen‐Tawil syndrome. Pract Neurol 10, 227–231. [DOI] [PubMed] [Google Scholar]
- Ramachandran KV, Hennessey JA, Barnett AS, Yin X, Stadt HA, Foster E, Shah RA, Yazawa M, Dolmetsch RE, Kirby ML & Pitt GS (2013). Calcium influx through L‐type CaV1.2 Ca2+ channels regulates mandibular development. J Clin Invest 123, 1638–1646. [DOI] [PMC free article] [PubMed] [Google Scholar]
- Rasmussen JT, Deardorff MA, Tan C, Rao MS, Klein PS & Vetter ML (2001). Regulation of eye development by frizzled signalling in Xenopus . Proc Natl Acad Sci USA 98, 3861–3866. [DOI] [PMC free article] [PubMed] [Google Scholar]
- Reisoli E, De Lucchini S, Nardi I & Ori M (2010). Serotonin 2B receptor signalling is required for craniofacial morphogenesis and jaw joint formation in Xenopus . Development 137, 2927–2937. [DOI] [PubMed] [Google Scholar]
- Ren Z & Ambros VR (2015). Caenorhabditis elegans microRNAs of the let‐7 family act in innate immune response circuits and confer robust developmental timing against pathogen stress. Proc Natl Acad Sci USA 112, E2366–2375. [DOI] [PMC free article] [PubMed] [Google Scholar]
- Rizzoti K & Lovell‐Badge R (2007). SOX3 activity during pharyngeal segmentation is required for craniofacial morphogenesis. Development 134, 3437–3448. [DOI] [PubMed] [Google Scholar]
- Robert J & Cohen N (2011). The genus Xenopus as a multispecies model for evolutionary and comparative immunobiology of the 21st century. Dev Comp Immunol 35, 916–923. [DOI] [PMC free article] [PubMed] [Google Scholar]
- Roden WH, Peugh LD & Jansen LA (2010). Altered GABAA receptor subunit expression and pharmacology in human Angelman syndrome cortex. Neurosci Lett 483, 167–172. [DOI] [PMC free article] [PubMed] [Google Scholar]
- Saint‐Germain N, Lee Y‐H, Zhang Y, Sargent TD & Saint‐Jeannet J‐P (2004). Specification of the otic placode depends on Sox9 function in Xenopus . Development 131, 1755–1763. [DOI] [PubMed] [Google Scholar]
- Sanchez‐Martin M, Rodriguez‐Garcia A, Perez‐Losada J, Sagrera A, Read AP & Sanchez‐Garcia I (2002). SLUG (SNAI2) deletions in patients with Waardenburg disease. Hum Mol Genet 11, 3231–3236. [DOI] [PubMed] [Google Scholar]
- Schlosser G (2006). Induction and specification of cranial placodes. Dev Biol 294, 303–351. [DOI] [PubMed] [Google Scholar]
- Seufert DW, Hanken J & Klymkowsky MW (1994). Type II collagen distribution during cranial development in Xenopus laevis . Anat Embryol (Berl) 189, 81–89. [DOI] [PubMed] [Google Scholar]
- Shi W, Xu J & Warburton D (2009). Development, repair and fibrosis: what is common and why it matters. Respirology 14, 656–665. [DOI] [PMC free article] [PubMed] [Google Scholar]
- Shigetani Y, Nobusada Y & Kuratani S (2000). Ectodermally derived FGF8 defines the maxillomandibular region in the early chick embryo: epithelial‐mesenchymal interactions in the specification of the craniofacial ectomesenchyme. Dev Biol 228, 73–85. [DOI] [PubMed] [Google Scholar]
- Simmich J, Staykov E & Scott E (2012). Zebrafish as an appealing model for optogenetic studies. Progr Brain Res 196, 145–162. [DOI] [PubMed] [Google Scholar]
- Singh A, Winterbottom EF, Ji YJ, Hwang YS & Daar IO (2013). Abelson interactor 1 (ABI1) and its interaction with Wiskott‐Aldrich syndrome protein (wasp) are critical for proper eye formation in Xenopus embryos. J Biol Chem 288, 14135–14146. [DOI] [PMC free article] [PubMed] [Google Scholar]
- Sive H, Grainger RM & Harland R (2000). Early Development of Xenopus laevis. Cold Spring Harbor Laboratory Press, Cold Spring Harbor, NY. [Google Scholar]
- Soom M, Schonherr R, Kubo Y, Kirsch C, Klinger R & Heinemann SH (2001). Multiple PIP2 binding sites in Kir2.1 inwardly rectifying potassium channels. FEBS Lett 490, 49–53. [DOI] [PubMed] [Google Scholar]
- Splawski I, Timothy KW, Sharpe LM, Decher N, Kumar P, Bloise R, Napolitano C, Schwartz PJ, Joseph RM, Condouris K, Tager‐Flusberg H, Priori SG, Sanguinetti MC & Keating MT (2004). Cav1.2 calcium channel dysfunction causes a multisystem disorder including arrhythmia and autism. Cell 119, 19–31. [DOI] [PubMed] [Google Scholar]
- Steventon B, Mayor R & Streit A (2012). Mutual repression between Gbx2 and Otx2 in sensory placodes reveals a general mechanism for ectodermal patterning. Dev Biol 367, 55–65. [DOI] [PMC free article] [PubMed] [Google Scholar]
- Stewart S, Rojas‐Munoz A & Izpisua Belmonte JC (2007). Bioelectricity and epimorphic regeneration. Bioessays 29, 1133–1137. [DOI] [PubMed] [Google Scholar]
- Stroh A, Tsai HC, Ping Wang L, Zhang F, Kressel J, Aravanis A, Santhanam N, Deisseroth K, Konnerth A & Schneider MB (2011). Tracking stem cell differentiation in the setting of automated optogenetic stimulation. Stem Cells 29, 78–88. [DOI] [PMC free article] [PubMed] [Google Scholar]
- Sundelacruz S, Levin M & Kaplan DL (2009). Role of membrane potential in the regulation of cell proliferation and differentiation. Stem Cell Rev Reports 5, 231–246. [DOI] [PMC free article] [PubMed] [Google Scholar]
- Sung RJ, Wu SN, Wu JS, Chang HD & Luo CH (2006). Electrophysiological mechanisms of ventricular arrhythmias in relation to Andersen‐Tawil syndrome under conditions of reduced IK1: a simulation study. Am J Physiol Heart Circ Physiol 291, H2597–2605. [DOI] [PubMed] [Google Scholar]
- Tanaka KF, Matsui K, Sasaki T, Sano H, Sugio S, Fan K, Hen R, Nakai J, Yanagawa Y, Hasuwa H, Okabe M, Deisseroth K, Ikenaka K & Yamanaka A (2012). Expanding the repertoire of optogenetically targeted cells with an enhanced gene expression system. Cell Rep 2, 397–406. [DOI] [PubMed] [Google Scholar]
- Tomson T & Battino D (2009). Teratogenic effects of antiepileptic medications. Neurol Clin 27, 993–1002. [DOI] [PubMed] [Google Scholar]
- Tristani‐Firouzi M (2006). Andersen‐Tawil syndrome: an ever‐expanding phenotype? Heart Rhythm 3, 1351–1352. [DOI] [PubMed] [Google Scholar]
- Tristani‐Firouzi M & Etheridge SP (2010). Kir 2.1 channelopathies: the Andersen‐Tawil syndrome. Pflügers Arch 460, 289–294. [DOI] [PubMed] [Google Scholar]
- Tristani‐Firouzi M, Jensen JL, Donaldson MR, Sansone V, Meola G, Hahn A, Bendahhou S, Kwiecinski H, Fidzianska A, Plaster N, Fu YH, Ptacek LJ & Tawil R (2002). Functional and clinical characterization of KCNJ2 mutations associated with LQT7 (Andersen syndrome). J Clin Invest 110, 381–388. [DOI] [PMC free article] [PubMed] [Google Scholar]
- Tseng A & Levin M (2013). Cracking the bioelectric code: Probing endogenous ionic controls of pattern formation. Commun Integr Biol 6, 1–8. [DOI] [PMC free article] [PubMed] [Google Scholar]
- van Vliet P, de Boer TP, van der Heyden MA, El Tamer MK, Sluijter JP, Doevendans PA & Goumans MJ (2010). Hyperpolarization induces differentiation in human cardiomyocyte progenitor cells. Stem Cell Rev 6, 178–185. [DOI] [PubMed] [Google Scholar]
- Vandenberg LN & Levin M (2013). A unified model for left‐right asymmetry? Comparison and synthesis of molecular models of embryonic laterality. Dev Biol 379, 1–15. [DOI] [PMC free article] [PubMed] [Google Scholar]
- Vandenberg LN, Morrie RD & Adams DS (2011). V‐ATPase‐dependent ectodermal voltage and pH regionalization are required for craniofacial morphogenesis. Dev Dyn 240, 1889–1904. [DOI] [PMC free article] [PubMed] [Google Scholar]
- Vernon AE & LaBonne C (2006). Slug stability is dynamically regulated during neural crest development by the F‐box protein Ppa. Development 133, 3359–3370. [DOI] [PubMed] [Google Scholar]
- Wahlbuhl M, Reiprich S, Vogl MR, Bosl MR & Wegner M (2012). Transcription factor Sox10 orchestrates activity of a neural crest‐specific enhancer in the vicinity of its gene. Nucleic Acids Res 40, 88–101. [DOI] [PMC free article] [PubMed] [Google Scholar]
- Wang SJ, Weng CH, Xu HW, Zhao CJ & Yin ZQ (2014). Effect of optogenetic stimulus on the proliferation and cell cycle progression of neural stem cells. J Membr Biol 247, 493–500. [DOI] [PubMed] [Google Scholar]
- Weir RA, Petrie CJ, Murday V & Findlay IN (2011). Andersen‐Tawil syndrome. Int J Cardiol 148, e13–15. [DOI] [PubMed] [Google Scholar]
- West AE, Chen WG, Dalva MB, Dolmetsch RE, Kornhauser JM, Shaywitz AJ, Takasu MA, Tao X & Greenberg ME (2001). Calcium regulation of neuronal gene expression. Proc Natl Acad Sci USA 98, 11024–11031. [DOI] [PMC free article] [PubMed] [Google Scholar]
- Wheeler GN & Liu KJ (2012). Xenopus: an ideal system for chemical genetics. Genesis 50, 207–218. [DOI] [PubMed] [Google Scholar]
- Wong EY, Ahmed M & Xu PX (2013). EYA1‐SIX1 complex in neurosensory cell fate induction in the mammalian inner ear. Hear Res 297, 13–19. [DOI] [PMC free article] [PubMed] [Google Scholar]
- Wyart C, Del Bene F, Warp E, Scott EK, Trauner D, Baier H & Isacoff EY (2009). Optogenetic dissection of a behavioural module in the vertebrate spinal cord. Nature 461, 407–410. [DOI] [PMC free article] [PubMed] [Google Scholar]
- Yang F, Tu J, Pan JQ, Luo HL, Liu YH, Wan J, Zhang J, Wei PF, Jiang T, Chen YH & Wang LP (2013). Light‐controlled inhibition of malignant glioma by opsin gene transfer. Cell Death Dis 4, e893. [DOI] [PMC free article] [PubMed] [Google Scholar]
- Yang J, Jan YN & Jan LY (1995). Control of rectification and permeation by residues in two distinct domains in an inward rectifier K+ channel. Neuron 14, 1047–1054. [DOI] [PubMed] [Google Scholar]
- Ye Z, Mostajo‐Radji MA, Brown JR, Rouaux C, Tomassy GS, Hensch TK & Arlotta P (2015). Instructing perisomatic inhibition by direct lineage reprogramming of neocortical projection neurons. Neuron 88, 475–483. [DOI] [PMC free article] [PubMed] [Google Scholar]
- Yizhar O, Fenno LE, Davidson TJ, Mogri M & Deisseroth K (2011). Optogenetics in neural systems. Neuron 71, 9–34. [DOI] [PubMed] [Google Scholar]
- Yoon G, Oberoi S, Tristani‐Firouzi M, Etheridge SP, Quitania L, Kramer JH, Miller BL, Fu YH & Ptacek LJ (2006). Andersen‐Tawil syndrome: prospective cohort analysis and expansion of the phenotype. Am J Med Genet A 140, 312–321. [DOI] [PubMed] [Google Scholar]
- Zaritsky JJ, Eckman DM, Wellman GC Nelson MT & Schwarz TL (2000). Targeted disruption of Kir2.1 and Kir2.2 genes reveals the essential role of the inwardly rectifying K+ current in K+‐mediated vasodilation. Circ Res 87, 160–166. [DOI] [PubMed] [Google Scholar]
- Zaghloul NA & Moody SA (2007). Alterations of rx1 and pax6 expression levels at neural plate stages differentially affect the production of retinal cell types and maintenance of retinal stem cell qualities. Dev Biol 306, 222–240. [DOI] [PubMed] [Google Scholar]
- Zhang H, Chen H, Luo H, An J, Sun L, Mei L, He C, Jiang L, Jiang W, Xia K, Li JD & Feng Y (2012). Functional analysis of Waardenburg syndrome‐associated PAX3 and SOX10 mutations: report of a dominant‐negative SOX10 mutation in Waardenburg syndrome type II. Hum Genet 131, 491–503. [DOI] [PubMed] [Google Scholar]
- Zhang L, Benson DW, Tristani‐Firouzi M, Ptacek LJ, Tawil R, Schwartz PJ, George AL, Horie M, Andelfinger G, Snow GL, Fu YH, Ackerman MJ & Vincent GM (2005). Electrocardiographic features in Andersen‐Tawil syndrome patients with KCNJ2 mutations: characteristic T‐U‐wave patterns predict the KCNJ2 genotype. Circulation 111, 2720–2726. [DOI] [PubMed] [Google Scholar]
- Zhu F, Skommer J, Huang Y, Akagi J, Adams D, Levin M, Hall CJ, Crosier PS & Wlodkowic D (2014). Fishing on chips: Up‐and‐coming technological advances in analysis of zebrafish and Xenopus embryos. Cytometry A 85, 921–932. [DOI] [PMC free article] [PubMed] [Google Scholar]
- Zilinski C, Brownell I, Hashimoto R, Medina‐Martinez O, Swindell EC & Jamrich M (2004). Expression of FoxE4 and Rx visualizes the timing and dynamics of critical processes taking place during initial stages of vertebrate eye development. Dev Neurosci 26, 294–307. [DOI] [PubMed] [Google Scholar]
Associated Data
This section collects any data citations, data availability statements, or supplementary materials included in this article.
Supplementary Materials
Fig. S1. (A) Components of a system for using optogenetics in Xenopus (not to scale). This custom optogenetics station was built on an existing microscopy platform consisting of a Nikon AZ100 stereo microscope with an Intensilight mercury illumination source, a Volpi LED brightfield light source and a Ludl MAC5000 XYZ stage controller. The additional commercial component was a Lumencor Spectra4 LED light source with a fibreoptic light guide. This provides illumination at four wavelengths, shown as an inset above the machine. Custom equipment included an adaptor to feed the Spectra 4 fibreoptic cable into the microscope via the fluorescence input port on the top rear of the scope; the light path is represented here by a purple line. Included in the adaptor is an easily accessible slot for a changeable baffle with an aperture that can be made to any size, thus allowing fine control over the size of the spot of light reaching the specimen. After passing through the aperture, the light is reflected down through the 5× objective, further reducing its diameter (not shown), then onto the specimen. The second custom component is a bracket for holding a fluid‐filled light guide coming from the Intensilight. The bracket feeds the white light past an interchangeable band pass filter (a filter that allows green light through is shown). The light from this source is not focused, but rather can be used to illuminate the entire embryo. This feature was added to allow simultaneous activation or deactivation of all the light‐gated translocators that might be expressed, while the pinpoint of light coming through the objective allows precision and aiming of the spot towards a particular feature of interest without illuminating other channels. The final custom component is a DAQ board that allows the computer, running NIS Elements, to control all the components, allowing versatile and fine control over location and timing of illumination. (B) A red spot generated by the red Spectra 4 LED, shining on a standard business card, to show shape, and (C) as seen on the monitor to show size. The innermost ring indicates a 100 μm radius. (D) A Xenopus gastrula‐stage embryo expressing EOS‐FP, a fluorescent marker that undergoes a permanent change from green to red when exposed to UV light. We used this technique to illustrate how the LED light can illuminate a small area without affecting the rest of the embryo. Black and white: the embryo under bright‐field illumination; the embryo is approximately 1.2 mm in diameter. Green: EOS‐FP fluorescence everywhere except the spot in the middle that was illuminated with the UV Spectra4 LED for 6 s. Red: the EOS‐FP that has been converted to red by UV illumination. The spot is 200 μm in diameter.
Fig. S2. (A) Chip used to hold the embryos in place for time‐lapse imaging and/or repeated exposure to light. The trap (Adams et al. 2014; Zhu et al. 2014) is made of PDMS and has been filled with blue dye to show the shape of the microfluidics chamber. White arrows indicate the direction of flow of medium circulated by a peristaltic pump (not shown) at 5–10 ml min−1. The channel is surrounded by a second channel (lighter blue ink) that is connected to a vacuum; this vacuum channel seals the chip to the plastic sheet and prevents leaks. (B) A close up showing an individual embryo slot. White lines indicate the widths of the openings facing the channel; the difference leads to the pressure gradient that holds the embryos in place (direction indicated by arrow). (C) Image of a chip with embryos in each slot. Also visible are the attached tubes bringing medium to the chip.
Fig. S3. WISH for craniofacial patterning genes in embryos injected with the dominant negative (DN) D71V mRNA and with WT KCNJ2. Ten markers were used to characterize the effect of the DN and WT KCNJ2s on craniofacial patterning. The marker is indicated to the left of each row; two columns of images each are presented for untreated controls (No Treatment), embryos injected with the D71V DN variant, and embryos injected with the WT KCNJ2 construct. The normal pattern, at two different stages, is shown in the two left most columns. Examples of mispatterning of the markers are shown in the other columns. There was no consistent difference between the effects of the DN and the WT, indicating that the direction of change of V mem does not prescribe a particular subset of defects.