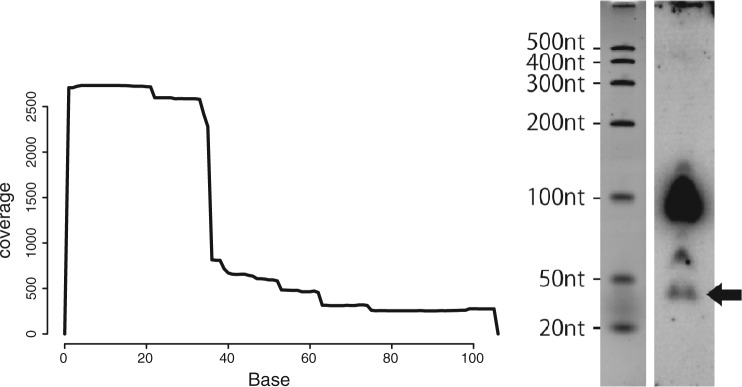
Fig. 3.
(Left) Read mapping profile of Leu-CAA-tRNA from RNA-seq for the marmoset spleen. (Right) Northern blots for Leu-CAA-tRNA (lenght 105 nt) and the derived fragments. The band indicated with the arrow represents the expected size (35 nt) of the predicted derived RNA fragment. Blots were pre-hybridized, then probes which had been end-labeled with [P] ATP were added to the hybridization chamber and incubated with the blots. The membrane was then exposed to a phosphoimager and scanned. The largest band appearing at a distance just short of the 100-nt marker indicates the expression of the origin tRNA from which the short fragment RNA was derived

