Abstract
Today coral reefs are threatened by changes to seawater conditions associated with rapid anthropogenic global climate change. Yet, since the Cenozoic, these organisms have experienced major fluctuations in atmospheric CO2 levels (from greenhouse conditions of high pCO2 in the Eocene to low pCO2 ice-house conditions in the Oligocene-Miocene) and a dramatically changing ocean Mg/Ca ratio. Here we show that the most diverse, widespread, and abundant reef-building coral genus Acropora (20 morphological groups and 150 living species) has not only survived these environmental changes, but has maintained its distinct skeletal biomineralization pattern for at least 40 My: Well-preserved fossil Acropora skeletons from the Eocene, Oligocene, and Miocene show ultra-structures indistinguishable from those of extant representatives of the genus and their aragonitic skeleton Mg/Ca ratios trace the inferred ocean Mg/Ca ratio precisely since the Eocene. Therefore, among marine biogenic carbonate fossils, well-preserved acroporid skeletons represent material with very high potential for reconstruction of ancient ocean chemistry.
Genomic sequencing has transformed our understanding of the evolution of scleractinian corals. However, the molecular clades defined for scleractinians are difficult to reconcile with traditional taxonomic classification based on overall skeletal morphology1,2,3. Instead, they have been shown to be broadly consistent with recently defined micro-morphological and ultrastructural skeletal criteria4,5,6,7. In particular, distinct patterns of crystal arrangement in skeletal thickening deposits (TD, a.k.a. “fibers”) correspond well to the grouping of family-level taxa based on DNA/RNA sequencing8,9 and make it possible to taxonomically classify well-preserved fossil corals with a high level of confidence. Furthermore, a strong link between skeletal ultrastructure and molecular clade identity is consistent with a biomineralization process controlled from the gene-level with functional macromolecules (such as proteins and sulphated polysaccharides) imparting direct control over mineralogy, crystallographic properties, and certain trace-element and isotopic (e.g. δ15N) compositions of the resulting aragonitic structures10,11,12,13,14.
Acropora (Fig. 1a) is one of the best-studied scleractinian coral genera, with various aspects of taxonomy, biogeography, physiology, reproduction, and biomineralization investigated15,16,17. Complete genome sequence of Acropora digitifera and whole transcriptome analysis of A. millepora are available18,19. Together with Alveopora, Isopora, Anacropora, Montipora, and Astraeopora, Acropora forms a well-supported molecular clade, the family Acroporidae3. In the few species of Acropora whose fine-scale details were studied, a highly distinct, scale-like (shingle) organization of TD (Fig. 1b) has been documented20,21,22,23,24. However, the robustness and evolutionary stability of this skeletal feature has not been systematically examined among all Acropora species groups, other acroporid genera, and their fossil representatives.
Figure 1. Skeleton texture and structure in Recent Acropora.
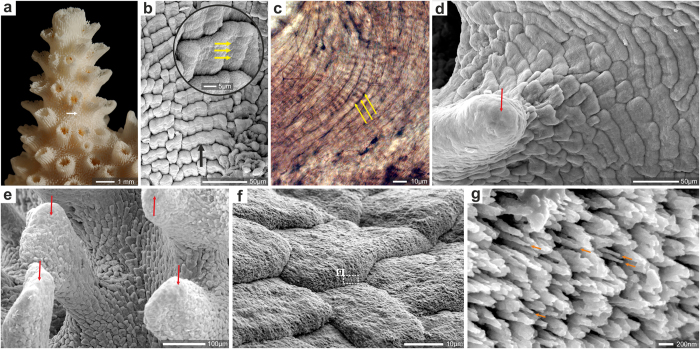
(a) lateral view of a branch of A. eurystoma (ZPAL H.25/118(966)) with large axial corallite (opening at tip) and smaller lateral corallites (arrow indicates region enlarged in Fig. 1b and sectioned in Fig. 2a), (b) the most striking feature of the skeleton surface of Acropora (here A. eurystoma) is its texture in the form of regular shingles which are aligned along the extensional direction of the structures they build (black arrow). Shingles cover the entire skeleton surface except of regions of the fast growth which tend to be more smooth. The shingles show incremental growth every ca. 3–4 μm (yellow arrows in enlargement), (c) incremental growth lines of shingles in thin-sectioned skeleton of Acropora muricata (ZPAL H.25/90(535B), (d,e) distal portions of coenosteal spinulae and short septal spines (d, A. cervicornis, ZPAL H.25/12(545); (e) A. eurystoma ZPAL H.25/118(966)) are relatively smooth (red arrows) in contrast to the rest of the skeleton, which exhibits the shingle structure. (f,g) extremely slender (orange arrows in g) bundles of fibers form the edge of the growing front of shingles in A. muricata, ZPAL H.25/90(535B). Fibers are aligned parallel to the surface of the skeleton.
We have examined the ultrastructure of 22 extant Acropora species representing all major morphological groups of the genus15 (SI Table 1). All studied specimens exhibit distinct shingle structures (consisting of overlapping, scale-like bundles of fibers) on their main skeletal surfaces, with the exception of distal portions of coenosteal spinulae and short septal spines, which are relatively smooth (e.g., Fig. 1d,e). Shingles are aligned along the extensional direction of the structures they build (e.g., Fig. 1b). Aragonite fibers within each shingle are arranged semi-parallel to the skeleton surface; tips of fibers at the growing front of shingles are extremely slender (ca. 50 nm in diameter, Fig. 1f,g). Within each shingle and in neighboring groups of shingles, fibers generally have similar orientation of the crystallographic c-axis (SI-Fig. 1). Shingles show incremental growth lines (3–5 μm wide) that can be observed directly on their surfaces (Fig. 1b), on polished and etched surfaces (Fig. 2c), and in thin-sections (Fig. 1c). On the skeleton surface shingles are overlapped by shingles forming just below (relative to the distal edge). Bundles of fibers that are part of individual shingles on the surface can have lengths of several hundred micrometers, strongly suggesting that their growth is continuous (Fig. 2b).
Figure 2. Microstructure and differentiation of shingles near the tip of coenosteal spinulae visualized by 86Sr labeling in Recent Acropora (A. eurystoma, ZPAL H.25/118(966)).
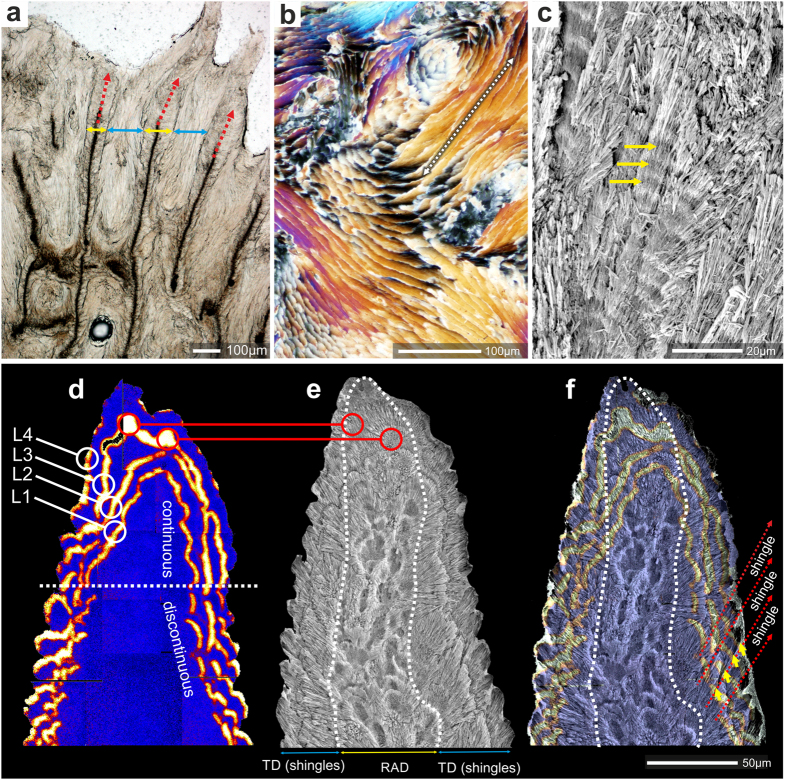
(a) longitudinal section along the fast growing skeletal regions includes spinulae (yellow arrows), RAD (red arrows) and shingles (blue arrows). Ultra-thin transverse section (b), polarized light)) and polished, slightly etched section (c) reveal longitudinal sections of shingles bundles of fibers several hundreds of micrometers long (dashed arrow in (b)), suggesting continuous growth of individual shingles, (d) NanoSIMS 86Sr/44Ca isotope mosaic map, (e) SEM image of polished and etched sample, (f) NanoSIMS and SEM images overlaid. 86Sr-labeling pulses (12 hours, separated by 36 hours, orange-yellow color) are continuous in the distal part of the spinula and discontinuous below, where shingles are forming. Blue regions represent skeleton with normal 86Sr/44Ca ratio. Red lines with circles in d an e indicate RAD labeled with 86Sr. Dashed white line in e and f outlines the RAD region.
Longitudinal sections across coenosteal spinulae (Fig. 2a) show that skeleton right below the tip of the spinulae consists of two regions: dark regions (in optical transmitted light) corresponding to Rapid Accretion Deposits (RAD)25 (red arrows in Fig. 2a) and light regions to TD (yellow arrows in Fig. 2a), which define the width of the spinulae. The skeleton between spinulae consists of shingles (blue arrows in Fig. 2a). Because of distinct structural boundaries between spinulae and the shingles it was suggested that the shingles develop as a secondary filling deposit between already formed spinulae24.
We have visualized morphogenesis of Acropora (A. eurystoma) microstructural components by NanoSIMS ion microprobe and SEM imaging of skeletons pulse-labeled with 86Sr (Fig. 2d–f, see Methods)26. The first labeling pulse (12 hours during daytime) of 86Sr (“L1”) indicates the deposition of a continuous layer of skeleton in the distal part of the coenosteal spinulae. However, about 50–60 micrometers below the spinula tip the continuous labeling gives way to ca. 10–20 μm long, discontinuous “crescent” zones (Fig. 2f). A similar pattern is observed in subsequently labeled skeletal layers (“L2–L4”). These two characteristic features, i.e., continuous vs. discontinuous/crescent-like, correspond to the smooth distal part and the incipient shingles in the more proximal part of the spinulae, respectively (Fig. 1d,e). The most central part of the skeleton consists of RAD (inside dashed line in Fig. 1e) that, particularly in the lower portion of the skeleton, are visible as hollowed-out areas in polished and etched section. Growth layer L3 shows correlation between the hollowed-out areas and the relatively thickly 86Sr-labeled regions (regions marked with red circles in Fig. 2d,e). These observations demonstrate that skeletal tips and shingles are formed synchronously but that different dynamics of biomineralization exist in different skeletal zones. Moreover, the distinct physical shape of the shingles and a growth pattern (visualized by the 86Sr labeling) limited to narrow distal growth-fronts suggest compartmentalization of the biomineralization space into smaller units. This is consistent with observations of a direct 3D complementarity between the morphology of the calicoblastic cell layer and that of the skeleton at the ultrastructural level21,27, strengthening the notion of strong biological control.
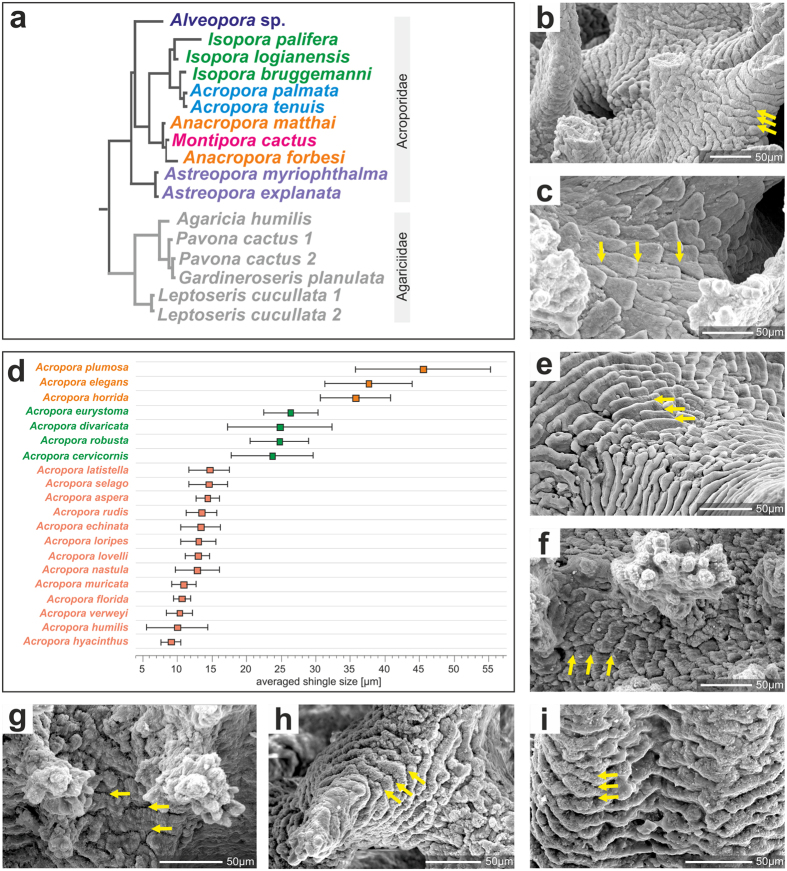
The shingle ultrastructural features are pervasive throughout all Acropora species groups studied here (SI-Figs 2–7 and 8a–d). However, the shape and dimensions of the shingles may differ between species (Fig. 3d, SI-Table 2). In some species, such as A. muricata (type species), A. echinata, A. loripes, and A. aspera the distance between the growing fronts of overlapping shingles is relatively small (ca. 10 μm; Fig. 3d), whereas in other species (e.g., A. plumosa, A. elegans and A. horrida) these distances are well above 20 μm (e.g., Fig. 3c). The shingle units are developed in all representatives of Acroporiidae i.e., Isopora, Alveopora, Anacropora, Astreopora, and Montipora (Fig. 3). They are distinct and regularly developed in Alveopora (often are ca. 50–100 (and more) micrometers wide, Fig. 3e, also SI-Fig. 8F), Montipora (Fig. 3h) or less regular in Isopora (Fig. 3f) and Anacropora (Fig. 3g).
Figure 3. Phylogenetic relationships of Recent acroporid taxa and their skeleton surface textures.
(a) phylogenetic tree inferred by Bayesian analysis of combined mitochondrial cox1 and cob DNA sequences3. All acroporids show shingled thickening deposits (b,c,e–i) but their arrangement and sizes differ among taxa (usually a species-level character), (d) there are 3 major size-classes of shingles within the genus Acropora, defined as the distance between the growing fronts of overlapping shingles (yellow arrows in b,c,e–i): (b), Acropora echinata (ZPAL H.25/83(534B)) illustrates small shingles, (c) Acropora elegans (ZPAL H.25/84(538A) illustrates large shingles. Shingles in other acroporids are illustrated with Alveopora allingi (e), ZPAL H.25/72(550A), Isopora crateriformis (f), ZPAL H.25/79(548), Anacropora forbesi (g), ZPAL H.25/87(800), Montipora verrucosa (h), ZPAL H.25/116(804), and Astreopora myriophtalma (i), ZPAL H.25/103(799). SEM images. Other examples are provided in SI-Figs 2–5.
Among non-acroporid coral taxa, shingle-like structures are only exceptionally observed. The few exceptions include some agariciids7, a group phylogenetically closely related to Acroporidae (SI-Fig. 10a). In Flabellidae, which belongs to the same superclade Complexa as acroporids quite similar, albeit larger shingles can be observed (SI-Fig. 10b). In all other corals (Robust and Basal superclades) shingle-like structures bearing close resemblance to those of the Acroporidae are absent (SI-Fig. 10c).
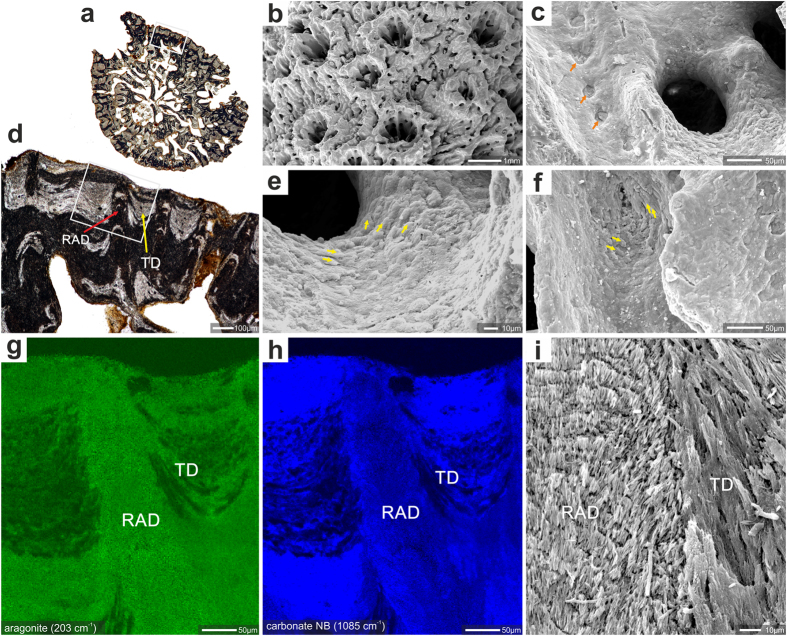
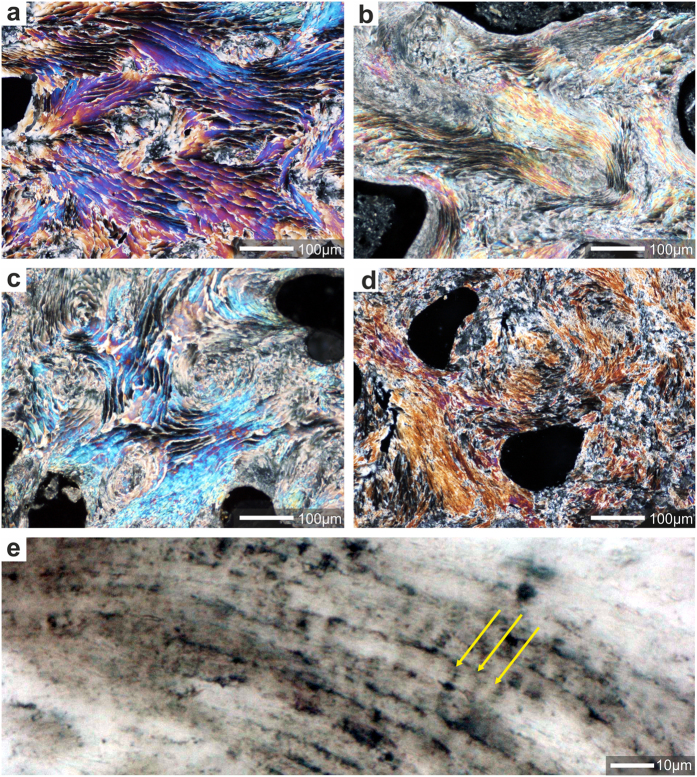
Among the fossils, the oldest Acropora skeleton dates from Paleocene (ca. 59–56 Ma) deposits in Somalia28. These samples are, however, completely recrystallized and micro-scale details are not discernible. Here, we have examined for the first time the microstructures of exceptionally preserved Acropora fossils from several localities whose ages range from Eocene to Miocene (ca. 48 to 16 Ma, respectively; SI Table 3). Samples were initially screened for mineralogy with micro-Raman spectrometry and only skeletons with purely aragonitic thickening deposits were selected for further study (Fig. 4g,h, SI-Fig. 9). The microstructure of these fossil samples is indistinguishable from that of modern representatives of Acropora. For example, in regions with a well-preserved shingle texture, distal parts of skeletal protrusions (spinulae, septa) are relatively smooth (Fig. 4f). Occasionally, even details rarely preserved in fossil samples, such as rows of attachment scars of the soft tissue (imprints of desmocyte cells), can be observed with distributions indistinguishable from those in modern representatives of Acropora (Fig. 4c,f). In transverse thin sections of fossil coral branches, features identical to shingles of extant Acropora are observed: well defined bundles of fibers have lengths of several hundreds of micrometers and incremental growth lines every ca. 5 μm (Fig. 5e). In addition, a distinct concentric pattern of shingles is developed around the sections of spinulae (Fig. 5a–d). These observations indicate that the skeletal formation process was strongly biologically controlled and that skeletal micro/ultra-structures are reliable indicators of phylogenetic relations among scleractinian corals. The remarkable evolutionary stability of the Acropora biomineralization pattern exists despite major global geochemical fluctuations, from greenhouse (high pCO2) conditions and low seawater Mg/Ca (calcitic seas) in the Eocene to icehouse (low pCO2) conditions and rapidly increasing Mg/Ca (aragonite seas) during the Oligocene-Miocene (Fig. 6).
Figure 4. Example of good preservation of skeletal features (mineralogy, surface texture and microstructure) in fossil Acropora.
Acropora sp. ZPAL H.27/20(C21), Oligocene (Chattian), Saint-Paul-lès-Dax, France. (a) transverse section of corallum branch with white rectangle (enlargement in (d)) indicating region analyzed with micro-Raman (g,h); shingled thickening deposits marked with yellow and region of rapid accretion deposits with red arrows. Surface of the branch with lateral corallites and coenosteum (b). Enlargment of the calice surface (c) with desmocyte attachment scars (orange arrows). Shingled thickening deposits, (yellow arrows in (e,f)) are still discernible, although this feature usually is the first that is eroded. Micro-Raman maps (g,h) of region indicated in d: aragonite lattice mode at 203 cm−1 (g), and carbonate vibrational mode at 1085 cm−1 (h) to show that skeleton is entirely aragonite. RAD are composed of more compact skeletal tissue in comparison to TD deposits and consequently epoxy impregnated only TD deposits (black areas), (i) contact zone (polished and etched surface) between RAD and TD (shingles) deposits. Note regular increment lines in RAD and elongated bundles of fibers composing TD.
Figure 5. Evolutionary continuity of shingle-like biomineralization pattern in Acropora lineage.
(a–d) Direct comparison of microstructural features of modern (a) and fossil (b–d) aragonite skeletons of Acropora showing evidence of continuous growth of shingles. Shown are ultra-thin transverse sections (polarized transmitted light, crossed Nicols) of: (a) extant A. muricata (ZPAL H.25/90(535B)), (b) Miocene (Burdigalian) Acropora exerata (ZPAL H.27/28(C56)), (c) Miocene (Aquitanian) Acropora sp. (ZPAL H.27/23(C54)); (d) Middle Eocene Acropora alvarezi (ZPAL H.27/18(C100)), (e) regular incremental growth lines (yellow arrows) in shingled thickening deposits in Miocene (Aquitanian) Acropora sp. (ZPAL H.27/23(C54).
Figure 6. Evolutionary continuity of shingle-like biomineralization pattern in Acropora lineage across geochemical gradients.
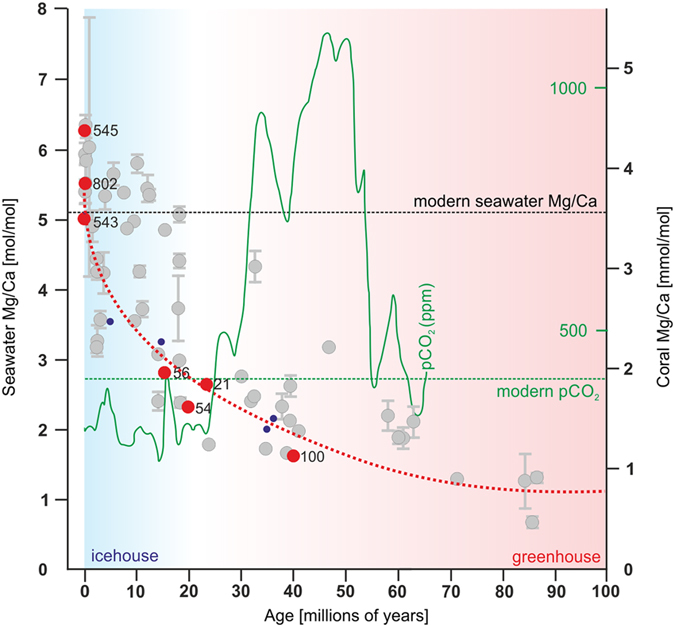
Seawater Mg/Ca composition during last 100 Ma inferred from diverse well preserved fossil corals (grey circles) following Gothman et al.29. Red circles represent Mg/Ca of seawater inferred from extant (ZPAL H.25/12(545), ZPAL H.25/86(802), ZPAL H.25/80(543A)) and best preserved aragonite fossil Acropora samples (C-SCL-56, ZPAL H.27/23(C54), ZPAL H.27/20(C21), ZPAL H.27/18(C100)). Red, dashed line is the seawater Mg/Ca reconstruction based on halite fluid inclusions (blue dots)32. Conventionally Mg/Ca of 2 was considered a boundary between aragonite and calcite precipitation (aragonite/calcite seas) but recent experiments40 show that there is a gradual and temperature-dependent shift in calcium carbonate polymorph proportions. Green curve indicates estimates of atmospheric CO2 reconstructed from terrestrial and marine proxies41. Horizontal dashed green line indicates the present-day atmospheric CO2 concentration (ca. 400 ppm).
Mg/Ca ratios were measured in shingled thickening deposits by NanoSIMS in well-preserved fossils and extant samples of Acropora. Figure 6 shows measured average Mg/Ca ratios in Acropora skeletons plotted along with measurements previously obtained from a diverse suite of modern and fossil, non-acroporid corals29. The reconstructed seawater Mg/Ca ratios from fossil Acropora are generally consistent with the seawater Mg/Ca history derived from other fossil corals (grey circles) and other archives for the last 50 My29. However, the Acropora Mg/Ca ratios display significantly less scatter and trace a rapid increase of the inferred Mg/Ca ratio of the seawater from the Eocene (~1.5 mmol/mol) to the present (~5.2 mmol/mol), which is commonly thought to include a transition from calcite to aragonite seas30.
It has been suggested that scleractinians exert only partial control over their skeletal mineralogy. In laboratory experiments, Acropora (A. cervicornis) was reported30 to produce calcite in progressively higher percentages with reduction of the ambient Mg/Ca ratio below 3.5. In contrast, our results suggest that the Acropora lineage has maintained remarkable evolutionary stability with regard to both skeletal mineralogy and biomineralization pattern despite the major Mg/Ca fluctuations in the Cenozoic. Along with observations that extant corals are capable of up-regulating pH at the site of calcification, thereby enhancing their resilience to the effects of ocean acidification31, our study of fossil Acroporidae indicates that these corals can also accommodate long-term, i.e., relatively slow Mg/Ca fluctuations. Acroporids continued to form aragonitic skeletons across the Paleocene-Eocene and Oligocene-Miocene epochs but their skeletons also registered the changing Mg/Ca ratio of seawater geochemistry (Fig. 6)32. This suggests that a selection of samples representing the same ecological niche and phylogenetic lineage minimizes the scatter from “vital” effects. Together, the observations make the Acroporidae skeletons material of highest priority for environmental reconstruction.
Methods
Structural analyses
Polished sections were examined using a Nikon Eclipse 80i transmitted light microscope fitted with a DS-5Mc cooled camera head. Observations were conducted in transmitted and polarized light. Crystallographic orientation of the aragonite fibers was assessed by observations in polarized light: identical interference colors or complete light extinction of bundles of fibers in polarized light indicate similar arrangement of axes of individual crystallographic domains. One specimen of A. cervicornis was also examined with the EBSD technique following established procedures33. Briefly, after a final polishing with diamond compound on a lead plate the surface was manually polished using a suspension of colloidal silica (SYTON) for about 25 min. Next, after cleaning with distilled water, the sample was carbon coated (0.8 sec) and examined with a FESEM (1530 Gemini, Zeiss) equipped with a Nordlys EBSD device (HKL Technology, supplied by OXFORD instruments). The operating conditions for the SEM were a beam energy of 20 kV, an aperture of 60 microns, a working distance of 25 mm, and a tilt angle of 70°. The orientation of the mapped aragonite crystals is indicated by colors: similar directions have similar color. The crystallographic axes and faces of selected areas are plotted into the lower hemisphere of a Schmidt net.
Some sections were also examined using Phillips XL20 scanning electron microscope. For these analyses, the skeletons were gently etched for ca. 10 seconds in 0.1% formic acid, and then rinsed with Milli-Q water and air-dried. After drying, the specimens were put on stubs with double sticky tape and sputter-coated with conductive platinum film.
Mineralogy of specimens of fossil Acropora was analysed with a LabRAM HR Raman confocal microscope (Horiba Jobin Yvon) equipped with a LPF Iridia edge filter, a 600 or 1800 groove mm−1 holographic grating and a 1024 × 256 pixel Peltier-cooled Synapse CCD detector. The microscope attachment was based on an Olympus BX41 system with an MPLN100x objective and a motorized software-controlled x-y-z stage. The excitation source was the second harmonic of the diode-pumped Nd:YAG laser (Excelsior-532-100, Spectra-Physics) operating at 532.3 nm with ca. 2 mW power on the sample. Raman maps were recorded at 1 s integration time with 1 μm × 1 μm spatial resolution. Calcium carbonate polymorphs show several bands attributable to internal mode vibrations of the carbonate ion and rotational and translational lattice modes. For aragonite, the most intense peak appears at 1085 cm−1, which is assigned to the symmetric stretching mode of the carbonate ion. The same band for calcite is only slightly shifted towards higher energy. A characteristic doublet assigned to the in-plane bending mode of CO32− anion is seen at ca. 701 and 705 cm−1 in the spectrum of aragonite. These peaks are absent in calcite. Instead, a single band is observable at 711 cm−1. The most convenient signals allowing identification of the polymorph are grouped in the 100–300 cm−1 region. These peaks, associated with lattice vibrations, appear at 203 cm−1 and 153 cm−1 for aragonite. For calcite, the bands can be found at 281 cm−1 and 154 cm−1.
Growth and 86Sr labeling experiments
Apical branch fragments of A. eurystoma colonies approximately 5 cm long were collected by SCUBA diving from 5–6 meters depth at the coral reef near the Inter-University Institute (IUI) in Eilat, Gulf of Aqaba, Red Sea (CITES #38406). The fragments were transferred to an outdoor, shaded running seawater table at the IUI for a month acclimation before the experiment started. A. eurystoma coral nubbins were labeled with 86Sr for 12 hours in individual glass beakers containing 500 ml of seawater enriched with 10 mg/L dissolved 86SrCO326,34. A stream of air was gently bubbled in each beaker with a Pasteur pipet to mix the labeled seawater around the nubbin and to equalize oxygen and CO2 levels. Successive (L1-L4) 12 h labeling pulses took place during daytime (7:00 am to 7:00 pm) separated by 36 h intervals of growth in unlabeled seawater with normal isotopic abundances. At the end of the last labeling pulse, nubbins were snap-frozen at −80 °C to stop metabolic and biomineralization processes. For skeletal analysis, coral tissue was removed using a jet of filtered seawater (Waterpik method) and was bleached (20 minutes in 5% NaClO). Skeleton was embedded in Körapox resin and polished sections of apical corallites parallel to the vertical growing axis. The 86Sr/44Ca distribution was mapped with a NanoSIMS ion microprobe, following established procedure26,35,36. For orientation of the 86Sr labeling with the skeletal microstructure, Scanning Electron Microscopy (SEM) images of mildly etched skeleton were taken using a FEI Philips XL 20 instrument. Bleached skeletal branch tips were mounted on SEM stubs and observed platinum-coated.
Trace element analyses
Trace element (Mg/Ca) analyses were performed with a NanoSIMS ion microprobe on polished (0.25 mm diamond suspension) and gold-coated (20 nm) skeletal surfaces embedded in Körapox® epoxy following established procedures37,38. A primary beam of O− (40–50 pA) produced secondary ions of 24Mg+ and 44Ca+ that were transferred to the multi-collection mass-spectrometer and detected simultaneously in electron multipliers at a mass resolving power of ~5000. At this mass-resolving power, the measured secondary ions are resolved from potential interferences. The data were obtained as spot analyses after pre-sputtering (120 seconds) with the primary ions focused to a spot-size of ~400 nm and stepped across the sample surface with a step-size of 5 micrometers (SI-Fig. 11). The measured 24Mg/44Ca ratios were calibrated against analysis of a carbonate standard of known composition (OKA-C)39. The chemical variations recorded in the coral skeletons are much larger than both the internal and external reproducibility of the standards, which are typically less than 3% for Mg/Ca (2 standard deviations).
Additional Information
How to cite this article: Stolarski, J. et al. A unique coral biomineralization pattern has resisted 40 million years of major ocean chemistry change. Sci. Rep. 6, 27579; doi: 10.1038/srep27579 (2016).
Supplementary Material
Acknowledgments
This work was supported in part by the following projects: Italian National Project PRIN MIUR 2010–2011 “Past Excess CO2 worlds: biota responses to extreme warmth and ocean acidification” (F.B. and J.S.); Polish-Norwegian Research Programme operated by the National Centre for Research and Development under the Norwegian Financial Mechanism 2009–2014 in the frame of Project Contract No. Pol-Nor/196260/81/2013 (J.S.); European Research Council Advanced Grant 246749 (BIOCARB) (AM), and MNHN ATM ‘Biomineralization’ program (A.M. and I.D.-C.). We thank Jill Darrell (NHM), and Marco Taviani (ISMAR, CNR) for loaning supplementary specimens used in this study. The manuscript benefited from the thoughtful reviews of Alberto Perez-Huerta (The University of Alabama, U.S.A.) and an anonymous reviewer.
Footnotes
Author Contributions J.S. and F.R.B. designed research. J.S., F.R.B. and A.M. wrote the main manuscript text, C.C.W. and A.M.G. wrote small parts of the manuscript. J.S. prepared figures. A.M., M.M. and R.D.N. contributed analysis tools. E.G.-H., I.D.-C., O.L. and A.S. performed the experiments. All authors reviewed the manuscript.
References
- Romano S. L. & Palumbi S. R. Evolution of scleractinian corals inferred from molecular systematics. Science 271, 640–642 (1996). [Google Scholar]
- Romano S. L. & Cairns S. D. Molecular phylogenetic hypotheses for the evolution of scleractinian corals. B. Mar. Sci. 67, 1043–1068 (2000). [Google Scholar]
- Fukami H. et al. Mitochondrial and nuclear genes suggest that stony corals are monophyletic but most families of stony corals are not (Order Scleractinia, Class Anthozoa, Phylum Cnidaria). PLoS ONE 3, e3222 (2008). [DOI] [PMC free article] [PubMed] [Google Scholar]
- Cuif J. P., Lecointre G., Perrin C., Tillier A. & Tillier S. Patterns of septal biomineralization in Scleractinia compared with their 28S rRNA phylogeny: a dual approach for a new taxonomic framework. Zool. Scr. 5, 459–473 (2003). [Google Scholar]
- Budd A. F. & Stolarski J. Searching for new morphological characters in the systematics of scleractinian reef corals: comparison of septal teeth and granules between Atlantic and Pacific Mussidae. Acta Zool. 90, 142–165 (2009). [Google Scholar]
- Benzoni F., Arrigoni R., Stefani F. & Stolarski J. Systematics of the coral genus Craterastrea (Cnidaria, Anthozoa, Scleractinia) and description of a new family through combined morphological and molecular analyses. Syst. Biodivers. 10, 417–433 (2012). [Google Scholar]
- Kitahara M. V. et al. The first modern solitary Agariciidae (Anthozoa, Scleractinia) revealed by molecular and microstructural analysis. Invertebr. Syst. 26, 303–315 (2012). [Google Scholar]
- Stolarski J. et al. An ancient evolutionary origin of Scleractinia revealed by azooxanthellate corals. BMC Evol. Biol. 11, 316 (2011). [DOI] [PMC free article] [PubMed] [Google Scholar]
- Janiszewska K. et al. A unique skeletal microstructure of the deep-sea micrabaciid scleractinian corals. J. Morphol. 231, 191–203 (2011). [DOI] [PubMed] [Google Scholar]
- Allemand D., Tambutte E., Girard J. P. & Jaubert J. Organic matrix synthesis in the scleractinian coral Stylophora pistillata: Role in biomineralization and potential target of the organotin tributyltin. J. Exp. Biol. 201, 2001–2009 (1998). [DOI] [PubMed] [Google Scholar]
- Cuif J. P. et al. Distribution of sulphated polysaccharides within calcareous biominerals suggests a widely shared two-step crystallization process for the microstructural growth units. Mineral. Mag. 72, 233–237 (2008). [Google Scholar]
- Cusack M. & Freer A. Biomineralization: Elemental and Organic Influence in Carbonate Systems. Chem. Rev. 108, 4433–4454 (2008). [DOI] [PubMed] [Google Scholar]
- Drake J. L. et al. Proteomic analysis of skeletal organic matrix from the stony coral Stylophora pistillata. Proc. Natl. Acad. Sci. USA 110, 3788–3793 (2013). [DOI] [PMC free article] [PubMed] [Google Scholar]
- Wang X. T. et al. Isotopic composition of skeleton-bound organic nitrogen in reef-building symbiotic corals: A new method and proxy evaluation at Bermuda. Geochim. Cosmochim. Acta 148, 179–190 (2015). [Google Scholar]
- Wallace C. C. Staghorn corals of the world: a revision of the coral genus Acropora (Scleractinia; Astrocoeniina; Acroporidae) worldwide, with emphasis on morphology, phylogeny and biogeography 1–421 (CSIRO Publishing, Melbourne, 1999). [Google Scholar]
- Ramos-Silva P. et al. The skeletal proteome of the coral Acropora millepora: The evolution of calcification by co-option and domain shuffling. Mol. Biol. Evol. 30, 2099–2112 (2013). [DOI] [PMC free article] [PubMed] [Google Scholar]
- Hayward D. C. et al. Differential Gene Expression at Coral Settlement and Metamorphosis - A Subtractive Hybridization Study. PLoS ONE 6, e26411 (2011). [DOI] [PMC free article] [PubMed] [Google Scholar]
- Shinzato C. et al. Using the Acropora digitifera genome to understand coral responses to environmental change. Nature 476, 320–323 (2011). [DOI] [PubMed] [Google Scholar]
- Moya A. et al. Whole transcriptome analysis of the coral Acropora millepora reveals complex responses to CO2-driven acidification during the initiation of calcification. Mol. Ecol. 21, 2440–2454 (2012). [DOI] [PubMed] [Google Scholar]
- Bourne G. C. Studies on the structure and formation of the calcareous skeleton of the Anthozoa. Q. J. Microsc. Sci. 41, 499–547 (1899). [Google Scholar]
- Gladfelter E. H. Skeletal development in Acropora cervicornis II. Diel patterns of calcium carbonate accretion. Coral Reefs 2, 91–100 (1983). [Google Scholar]
- Isa Y. An electron microscope study on the mineralization of the skeleton of the staghorn coral Acropora hebes. Marine Biology 93, 91–101 (1986). [Google Scholar]
- Constantz B. R. Skeletal Organization in Caribbean Acropora Spp. (Lamarck) In Origin, Evolution, and Modern Aspects of Biomineralization in Plants and Animals (ed. Crick R. E.) 175–199 (Plenum Press, 1989). [Google Scholar]
- Nothdurft L. D. & Webb G. E. Microstructure of common reef-building coral genera Acropora, Pocillopora, Goniastrea and Porites: constraints on spatial resolution in geochemical sampling. Facies 53, 1–26 (2006). [Google Scholar]
- Stolarski J. 3-Dimensional micro- and nanostructural characteristics of the scleractinian corals skeleton: a biocalcification proxy. Acta Palaeontol. Pol. 48, 497–530 (2003). [Google Scholar]
- Brahmi C. et al. Pulsed 86Sr-labeling and NanoSIMS imaging to study coral biomineralization at ultra-structural length scales. Coral Reefs 31, 741–752 (2012). [Google Scholar]
- Tambutté E., Allemand D., Zoccola D., Meibom A. & Lotto S. Observations of the tissue-skeleton interface in the scleractinian coral Stylophora pistillata. Coral Reefs 26, 517–529 (2007). [Google Scholar]
- Carbone, F., Matteucci, R., Pignatti, J. & Russo, A. Facies analysis and biostratigraphy of the Auradu Limestone Formation in the Berbera-Sheikh area, northwestern Somalia. Geol. Romana 29, 213–235 (1994). [Google Scholar]
- Gothmann A. M. et al. Fossil corals as an archive of secular variations in seawater chemistry since the mesozoic. Geochim. Cosmochim. Acta 160, 188–208 (2015). [Google Scholar]
- Ries J. B., Stanley S. M. & Hardie L. A. Scleractinian corals produce calcite, and grow more slowly, in artificial Cretaceous seawater. Geology 34, 525–528 (2006). [Google Scholar]
- McCulloch M. Falter J., Trotter J. & Montagna P. Coral resilience to ocean acidification and global warming through pH up-regulation. Nature Clim. Change 2, 623–627 (2012). [Google Scholar]
- Horita J., Zimmermann H. & Holland H. D. Chemical evolution of seawater during the Phanerozoic: Implications from the record of marine evaporites. Geochim. Cosmochim. Acta 66, 3733–3756 (2002). [Google Scholar]
- Richter D. K., Immenhauser A. & Neuser R. D. Electron Backscatter Diffraction (EBSD) documents randomly oriented c-axes in moonmilk calcite fibres - evidence for biologically induced precipitation. Sedimentology 55, 487–497 (2008). [Google Scholar]
- Brahmi C., Kopp C., Domart-Coulon I., Stolarski J. & Meibom A. Skeletal growth dynamics linked to trace-element composition in the scleractinian coral. Geochim. Cosmochim. Acta 99, 146–158 (2012). [Google Scholar]
- Houlbreque F. et al. Strontium-86 labeling experiments show spatially heterogeneous skeletal formation in the scleractinian coral Porites porites. Geophys. Res. Lett. 36, L04604 (2009). [Google Scholar]
- Domart-Coulon I. et al. Simultaneous extension of both basic microstructural components in scleractinian coral skeleton during night and daytime, visualized by in situ86Sr pulse labeling. J. Struct. Biol. 185, 79–88 (2014). [PubMed] [Google Scholar]
- Meibom A. et al. Distribution of magnesium in coral skeleton. Geophys. Res. Lett. 31, L23306 (2004). [Google Scholar]
- Meibom A. et al. Compositional variations at ultra-structure length-scales in coral skeleton. Geochim. Cosmochim. Acta 72, 1555–1569 (2008). [Google Scholar]
- Bice K. L., Layne G. D. & Dahl K. Application of secondary ion mass spectrometry to the determination of Mg/ Ca in rare, delicate, or altered planktonic foraminifera: examples from the Holocene, Paleogene, and Cretaceous. Geochem. Geophys. Geosyst. 6, Q12P07 (2005). [Google Scholar]
- Balthasar U. & Cusack M. Aragonite-calcite seas—Quantifying the gray area. Geology 43, 99–102 (2015). [Google Scholar]
- Beerling D. J. & Royer D. L. Convergent Cenozoic CO2 history. Nat. Geosci. 4, 418–420 (2011). [Google Scholar]
Associated Data
This section collects any data citations, data availability statements, or supplementary materials included in this article.


