Abstract
Background:
E-cadherin (CDH1) plays an important role in cell–cell adhesion of epithelial tissues. Loss of E-cadherin expression can lead to loss of tissue integrity, metastasis, and cancer progression. Also loss of E-cadherin expression might be related to aberrant promoter methylation of the CDH1 gene. Many studies have been performed on CDH1 promoter methylation, especially in breast cancer. Although most of the studies have used qualitative methods for methylation analysis, this study is designed to quantitatively investigate CDH1 promoter methylation in breast cancer and its correlation with patients’ clinicopathological features.
Materials and Methods:
Using differential high resolution melting analysis (D-HRMA), the methylation level of the CDH1 gene promoter was quantified in 98 breast cancer formalin-fixed paraffin-embedded (FFPE) tissues and also 10 fresh frozen normal breast tissues.
Results:
All samples were detected to be methylated at the CDH1 promoter region. About 74.5% of the breast cancer samples were hypermethylated with an average methylation level of around 60%, while 25.5% of the patients were methylated with the mean methylation level of about 33%, and 90% of the normal samples had a mean methylation level of about 18%. Statistical analyses represented a significant correlation between CDH1 promoter methylation and cancer progression hallmarks, such as, clinical stage, nodal involvement, tumor size, and histological grade.
Conclusion:
In summary, quantitation of CDH1 promoter methylation can serve as a diagnostic and prognostic tool in breast cancer. Also D-HRMA can be used as a fast and reliable method for quantitation of promoter methylation.
Keywords: Breast cancer, CDH1, FFPE, high resolution melting analysis, promoter methylation
INTRODUCTION
The CDH1 gene encodes a transmembrane glycoprotein called E-cadherin that plays an important role in the cell–cell adhesion of epithelial tissues.[1] This gene is located at chromosome 16q22.1, a region that is often associated with loss of heterozygosity in human breast cancer, and thus, is thought to cause loss of function of this tumor suppressor gene.[1] Loss of expression or function of E-cadherin can lead to epithelial mesenchymal transition (EMT), a process that can result in loss of tissue integrity, and is an essential step in cancer progression.[1,2] As studies show, reduced E-cadherin expression is correlated with metastasis, decreased disease-free survival, and poor prognosis, in a variety of cancers, including breast cancer.[1,3] Also some studies have demonstrated that aberrant DNA methylation in the promoter region of the CDH1gene might be an alternative mechanism for the loss of expression of E-cadherin.[1,2,3]
Aberrant methylation, including hypermethylation or hypomethylation of the promoter region of cancer-related genes, plays an important role in the developing of many cancers. Hypermethylation of tumor-suppressor genes can lead to transcriptional silencing, and hypomethylation of the proto-oncogenes might activate them into oncogenes.[4] As changes in DNA methylation can be recurrent in cancer, there is great interest to investigate the promoter methylation of specific tumor genes, as potential biomarkers for the early diagnosis or monitoring of cancer.[5,6] At present, many tumor-specific genes, including CDH1, have been determined for promoter methylation in various cancers, such as breast cancer.[5] Although most studies have reported low methylation frequencies of the CDH1 gene in breast cancer,[7,8,9] some recent studies have shown that hypermethylation of this gene can be correlated with more invasiveness and poorer prognosis in breast cancer.[10] In the present study we decided to further investigate CDH1 promoter methylation and its correlation with the clinicopathological variables of breast cancer patients.
Many different methods have been used to detect DNA methylation. Methylation-specific Polymerase Chain Reaction (PCR) (MSP) is one of the widely used methods for the detection of DNA methylation. Some drawbacks of MSP include the non-quantitative nature of the technique and its susceptibility to false positives or overestimation of the results.[6] Therefore, quantitative techniques for measuring the DNA methylation levels, such as, sensitive melting analysis after real time (SMART)-MSP, methylation-sensitive high-resolution melting (MS-HRM), and differential high-resolution melting analysis (D-HRMA) have recently been in the spotlight.[6,11,12,13,14] In the present study we have used the D-HRMA method as a fast and cost-effective method, to quantitatively determine the promoter methylation of the CDH1gene in archival formalin-fixed paraffin-embedded (FFPE) blocks from breast cancer patients.
Formalin-fixed paraffin-embedded blocks represent a considerable and enormous source for testing and analyzing clinically important diseases. To the best of our knowledge, to date, a few studies have been performed on the efficacy of D-HRMA in FFPE blocks of patients.[13,15] Finally, we can correlate CDH1 promoter methylation with the patients’ clinicopathological features.
MATERIALS AND METHODS
Patient samples and controls
A total of 98 FFPE tissue samples from breast cancer patients, related to years 2005 to 2009, were collected from the Department of Pathology at the Imam Khomeini and Shafa University Hospitals, in Ahvaz, Iran. The samples were identified as ductal carcinoma in situ (DCIS) (n = 8), invasive ductal carcinoma (IDC) (n = 65), invasive and in situ ductal carcinoma (DCIS + IDC) (n = 20), invasive lobular and ductal carcinoma (ILC + IDC) (n = 2), and inflammatory carcinoma (n = 3). In addition, 10 fresh frozen normal breast tissue samples from the marginal tissues of tumor in breast cancer patients were obtained and analyzed. Ethical guidelines were met for sample collection.
EpiTect Methylated and Bisulfite converted Control DNA (Qiagen, Germany) and EpiTect Unmethylated and Bisulfite converted Control DNA (Qiagen, Germany) were used as positive (100% methylated) and negative (0% methylated) controls, respectively. Also EpiTect Unmethylated and Unconverted Control DNA (Qiagen, Germany) were used as the control for bisulfite modification.
A series of standard dilutions of methylated DNA was prepared by diluting 100% methylated and bisulfate-treated control DNA on a background of unmethylated and bisulfate-treated control DNA in ratios of 75, 50, 25, and 10%.
Genomic DNA extraction and sodium bisulfite modification
After reviewing the stained slides of each patient by the pathologist and selecting the appropriate ones, after containing the maximum percent of cancer cells, the related paraffin blocks were cut into six micron slices by the means of a microtome. The genomic DNA from the patient samples was isolated from the materials scraped from the paraffin blocks, using the QIAamp DNA FFPE Tissue Kit following the manufacturer's instructions (Qiagen, Germany). The genomic DNA of fresh frozen normal tissues was extracted by the standard SDS-proteinase K digestion and phenol–chloroform extraction technique.
The DNA concentration of the samples was determined by the NanoDrop 2000 instrument (Thermo Scientific) and bisulfite modification was performed using the Epitect Bisulfite Kit (Qiagen, Germany), according the manufacturer's protocol. Bisulfite-converted DNA was resuspended in 20 μl of elution buffer and used for D-HRMA. To control the bisulfite modification method, EpiTect Unmethylated and Unconverted Control DNA (Qiagen, Germany) was used as the template for bisulfite modification.
Differential high resolution melting analysis
A Rotor-Gene™ 6000 (Corbett Research, Australia) was used for PCR amplification and HRM analysis. A pair of primers were designed by Methprimer Software (Li Lab, USA), generating a 120 bp amplicon with 4 CpG sites. The primer sequences for CDH1 (HGNC: 1748) were as follows: meCDH1F120: 5’-GGT TGG GTA ATA TAG GGA GAT ATA G-3’ and meCDH1R120: 5’-AAA ATA CAA ATA CAC ACC ACC AC-3’.
Polymerase chain reaction was performed in 20 μl volume containing: 1X Epitect HRM PCR Master Mix (Qiagen, Germany), 750 nM of each primer, and a 100-ng bisulfite-converted DNA template. The touchdown amplification program was, a five-minute hold at 95°C, followed by 55 cycles, including 10 seconds of denaturation at 95°C, 30 seconds of annealing at 55°C, decreasing 0.2°C per cycle to 50°C, and then 10 seconds extension at 72°C. An optional denaturation and renaturation step were performed for 30 seconds at 95°C and 30 seconds at 50°C, followed by HRM step ramping from 60°C to 85°C, rising 0.1°C every two seconds.
Using the software provided by Rotor-Gene 6000, the normalization of melting curves was carried out for two normalization regions before and after the major fluorescence decrease. This algorithm permitted direct comparison of samples with different starting fluorescence levels. The differential graph was assessed for each sample by comparing the value of fluorescence at the melting point against the value of fluorescence of unmethylated control. All samples were analyzed in duplicate.
Statistical analysis
The samples were considered as hypermethylated when the measured methylation level exceeded the mean methylation level of the normal samples by twice the standard deviation of the normal samples, and conversely, as hypomethylated when the methylation level was less than the mean methylation level of normal samples by twice the standard deviation of normal samples. Correlations between the methylation levels and samples’ demographic and clinical variables were analyzed using the Pearson and Kendall's tau-b correlation tests. Also, the analysis of variance (ANOVA) and independent t test were used to compare the methylation level of the samples. The Chi-square test, Fisher's exact test, and nonparametric Kruskal-Wallis test were used to determine the relation between the methylation status and different demographic and clinical factors. All analyses were performed using the Statistical Package for Science Software version 16.0. A P value < 0.05 was considered statistically significant.
RESULTS
The linearity of CDH1 D-HRMA
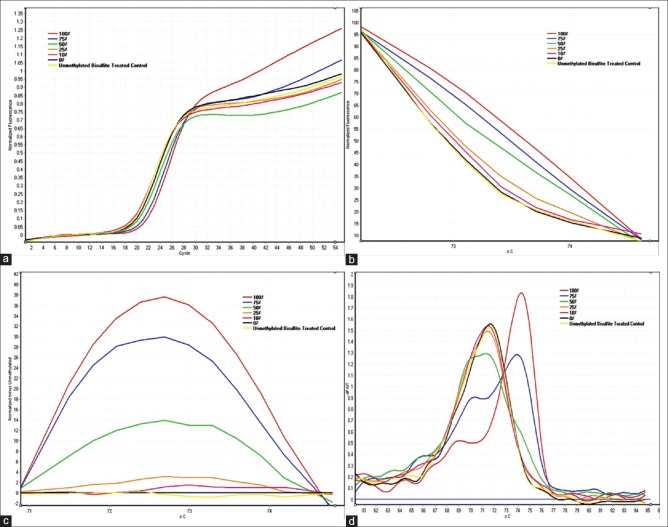
The linearity of the D-HRMA assays was tested using standard dilutions of methylated DNA as described under the Materials and Methods section. Unmethylated and Unconverted Control DNA was used as the control for bisulfite modification. All dilutions showed amplification plots with comparable Ct values [Figure 1a]. The normalized fluorescence HRM graph represented different HRM profiles for various amplicons, indicating their differences in melting points [Figure 1b]. The differential fluorescence graph was obtained by normalizing HRM profiles against the unmethylated control DNA [Figure 1c]. Also the melting curve of the standard dilutions identified the specificity of the assay [Figure 1d]. Due to differences in the fluorescence of the dilutions, differential analysis resulted in peaks with various heights. The highest peak corresponded to the fully methylated DNA. The height of the other peaks decreased proportionally to the decreasing the amount of methylation percentage in the standard dilutions. The Rotor-Gene 6000 software made it possible to obtain the value of height for each differential fluorescence peak [Figure 2a]. These values were then plotted against the dilution factors, to produce a linear calibration curve [Figure 2b].
Figure 1.
CDH1 D-HRMA graphs using serial dilutions of methylated DNA (from 100 to 0%) (a) The amplification plots were obtained for all standard dilutions (from 100 to 0% methylated DNA) as the template, with comparable Ct values; (b) The normalized fluorescence HRM profiles of various amplicons, amplified from each standard diluted methylated DNA; (c) The differential fluorescence plots were obtained by normalizing the HRM profiles against the unmethylated DNA; (d) The melting curve of the standard dilutions identified the specificity of the assay
Figure 2.
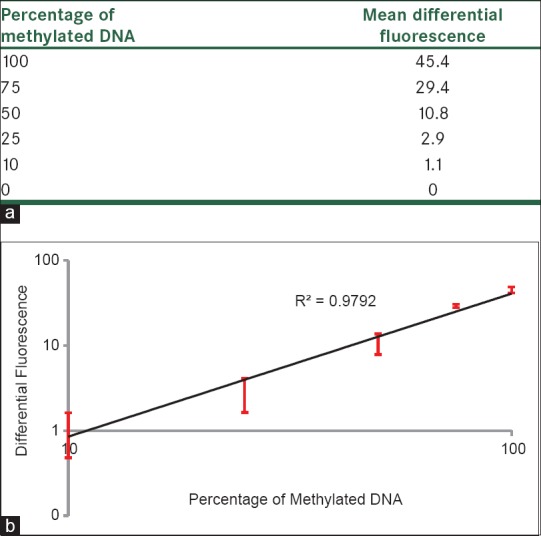
Differential fluorescence values and the standard curve of the serial dilutions of methylated DNA (from 100 to 0%); (a) Differential fluorescence values obtained at the melting point of each standard dilution; (b) The standard curve generated by plotting the differential fluorescence values against the percentage of methylation. All the dilutions were tested in duplicate
CDH1 methylation D-HRMA in breast cancer
After the preliminary verification of D-HRMA in quantifying the methylation percentage of the CDH1 promoter region in unknown samples, we determined the concentration of methylated DNA in the DNA extracted from 98 breast cancer FFPE tissues and 10 normal breast tissues. The DNA samples were subjected to PCR amplification and HRM, and the resulting plots were used to calculate the methylation levels. Both the methylation status and level were analyzed against demographic and clinicopathological features. Table 1 summarizes the samples’ information and the results obtained by statistical analysis.
Table 1.
Clinical characteristics of the analyzed samples and analysis of CDH1 promoter methylation according to variables
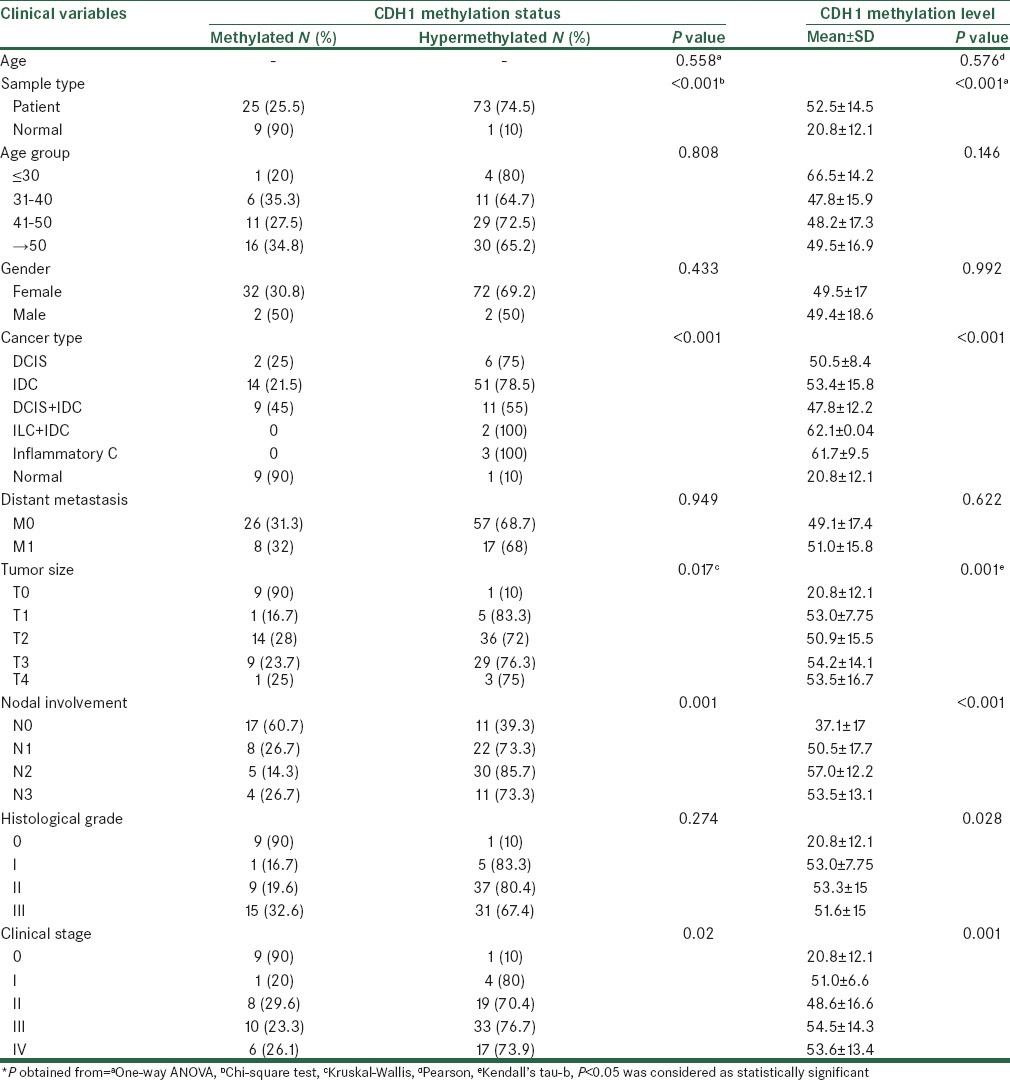
Nine out of 10 normal samples were methylated with a mean methylation level of 17.92 ± 8.44. Also one of the normal samples showed a methylation level of 46.85 and was classified as hypermethylated. Among the breast cancer samples, 74.5% were categorized as hypermethylated, with an average methylation level of 59.31 ± 8.49. The remaining 25.5% of the patients were found to be methylated showing a mean methylation level of 32.59 ± 9.24. Statistical analyses represented a significant correlation between the CDH1 promoter methylation status and/or level and the sample type (P < 0.001).
However, the Chi-square and one-way ANOVA tests showed a significant association between the CDH1 methylation status and level and the cancer type (P < 0.001). The Tukey and Bonferroni post hoc tests never demonstrated any significant difference in the methylation levels of various cancer types.
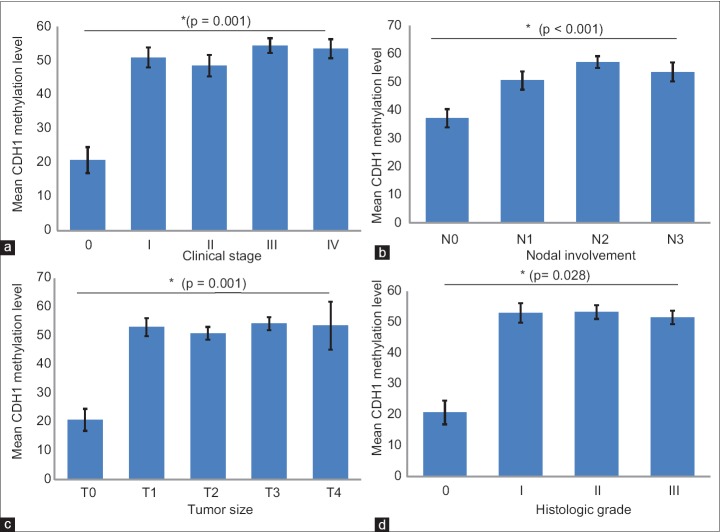
Statistical analyses also showed a significant association between the CDH1 promoter methylation status and/or the level and the cancer clinical stage (P = 0.02 and or P = 0.001, respectively). Both the CDH1 methylation status and level were significantly correlated with the nodal involvement (P < 0.001). A significant correlation was also found between the CDH1 promoter methylation status and or level and tumor size (P = 0.017 and or P = 0.001, respectively). Although the nonparametric Kruskal-Wallis test did not show any significant association between the CDH1 methylation status and the histological grade (P = 0.274), according to Kendall's tau-b test the CDH1 methylation level was significantly associated with the histological grade (P = 0.028). No significant correlation was seen between the CDH1 methylation status or level and distant metastasis, patients’ age, and gender. Figure 3 shows the association between the CDH1 methylation level and the cancer clinical stage, nodal involvement, tumor size, and histological grade.
Figure 3.
Association between CDH1 methylation level and (a) cancer clinical stage; (b) Lymph node metastasis; (c) Tumor size; (d) Histologic grade. Error bars represent the standard error of means
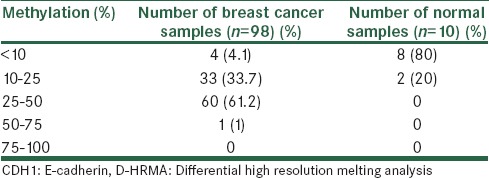
Furthermore, in comparison with 80% of the normal samples, which had a methylation level below 10%, in 60 out of 98 breast cancer patients (61.2%), the CDH1 methylation was detected to be between 25 and 50%. In the DNA from 33 patients (33.7%), the methylation level was seen to be between 10 and 25%. Four patients (4.1%) had a methylation level below 10% and only one patient (1%) had methylation above 50% [Table 2].
Table 2.
Screening the samples using CDH1 D-HRMA in breast cancer and normal tissues
DISCUSSION
The present study was designed to measure the promoter methylation levels of the CDH1 gene in breast cancer patients, for a further understanding of its association with the clinicopathological features of breast cancer.
We found that all the samples, including those of the normal and of the patients were methylated at the CDH1 promoter region. Of course about 75% of the breast cancer samples were hypermethylated, with an average methylation level of around 60%, while 25% of the patients were methylated with a mean methylation level of about 33 and 90% of the normal samples, and had a mean methylation level of about 18%. There was a statistically significant correlation between the CDH1 promoter methylation status and/or level and sample type. It suggested that the CDH11 promoter region tends to be hypermethylated in the breast tumor tissues in comparison with the normal breast tissues. According to the previous studies that have used qualitative methods such as MSP, the CDH1 methylation frequencies varied in the range of 5.8 – 80% in breast cancer patients.[1,8,16,17,18] A reason that was suggested for the different frequencies of promoter methylation in breast cancers in various studies could have been a result of the differences in the ethnic and socioeconomic characteristics in each area.[19]
Moreover Zou and colleagues have reported the methylation frequency of about 100% for breast cancer tissues and also tumor adjacent normal tissues, but no methylation for normal tissues from healthy volunteers.[20] This result is more similar to our result, because in our study we used the normal marginal tissues of tumor as the normal control samples. For this reason we may have seen the presence of methylation in both normal and tumor tissues, although the methylation level in tumor tissues was much higher than in the normal marginal tissues. Jeronimo and coworkers have also reported a methylation frequency of about 60% in benign tumor tissues. Therefore, it seems likely that benign and malignant breast tissues may share common epigenetic changes, although quantitatively different.[21] It suggests that CDH1 methylation may occur early, prior to tumor development. Thus, for breast tumors it can be critical for the early diagnosis and prevention of cancer.[20,21] Taking this into consideration, it will be tempting to quantitatively speculate the hypermethylation, to increase the diagnostic precision of breast lesions.[21]
Our findings show that there is a significant correlation between the CDH1 promoter methylation levels and cancer progression hallmarks, such as, the clinical stage, nodal involvement, tumor size, and histological grade. Also Jung et al. and Sebova et al. have reported a significant correlation between CDH1 promoter methylation and nodal involvement.[10,22] In contrast, Swift-Scanlan and coworkers have claimed that there is no significant association between CDH1 methylation and lymph node metastasis.[23] Rasti and colleagues have also shown that there is a significant association between CDH1 promoter methylation and tumor size.[16]
In our study, no significant correlation was seen between methylation levels and distant metastasis, although Sebova and coworkers have suggested that highly methylated CDH1 can help in identifying metastatic tumors.[10] Also, in our study no significant difference was observed in the methylation levels of various cancer types. In contrast, Hoque and colleagues have demonstrated that the CDH1 methylation level is significantly higher in IDC patients as compared to the preinvasive lesions and have suggested that CDH1 methylation may be an important step in the progression of breast ductal carcinomas.[24]
Also, no significant correlation was seen between the methylation levels and patients’ age and gender in the present study. However Rasti and coworkers have shown that CDH1 methylation may be associated with younger age. They have reported that CDH1 methylation might be slightly (P = 0.073) correlated with the patients’ age.[16] Consistent with our result, Calderia and colleagues have shown that the CDH1 methylation pattern is not correlated with the age of patients at diagnosis suggesting that it is not an age-related methylation change.[1]
In conclusion, hypermethylation of the CDH1 gene might be used as a biological marker for breast cancer and it would be worthy if we could investigate CDH1 promoter methylation quantitatively to serve as a diagnostic and prognostic tool in breast cancer. Also D-HRMA could be used as a fast, cost-effective, and reliable method for the quantitation of promoter methylation in breast cancer.
ACKNOWLEDGMENT
The authors thank Dr. Rashidi from the Pathology Section of the Shafa University Hospital, Ahvaz, Iran. This study was a part of Dr. Mojgan Naghitorabi's PhD dissertation, which was financially and technically supported by the School of Pharmacy and Pharmaceutical Sciences, Isfahan, Iran (Grant# 389389).
Footnotes
Source of Support: School of Pharmacy and Pharmaceutical Sciences, Isfahan, Iran (Grant# 389389).
Conflict of Interest: None declared.
REFERENCES
- 1.Caldeira JR, Prando EC, Quevedo FC, Neto FA, Rainho CA, Rogatto SR. CDH1 promoter hypermethylation and E-cadherin protein expression in infiltrating breast cancer. BMC Cancer. 2006;6:48. doi: 10.1186/1471-2407-6-48. [DOI] [PMC free article] [PubMed] [Google Scholar]
- 2.Lombaerts M, van Wezel T, Philippo K, Dierssen JW, Zimmerman RM, Oosting J, et al. E-cadherin transcriptional downregulation by promoter methylation but not mutation is related to epithelial-to-mesenchymal transition in breast cancer cell lines. Brit J Cancer. 2006;94:661–71. doi: 10.1038/sj.bjc.6602996. [DOI] [PMC free article] [PubMed] [Google Scholar]
- 3.Sunami E, Shinozaki M, Sim MS, Nguyen SL, Vu AT, Giuliano AE, et al. Estrogen receptor and HER2/neu status affect epigenetic differences of tumor-related genes in primary breast tumors. Breast Cancer Res. 2008;10:R46. doi: 10.1186/bcr2098. [DOI] [PMC free article] [PubMed] [Google Scholar]
- 4.Luczak MW, Jagodziński PP. The role of DNA methylation in cancer development. Folia Histochem Cytobiol. 2006;44:143–54. [PubMed] [Google Scholar]
- 5.Miyamoto K, Ushijima T. Diagnostic and therapeutic applications of epigenetics. Jpn J Clin Oncol. 2005;35:293–301. doi: 10.1093/jjco/hyi088. [DOI] [PubMed] [Google Scholar]
- 6.Kristensen LS, Mikeska T, Krypuy M, Dobrovic A. Sensitive melting analysis after real time-methylation specific PCR (SMART-MSP): High-throughput and probe-free quantitative DNA methylation detection. Nucleic Acids Res. 2008;36:e42. doi: 10.1093/nar/gkn113. [DOI] [PMC free article] [PubMed] [Google Scholar]
- 7.Kajabova V, Smolkova B, Zmetakova I, Sebova K, Krivulcik T, Bella V, et al. RASSF1A promoter methylation levels positively correlate with estrogen receptor expression in breast cancer patients. Transl Oncol. 2013;6:297–304. doi: 10.1593/tlo.13244. [DOI] [PMC free article] [PubMed] [Google Scholar]
- 8.Cho YH, Shen J, Gammon MD, Zhang YJ, Wang Q, Gonzalez K, et al. Prognostic significance of gene-specific promoter hypermethylation in breast cancer patients. Breast Cancer Res Treat. 2012;131:197–205. doi: 10.1007/s10549-011-1712-y. [DOI] [PMC free article] [PubMed] [Google Scholar]
- 9.Cho YH, Yazici H, Wu HC, Terry MB, Gonzalez K, Qu M, et al. Aberrant promoter hypermethylation and genomic hypomethylation in tumor, adjacent normal tissues and blood from breast cancer patients. Anticancer Res. 2010;30:2489–96. [PMC free article] [PubMed] [Google Scholar]
- 10.Sebova K, Zmetakova I, Bella V, Kajo K, Stankovicova I, Kajabova V, et al. RASSF1A and CDH1 hypermethylation as potential epimarkers in breast cancer. Cancer Biomark. 2012;10:13–26. doi: 10.3233/CBM-2012-0230. [DOI] [PubMed] [Google Scholar]
- 11.Wojdacz TK. Methylation-sensitive high-resolution melting in the context of legislative requirements for validation of analytical procedures for diagnostic applications. Expert Rev Mol Diagn. 2012;12:39–47. doi: 10.1586/erm.11.88. [DOI] [PubMed] [Google Scholar]
- 12.Liu W, Guan M, Su B, Li J, Ma W, Liu C, et al. Rapid determination of AKAP12 promoter methylation levels in peripheral blood using methylation-sensitive high resolution melting (MS-HRM) analysis: Application in colorectal cancer. Clin Chim Acta. 2010;411:940–6. doi: 10.1016/j.cca.2010.03.003. [DOI] [PubMed] [Google Scholar]
- 13.Balic M, Pichler M, Strutz J, Heitzer E, Ausch C, Samonigg H, et al. High quality assessment of DNA methylation in archival tissues from colorectal cancer patients using quantitative high-resolution melting analysis. J Mol Diagn. 2009;11:102–8. doi: 10.2353/jmoldx.2009.080109. [DOI] [PMC free article] [PubMed] [Google Scholar]
- 14.Malentacchi F, Forni G, Vinci S, Orlando C. Quantitative evaluation of DNA methylation by optimization of a differential-high resolution melt analysis protocol. Nucleic Acids Res. 2009;37:e86. doi: 10.1093/nar/gkp383. [DOI] [PMC free article] [PubMed] [Google Scholar]
- 15.Naghitorabi M, Mohammadi Asl J, Mir Mohammad Sadeghi H, Rabbani M, Jafarian-Dehkordi A, Javanmard HS. Quantitative evaluation of DNMT3B promoter methylation in breast cancer patients using differential high resolution melting analysis. Res Pharm Sci. 2013;8:167–75. [PMC free article] [PubMed] [Google Scholar]
- 16.Rasti M, Entezam M, Monabati A. Hypermethylation of E-Cadherin and Estrogen Receptor-α gene promoter and its association with clinicopathological features of breast cancer in Iranian patients. Iran J Med Sci. 2009;34:186–90. [PubMed] [Google Scholar]
- 17.Parrella P, Poeta ML, Gallo AP, Prencipe M, Scintu M, Apicella A, et al. Nonrandom distribution of aberrant promoter methylation of cancer-related genes in sporadic breast tumors. Clin Cancer Res. 2004;10:5349–54. doi: 10.1158/1078-0432.CCR-04-0555. [DOI] [PubMed] [Google Scholar]
- 18.Li S, Rong M, Iacopetta B. DNA hypermethylation in breast cancer and its association with clinicopathological features. Cancer Lett. 2006;237:272–80. doi: 10.1016/j.canlet.2005.06.011. [DOI] [PubMed] [Google Scholar]
- 19.Zhao L, Wang L, Jin F, Ma W, Ren J, Wen X, et al. Silencing of estrogen receptor alpha (ERalpha) gene by promoter hypermethylation is a frequent event in Chinese women with sporadic breast cancer. Breast Cancer Res Treat. 2008;117:253–9. doi: 10.1007/s10549-008-0192-1. [DOI] [PubMed] [Google Scholar]
- 20.Zou D, Yoon HS, Perez D, Weeks RJ, Guilford P, Humar B. Epigenetic silencing in non-neoplastic epithelia identifies E-cadherin (CDH1) as a target for chemoprevention of lobular neoplasia. J Pathol. 2009;218:265–72. doi: 10.1002/path.2541. [DOI] [PubMed] [Google Scholar]
- 21.Jerónimo C, Costa I, Martins MC, Monteiro P, Lisboa S, Palmeira C, et al. Detection of gene promoter hypermethylation in fine needle washings from breast lesions. Clin Cancer Res. 2003;9:3413–7. [PubMed] [Google Scholar]
- 22.Jung SP, Kim S, Nam SJ, Kim I, Bae JW. The role of the CDH1 promoter hypermethylation in the axillary lymph node metastasis and prognosis. J Breast Cancer. 2013;16:16–22. doi: 10.4048/jbc.2013.16.1.16. [DOI] [PMC free article] [PubMed] [Google Scholar]
- 23.Swift-Scanlan T, Vang R, Blackford A, Fackler MJ, Sukumar S. Methylated genes in breast cancer: Associations with clinical and histopathological features in a familial breast cancer cohort. Cancer Biol Ther. 2011;11:853–65. doi: 10.4161/cbt.11.10.15177. [DOI] [PMC free article] [PubMed] [Google Scholar]
- 24.Hoque MO, Prencipe M, Poeta ML, Barbano R, Valori VM, Copetti M, et al. Changes in CpG islands promoter methylation patterns during ductal breast carcinoma progression. Cancer Epidemiol Biomarkers Prev. 2009;18:2694–700. doi: 10.1158/1055-9965.EPI-08-0821. [DOI] [PMC free article] [PubMed] [Google Scholar]


