

Abstract
Objective
To clarify and quantify the potential association between intake of flavonoids and risk of stroke.
Design
Meta-analysis of prospective cohort studies.
Data source
Studies published before January 2016 identified through electronic searches using PubMed, Embase and the Cochrane Library.
Eligibility criteria for selecting studies
Prospective cohort studies with relative risks and 95% CIs for stroke according to intake of flavonoids (assessed as dietary intake).
Results
The meta-analysis yielded 11 prospective cohort studies involving 356 627 participants and more than 5154 stroke cases. The pooled estimate of the multivariate relative risk of stroke for the highest compared with the lowest dietary flavonoid intake was 0.89 (95% CI 0.82 to 0.97; p=0.006). Dose-response analysis indicated that the summary relative risk of stroke for an increase of 100 mg flavonoids consumed per day was 0.91 (95% CI 0.77 to 1.08) without heterogeneity among studies (I2=0%). Stratifying by follow-up duration, the relative risk of stroke for flavonoid intake was 0.89 (95% CI 0.81 to 0.99) in studies with more than 10 years of follow-up.
Conclusions
Results from this meta-analysis suggest that higher dietary flavonoid intake may moderately lower the risk of stroke.
Keywords: STROKE MEDICINE, NEUROLOGY, PUBLIC HEALTH
Strengths and limitations of this study.
This is the largest meta-analysis to date on flavonoid intake and risk of stroke.
Higher dietary flavonoid intake is associated with a significantly reduced risk of stroke.
Dose-response analyses indicated a 9% lower risk of stroke per 100 mg/day increment in flavonoids.
The possibility of residual confounding or confounding by unmeasured factors, which cannot be ruled out in any observational study, must be acknowledged.
We cannot exclude the possibility of recall bias in the assessments of diet based on food frequency questionnaires.
Introduction
Stroke is the second most common cause of death, as well as the fourth leading cause of lost productivity and the second highest cause of disability worldwide.1 2 Prevention of stroke is thus clearly an important public health priority. In recent decades, concern has mounted regarding premature incidence and mortality associated with stroke, and there is growing interest in altering risk factors and reversing this global epidemic. Among the known risk factors for stroke, dietary factors, especially dietary flavonoid intake, have aroused particular attention. Clinical studies have shown that flavonoid intake reduces cardiovascular disease (CVD) risk.3–5 Additionally, experimental studies indicated that flavonoids have both antioxidant and antithrombotic properties.6 7
Over the last two decades, many prospective studies have assessed the association between dietary flavonoid intake and risk of stroke.8–18 Although a recent meta-analysis that combined the results from eight cohort studies of flavonol intake and risk of stroke found a significant association of stroke of 0.86 (95% CI 0.75 to 0.99) for the highest versus lowest category of flavonol intake,19 the role of flavonoid intake in stroke prevention is still controversial. In addition, flavonoid intake differed substantially between studies, which makes it difficult to interpret the summary estimate based on results from study populations with different flavonoid intakes.20
To fill these gaps, we conducted a dose-response meta-analysis of the current evidence for the association between flavonoid exposure, including cohort studies of dietary flavonoids, and risk of stroke.
Methods
Literature search
The search strategy was conducted according to the Meta-analysis of Observational Studies in Epidemiology (MOOSE) guidelines.21 We performed a systematic search of PubMed, Embase and the Cochrane library through February 2015. The following key words were used in our search strategies: ‘flavonoids’, ‘polyphenols’, ‘phenolics’, ‘flavonols’, ‘flavones’, ‘quercetin’, ‘kaempferol’, ‘myricetin’, ‘isorhamnetin’, ‘apigenin’, ‘luteolin’, ‘proanthocyanidins’, ‘anthocyanins’, ‘anthocyanidins’, ‘flavan-3-ols’, ‘isoflavones’, ‘flavanones’, ‘catechins’ and ‘stroke’, ‘cerebrovascular disease’, ‘cerebrovascular disorders’, ‘cerebral infarct’, ‘ischemic stroke’, ‘intracranial hemorrhage’, ‘intracranial artery disease’, ‘cardiovascular disease’, ‘myocardial ischemia’, ‘myocardial infarct’, ‘ischemic heart disease’, ‘coronary heart disease’, and ‘longitudinal studies’, ‘cohort studies’, ‘prospective studies’ and ‘follow-up studies’. We restricted the search to human studies. There were no language restrictions. In addition, we reviewed the reference lists of obtained articles and contacted authors to identify additional relevant studies and information. When the same or a similar patient cohort was included in several publications, only the most recent or complete report was selected for analysis. This search strategy was updated on 14 January 2016.
Study selection
Studies were selected for the meta-analysis if they fulfilled the following entry criteria: (1) the study had a community-based or population-based, prospective cohort design; (2) the exposure of interest was intake of dietary flavonoids (including flavonols, flavones, flavanones, flavan-3-ols, anthocyanidins, proanthocyanidins and isoflavones); (3) the outcome of interest was stroke, including all types of stroke (fatal, non-fatal, ischaemic and haemorrhagic); (4) reported quantitative estimates of the multivariate-adjusted relative risk (RR) and 95% CI for stroke incidence or mortality associated with flavonoid intake; and (5) more than 1 year of follow-up. Studies were excluded if: (1) the study had a cross-sectional or case-control design; (2) reported unadjusted or only age- or sex-adjusted RR; and (3) there was less than 1 year of follow-up.
Data abstraction
All data were independently abstracted in duplicate by two investigators (ML and XZ). Discrepancies were resolved by consensus. When necessary, the original authors were contacted for supplementary information. The following data were extracted from each study: the first author's last name, publication year, country where the study was performed, location, number of participants, participants' age, years of follow-up, assessment of dietary data and stroke, number of cases, adjusted covariates and study quality.
bmjopen-2015-008680supp.pdf (127.7KB, pdf)
Assessment of study quality
The Newcastle-Ottawa Scale (NOS) was used to assess the quality of studies.22 The quality of cohort studies was evaluated as regards the following three major components: selection of the study group (0–4 stars), quality of the adjustment for confounding (0–2 stars) and assessment of outcome in the cohorts (0–3 stars). A higher score represents better methodological quality. The top score was nine stars. Studies were graded as high quality if they were awarded nine stars.
Statistical analysis
RRs were used as the common measure of association between flavonoid intake and stroke, and HRs were considered equivalent to RRs. Data analysis used multivariate-adjusted outcome data. We converted these values in every study by using their natural logarithms, and the SEs were calculated from these logarithmic numbers and their corresponding 95% CIs. When data on total stroke were not available, we used data from ischaemic stroke, non-fatal stroke or fatal stroke as an equivalent to total stroke.23 We combined these estimates using a random-effects model, which takes into account both within-study and between-study variabilities.24 In the dose-response analysis, the generalised least square for trend estimation method described by Greenland and Longnecker25 and Orsini et al26 was used to calculate study-specific slopes (linear trends) and 95% CIs. The method requires the distributions of cases and person-years for exposure categories, and the median/mean of flavonoid intake level for each comparison group. We assigned the midpoint of the upper and lower boundaries of each comparison group to determine mean flavonoid intake level if the median or mean intake was not provided. If the lower or upper boundary for the lowest and highest category, respectively, was not reported, we assumed that the boundary had the same amplitude as the closest category.20 Additionally, we first created restricted cubic splines with three knots at fixed percentiles (25%, 50%, and 75%) of the distribution.27 A p value for non-linearity was calculated by testing the null hypothesis that the coefficient of the fractional polynomials component is equal to zero. When data on total flavonoid intake included in this dose-response meta-analysis were not available, we used data from flavonols, flavones, flavanones, flavan-3-ols and isoflavones (in sequential order) as an equivalent to total flavonoid. Heterogeneity among studies was evaluated using the χ2 test based on Cochran's Q test and the I2 statistic at p<0.10 level of significance,24 which describes the percentage of variability in the effect estimates that is due to heterogeneity rather than chance.28 We regard I2<40% as ‘heterogeneity that might not be important’ and I2>75% as ‘considerable heterogeneity’ based on the suggestion of the Cochrane Handbook for Systemic Review of Interventions.29 All available data were utilised in the primary analysis. Subsequent subgroup analyses were conducted according to stroke outcomes (fatal/non-fatal vs ischaemic), follow-up duration (≤10 years vs >10 years), sex (male vs female vs combined), geographical area (USA vs Asia vs Europe), history of stroke (yes vs no) and study quality (high (score>8) vs low (score ≤8)). To explore possible explanations for heterogeneity and to test the robustness of the association, we conducted meta-regression, sensitivity analyses and the above-mentioned stratified analysis. The possibility of publication bias was evaluated using the Egger rank correlation test at p<0.10 level of significance and visual inspection of a funnel plot.30 31 In the case of publication bias, the ‘non-parametric trim-and-fill’ method was used to compute risk estimates corrected for this bias.32 All statistical analyses were performed in STATA V.12.0 (StataCorp, College Station, Texas, USA). p Values were two-sided and p<0.05 was considered statistically significant.
Results
Literature search
Figure 1 shows the results of literature search and selection. We initially identified 236 citations. After exclusion of duplicate records and studies that did not fulfil our inclusion criteria, 28 studies remained. We evaluated the full texts of these 28 publications and excluded 17 studies for the following reasons: no stroke outcomes (n=8), duplicate reports (n=4) and reviews (n=5). Eleven studies finally met the inclusion criteria and were included in the meta-analysis.8–18
Figure 1.
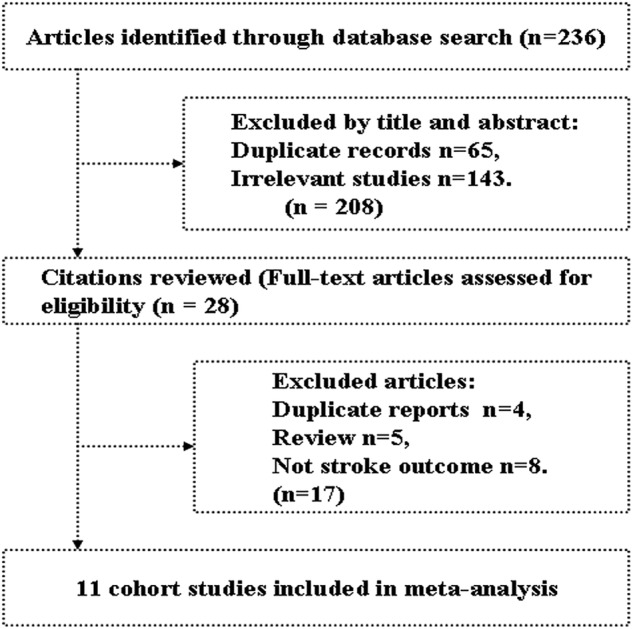
Literature search and study selection.
Study characteristics
The characteristics of the studies and of their participants are presented in table 1 and supplementary tables 1 and 2. Eleven studies involving 356 627 participants and more than 5154 stroke cases were included in the meta-analysis.8–18 Of these 11 studies, four conducted in the USA,11 14 16 17 one in an Asian country (Singapore)18 and six in European countries (Finland and the Netherlands).8–10 12 13 15 The number of participants ranged from 755 in the study by Marniemi et al12 to 98 469 in the study by McCullough et al.17 Four studies included both men and women,10 12 17 18 three studies included only men8 9 15 and four studies only women.11 13 14 16 The duration of follow-up ranged from 6.1 to 28 years,8 10 with a median of 14 years. The dietary assessment of flavonoid intake varied across studies: in most studies, intake of flavonoids was measured using food frequency questionnaires (FFQs) and dietary history interview. In most studies, stroke was assessed by medical records or death certificates based on ICD-8, ICD-9 or ICD-10.33–35 All studies provided adjusted risk estimates (eg, sex, body mass index, smoking, education), overall quality scores ranged from 7 to 9, and the median score was 8.
Table 1.
Characteristics of studies included in the meta-analysis
| First author, publication year | Country/population | No. of participants (% male) | Age range or mean (years) | Follow-up duration (years) | Assessment of dietary data | Stroke ascertainment | Type and no. of stroke cases | Pre-stroke excluded | Study quality |
|---|---|---|---|---|---|---|---|---|---|
| Hirvonen et al,8 2000 | Finland/European | 26 497 (100) | 50–69 | 6.1 | A self-administered, modified diet history method | Any type of stroke based on ICD-8 or ICD-9 codes | Ischaemic: 736 | Yes | 8 |
| Arts et al,9 2001 | The Netherlands/European | 806 (100) | 65–84 | 15 | A cross-checked dietary history method | Any type of stroke based on ICD-9 codes | Fatal: 47, Non-fatal: 88 | No | 7 |
| Knekt et al,10 2002 | Finland/European | 9131 (NA) | 30–69 | 28 | A dietary history interview | Any type of stroke based on ICD-8 codes | Fatal or non-fatal: 681 | No | 8 |
| Sesso et al,11 2003 | USA | 38 445 (0) | 53.9 | 6.9 | A food-frequency questionnaire | Any type of stroke based on clinical diagnosis | Fatal or non-fatal: NA | Yes | 9 |
| Marniemi et al,12 2005 | Finland/European | 755 (47.8) | 65–99 | 10 | A dietary history interview | Any type of stroke based on ICD-9 codes | Fatal: 45, Non-fatal: 25 | Yes | 8 |
| van der Schouw et al,13 2005 | The Netherlands/European | 16 165 (0) | 49–70 | 6.3 | A validated food-frequency questionnaire | Any type of stroke based on ICD-9 codes | Fatal or non-fatal: 147 | Yes | 9 |
| Mink et al,14 2007 | USA | 34 489 (0) | 55–69 | 16 | A food-frequency questionnaire | Any type of stroke based on ICD-9 codes | Fatal: 469 | Yes | 9 |
| Mursu et al,15 2008 | Finland/European | 1950 (100) | 42–60 | 15.2 | An instructed 4-day food recording by household measures | Any type of stroke based on ICD-9 or ICD-10 codes | Ischaemic: 102 | Yes | 9 |
| Cassidy et al,16 2012 | USA | 69 622 (0) | 30–55 | 14 | A semiquantitative food-frequency questionnaire interview | Any type of stroke based on medical records, autopsy reports and death certificates | Ischaemic: 943 | Yes | 8 |
| McCullough et al,17 2012 | USA | 98 469 (38.8) | 70 | 7 | A semiquantitative food-frequency questionnaire interview | Any type of stroke based on ICD-9 or ICD-10 codes | Fatal: 573 | Yes | 9 |
| Talaei et al,18 2014 | Singapore/Asian | 60 298 (44.5) | 45–74 | 14.7 | A semiquantitative food-frequency questionnaire interview | Any type of stroke based on ICD-9 codes | Fatal: 1298 | No | 8 |
ICD, International Classification of Diseases; NA, not available.
bmjopen-2015-008680supp_tables.pdf (99.8KB, pdf)
Flavonoid intake and stroke risk
The multivariable adjusted RRs of fatal or non-fatal stroke in relation to dietary flavonoid intake from individual studies and the combined RR are presented in figure 2. Only one of the 11 studies showed that flavonoid intake was significantly associated with decreased risk of stroke.10 Overall, participants with the highest dietary flavonoid intake experienced a significantly decreased risk for stroke compared with the lowest (combined RR 0.89, 95% CI 0.82 to 0.97; figure 2) after adjustment for other risk factors. We saw no heterogeneity among studies (p=0.774, I2=0%). Three of the 11 studies were eligible for the dose-response analysis of flavonoid intake and risk of stroke.9 14 16 Using a restricted cubic splines model, dose-response analysis found a statistically non-significant inverse association with risk of stroke per 100 mg/day increment in flavonoid intake (RR 0.91, 95% CI 0.77 to 1.08; I2=0%, p=0.285; figures 3 and 4). No heterogeneity was observed (p=0.974).
Figure 2.

Random-effects analysis of fully adjusted studies for the highest versus lowest intake of flavonoids and risk of stroke.
Figure 3.
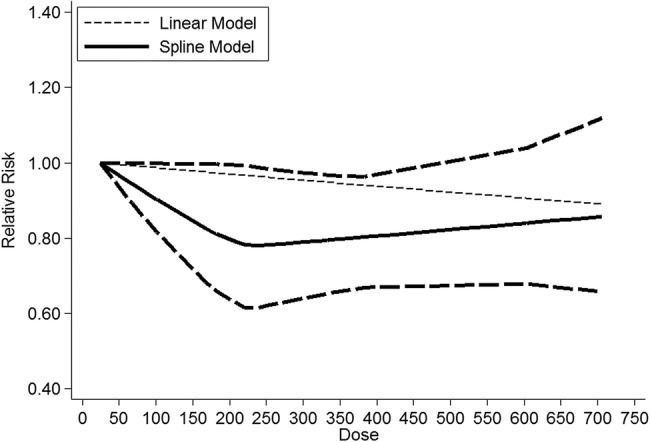
Dose-response relationship between dietary flavonoid intake and stroke risk. The solid line represents point estimates of the association between flavonoid intake and stroke risk, and the dotted lines are 95% CIs. The horizontal line is the reference line.
Figure 4.

Forest plot of flavonoid intake and risk of stroke. Three cohort studies were eligible for the dose-response analysis of flavonoid intake and risk of stroke. Relative risk <1.0 favours exposure to greater intake of flavonoid.
Stratifying analysis
In most subgroups, dietary flavonoid intake was not associated with stroke. Stratifying by sex, the associations between dietary flavonoid intake and risk of stroke were similar between males and females (table 2). The pooled RRs of stroke were 0.86 (95% CI 0.76 to 0.98) in studies conducted in the USA, 0.88 (95% CI 0.77 to 1.00) in studies conducted in Europe, and 0.97 (95% CI 0.81 to 1.16) in studies conducted in Asia (table 2). Stratifying by duration, we observed a protective effect of dietary flavonoid intake in studies with more than 10 years of follow-up. The associations were more evident in some strata of study characteristics (table 2).
Table 2.
Stratified analyses of flavonoid intake and stroke risk
| Heterogeneity test |
||||||
|---|---|---|---|---|---|---|
| Group | No. of studies | RR (95% CI) | χ2 | p Value | I2, % | p Value of pooled effect |
| Overall studies | ||||||
| Fatal/non-fatal stroke | 11 | 0.89 (0.82 to 0.97) | 6.48 | 0.774 | 0 | 0.006 |
| Ischaemic stroke | 3 | 0.93 (0.80 to 1.07) | 1.03 | 0.609 | 0 | 0.301 |
| Geographical area | ||||||
| USA | 4 | 0.86 (0.76 to 0.98) | 1.50 | 0.683 | 0 | 0.026 |
| Asia | 1 | 0.97 (0.81 to 1.16) | 0 | – | – | 0.740 |
| Europe | 6 | 0.88 (0.77 to 1.00) | 3.81 | 0.577 | 0 | 0.051 |
| History of stroke | ||||||
| Yes | 3 | 0.89 (0.78 to 1.02) | 2.10 | 0.351 | 4.6 | 0.105 |
| No | 8 | 0.89 (0.80 to 0.99) | 4.38 | 0.735 | 0 | 0.027 |
| Sex | ||||||
| Male | 4 | 0.82 (0.64 to 1.06) | 4.90 | 0.179 | 38.8 | 0.130 |
| Female | 5 | 0.92 (0.80 to 1.05) | 2.39 | 0.664 | 0 | 0.216 |
| Combined | 3 | 0.86 (0.72 to 1.04) | 2.97 | 0.227 | 32.6 | 0.114 |
| Mean follow-up, years | ||||||
| ≤10 | 5 | 0.88 (0.77 to 1.01) | 3.78 | 0.437 | 0 | 0.067 |
| >10 | 6 | 0.89 (0.81 to 0.99) | 2.68 | 0.750 | 0 | 0.036 |
| Quality score | ||||||
| High, score >8 | 5 | 0.85 (0.73 to 0.99) | 2.26 | 0.688 | 0 | 0.038 |
| Low, score ≤8 | 6 | 0.91 (0.82 to 1.00) | 3.73 | 0.589 | 0 | 0.048 |
RR, relative risk.
Sensitivity analysis and publication bias
We tested the robustness of our results in sensitivity analysis, where a single study included in the meta-analysis was deleted at a time; the results of the meta-analysis remained largely unchanged, indicating that the results of the meta-analysis were stable (data not shown). Visual inspection of the funnel plot identified asymmetry (see online supplementary figure S1). The Egger test demonstrated no statistical evidence of publication bias among studies for stroke risk (p=0.238).
Egger funnel plot for detection of publication bias for stroke risk.
bmjopen-2015-008680supp_figure.pdf (107.8KB, pdf)
Meta regression
In this meta-analysis, although no heterogeneity was observed among individual studies, a multivariate regression was conducted to explore the potential sources of heterogeneity under stroke. The results of regression suggested that stroke outcomes, follow-up duration, sex, geographical area, history of stroke and study quality were not significant sources of heterogeneity.
Discussion
Our meta-analysis of 11 prospective studies indicates that dietary flavonoid intake may be inversely associated with risk of stroke. In addition, dose-response analysis indicated that a 100 mg/day increment in flavonoid intake was associated with a 9% lower risk of stroke (RR 0.91, 95% CI 0.77 to 1.08). However, this association was not statistically significant.
Potential benefits of flavonoids
Flavonoids, a large class of polyphenols, are widely distributed in plants and are present in considerable amounts in fruits, vegetables, tea and red wine. These bioactive polyphenols are non-energy, non-nutrient secondary metabolites present in plants and cannot be synthesised by humans.36 In recent decades, overwhelming evidence has indicated that flavonoid intake is associated with well-known risk-factors for CVD. There is also some evidence that flavonoids may have a role in preventing the development of CVD (eg, coronary heart disease, stroke).37 38 In addition, although there are many putative biological mechanisms underlying a possible cardioprotective role for flavonoids,39 including anti-inflammatory40 and antioxidant effects,6 recovery of endothelial function by some compounds41 and reductions in platelet aggregation,42 and the effect of individual compounds or interactions between flavonoids is still largely unknown, flavonol and isoflavone intake may explain some of this beneficial effect.19 43
Although the exact mechanism by which flavonoid intake may protect against the development of stroke is still ambiguous, a possible mechanism is the regulation of blood pressure, especially by anthocyanins, due to an increase in endothelial-derived nitric oxide (NO).44 Moreover, mainly attributed to antioxidant mechanisms, flavonoids reduced mitochondrial lipid peroxidation and loss of mitochondrial transmembrane electric potential caused by oxidative stress induced by ADP plus iron.45 A third mechanism is the protective action of flavonoids on the anti-inflammatory responses in the brain, which may be attributable to lipid raft disruption and antioxidant effects.46 Because the flavonoids are very diverse regarding their bioavailability and bioactivity, the rationale for assuming that intakes of all flavonoid classes might have effects on stroke needs more consideration.
Results in relation to other studies
Over the past decades, despite extensive studies that investigated the role of flavonoid intake on cardiovascular disease or cerebrovascular disease, it remains unclear whether the association between flavonoid intake and risk of stroke is causal. One study suggested that individuals with higher flavonoid intake had a lower risk of stroke,10 although others failed to find an association.8 9 More, importantly, the possibility of reverse causality should be addressed. A previous meta-analysis of flavonol intake and risk of stroke showed that flavonol intake was inversely associated with stroke incidence.38 That meta-analysis included six prospective cohort studies from three different countries: four of the studies were conducted in Europe (three in Finland and one in The Netherlands) and two in the USA. Inverse associations between flavonol intake and stroke were observed in two prospective cohort studies (the Zutphen Elderly Study and Kuopio Study) and significant inverse associations were found in the Finnish Mobile Clinic Study and Women's Health Study, which result was consistent with a detailed review by Wang et al.5 Conversely, no associations were noted in the Iowa Women's Health Study and the Alpha-Tocopherol, Beta-Carotene Cancer Prevention Study. The results for flavonols were consistent with our findings for flavonoids. However, the data from studies included in the previous meta-analysis were limited to articles published before August 2009.38 Since then, three new studies on the relationship between flavonoid intake and risk of stroke have been published.16–18 To obtain a more comprehensive estimate of the putative influence of flavonoids on stroke, we conducted a meta-analysis of prospective cohort studies. To our knowledge, this meta-analysis is the largest to reveal a potential relationship between dietary flavonoid intake and risk of stroke. However, most studies assess dietary flavonoid intake based on self-reported questionnaires using FFQs, and medical records were not always available for stroke classification. Consequently, misclassification of flavonoid intake or stroke was inevitable and may have biased true associations among individual studies.
Strengths and limitations
This study has several important strengths compared with previous meta-analyses.19 38 The present meta-analysis included twice as many participants and twice as many stroke cases. To our knowledge, this is the largest meta-analysis to date on flavonoid intake and risk of stroke. We also explored possible sources of heterogeneity using subgroup analyses and the meta-regression method, none of which were significant. Moreover, the presence of a dose-response relationship further strengthened the association of dietary flavonoid intake with risk of stroke. The results should be reliable.
In interpreting the results, some limitations of this meta-analysis should be acknowledged. First, one limitation of any meta-analysis of observational studies is that residual confounding or confounding by unmeasured factors (such as intake of other nutrients) may have affected the strength of the association between flavonoid intake and stroke risk. Additionally, none of the studies used in this dose-response analysis included complete data on total flavonoid intake; the flavonoid intake may have been underestimated in the original studies. Thus, these findings should be treated with caution. Second, we cannot exclude the possibility of recall bias in dietary assessment based on the FFQs. However, the prospective study design and exclusion of participants with chronic diseases at baseline should minimise such bias. Third, a noticeable limitation of our study was the potential for bias due to inevitable measurement error and misclassification, especially for individuals with lower consumption levels. We attempted to reduce measurement error by adjusting for energy or fibre intake and using cumulatively averaged intake levels. Fourth, we tried to study the main sources of flavonoids but failed due to insufficient data. Different flavonoid subclasses were used in the primary studies included in this meta-analysis. Among the 11 studies, four included the same subclasses (including quercetin, kaempferol, myricetin, luteolin and apigenin),8 9 11 12 another five studies included similar subclasses (including flavonols, flavones, flavanones, flavan-3-ols, and so on),10 14–17 and three studies included isoflavones,13 17 18 as summarised in supplementary table 2. Among the 11 studies, only three were eligible for dose-response analysis. In addition, the flavonoid subclasses differed among the 11 studies: two studies included flavanones, three included flavones, three included flavonols, two included flavan-3-ols, and one included isoflavones. Due to the limited number of studies suitable for dose-response analyses and the insufficient statistical power, we did not conduct dose-response analysis separately on each class. Thus, we evaluated the effects of total flavonoid intake on stroke risk rather than the wide range of flavonoid subclasses. On the one hand, in order to balance the risk of a type I error (the true effect is zero but we reject the null) and a type II error (the true effect is not zero but we fail to reject the null), we combined these estimates using a random-effects model, which takes into account both within-study and between-study variabilities.24 Thus, these results should be treated with caution. Finally, a possible limitation is due to language bias. We attempted to minimise this bias by searching major electronic databases with no language restriction. However, articles in non-English publications or unpublished reports might not appear in international journal databases and may have been missed in our searches.47
Conclusions
In summary, results from this meta-analysis suggest that higher dietary flavonoid intake may moderately lower the risk of stroke after adjustment for established cardiovascular risk factors. Randomised controlled studies are needed to evaluate the effects of flavonoid intake on stroke risk.
Footnotes
Contributors: ML and ZT conceived and designed the study. ML and WH searched the databases and checked studies according to the eligibility and exclusion criteria. ZT helped develop search strategies. XZ and WH extracted quantitative data. XZ and WH analysed the data. ML wrote the draft of the paper. All authors contributed to writing, reviewing or revising the paper. ZT is the guarantor.
Competing interests: None declared.
Provenance and peer review: Not commissioned; externally peer reviewed.
Data sharing statement: No additional data are available.
References
- 1.Feigin VL, Forouzanfar MH, Krishnamurthi R et al. Global and regional burden of stroke during 1990–2010: findings from the Global Burden of Disease Study 2010. Lancet 2014;383:245–54. 10.1016/S0140-6736(13)61953-4 [DOI] [PMC free article] [PubMed] [Google Scholar]
- 2.Mozaffarian D, Benjamin EJ, Go AS et al. Heart Disease and Stroke Statistics-2016 Update: A Report From the American Heart Association. Circulation 2016;133:e38–360. 10.1161/CIR.0000000000000350 [DOI] [PubMed] [Google Scholar]
- 3.Kar P, Laight D, Shaw KM et al. Flavonoid-rich grapeseed extracts: a new approach in high cardiovascular risk patients? Int J Clin Pract 2006;60:1484–92. 10.1111/j.1742-1241.2006.01038.x [DOI] [PubMed] [Google Scholar]
- 4.Huntley AL. The health benefits of berry flavonoids for menopausal women: cardiovascular disease, cancer and cognition. Maturitas 2009;63:297–301. 10.1016/j.maturitas.2009.05.005 [DOI] [PubMed] [Google Scholar]
- 5.Wang X, Ouyang YY, Liu J et al. Flavonoid intake and risk of CVD: a systematic review and meta-analysis of prospective cohort studies. Br J Nutr 2014;111:1–11. 10.1017/S000711451300278X [DOI] [PubMed] [Google Scholar]
- 6.Frei B, Higdon JV. Antioxidant activity of tea polyphenols in vivo: evidence from animal studies. J Nutr 2003;133:3275S–84S. [DOI] [PubMed] [Google Scholar]
- 7.Sheng R, Gu ZL, Xie ML et al. EGCG inhibits proliferation of cardiac fibroblasts in rats with cardiac hypertrophy. Planta Med 2009;75:113–20. 10.1055/s-0028-1088387 [DOI] [PubMed] [Google Scholar]
- 8.Hirvonen T, Virtamo J, Korhonen P et al. Intake of flavonoids, carotenoids, vitamins C and E, and risk of stroke in male smokers. Stroke 2000;31:2301–6. 10.1161/01.STR.31.10.2301 [DOI] [PubMed] [Google Scholar]
- 9.Arts IC, Hollman PC, Feskens EJ et al. Catechin intake might explain the inverse relation between tea consumption and ischemic heart disease: the Zutphen Elderly Study. Am J Clin Nutr 2001;74:227–32. [DOI] [PubMed] [Google Scholar]
- 10.Knekt P, Kumpulainen J, Järvinen R et al. Flavonoid intake and risk of chronic diseases. Am J Clin Nutr 2002;76:560–8. [DOI] [PubMed] [Google Scholar]
- 11.Sesso HD, Gaziano JM, Liu S et al. Flavonoid intake and the risk of cardiovascular disease in women. Am J Clin Nutr 2003;77:1400–8. [DOI] [PubMed] [Google Scholar]
- 12.Marniemi J, Alanen E, Impivaara O et al. Dietary and serum vitamins and minerals as predictors of myocardial infarction and stroke in elderly subjects. Nutr Metab Cardiovasc Dis 2005;15:188–97. 10.1016/j.numecd.2005.01.001 [DOI] [PubMed] [Google Scholar]
- 13.van der Schouw YT, Kreijkamp-Kaspers S, Peeters PH et al. Prospective study on usual dietary phytoestrogen intake and cardiovascular disease risk in Western women. Circulation 2005;111:465–71. 10.1161/01.CIR.0000153814.87631.B0 [DOI] [PubMed] [Google Scholar]
- 14.Mink PJ, Scrafford CG, Barraj LM et al. Flavonoid intake and cardiovascular disease mortality: a prospective study in postmenopausal women. Am J Clin Nutr 2007;85:895–909. [DOI] [PubMed] [Google Scholar]
- 15.Mursu J, Voutilainen S, Nurmi T et al. Flavonoid intake and the risk of ischaemic stroke and CVD mortality in middle-aged Finnish men: the Kuopio Ischaemic Heart Disease Risk Factor Study. Br J Nutr 2008;100:890–5. 10.1017/S0007114508945694 [DOI] [PubMed] [Google Scholar]
- 16.Cassidy A, Rimm EB, O'Reilly EJ et al. Dietary flavonoids and risk of stroke in women. Stroke 2012;43:946–51. 10.1161/STROKEAHA.111.637835 [DOI] [PMC free article] [PubMed] [Google Scholar]
- 17.McCullough ML, Peterson JJ, Patel R et al. Flavonoid intake and cardiovascular disease mortality in a prospective cohort of US adults. Am J Clin Nutr 2012;95:454–64. 10.3945/ajcn.111.016634 [DOI] [PMC free article] [PubMed] [Google Scholar]
- 18.Talaei M, Koh WP, van Dam RM et al. Dietary soy intake is not associated with risk of cardiovascular disease mortality in Singapore Chinese adults. J Nutr 2014;144:921–8. 10.3945/jn.114.190454 [DOI] [PMC free article] [PubMed] [Google Scholar]
- 19.Wang ZM, Zhao D, Nie ZL et al. Flavonol intake and stroke risk: a meta-analysis of cohort studies. Nutrition 2014;30:518–23. 10.1016/j.nut.2013.10.009 [DOI] [PubMed] [Google Scholar]
- 20.Peterson JJ, Dwyer JT, Jacques PF et al. Associations between flavonoids and cardiovascular disease incidence or mortality in European and US populations. Nutr Rev 2012;70:491–508. 10.1111/j.1753-4887.2012.00508.x [DOI] [PMC free article] [PubMed] [Google Scholar]
- 21.Stroup DF, Berlin JA, Morton SC et al. Meta-analysis of observational studies in epidemiology: a proposal for reporting. Meta-analysis Of Observational Studies in Epidemiology (MOOSE) group. JAMA 2000;283:2008–12. [DOI] [PubMed] [Google Scholar]
- 22.Stang A. Critical evaluation of the Newcastle-Ottawa scale for the assessment of the quality of nonrandomized studies in meta-analyses. Eur J Epidemiol 2010;25:603–5. 10.1007/s10654-010-9491-z [DOI] [PubMed] [Google Scholar]
- 23.Pan A, Sun Q, Okereke OI et al. Depression and risk of stroke morbidity and mortality: a meta-analysis and systematic review. JAMA 2011;306:1241–9. 10.1001/jama.2011.1282 [DOI] [PMC free article] [PubMed] [Google Scholar]
- 24.DerSimonian R, Laird N. Meta-analysis in clinical trials. Control Clin Trials 1986;7:177–88. 10.1016/0197-2456(86)90046-2 [DOI] [PubMed] [Google Scholar]
- 25.Greenland S, Longnecker MP. Methods for trend estimation from summarized dose-response data, with applications to meta-analysis. Am J Epidemiol 1992;135:1301–9. [DOI] [PubMed] [Google Scholar]
- 26.Orsini N, Li R, Wolk A et al. Meta-analysis for linear and nonlinear dose-response relations: examples, an evaluation of approximations, and software. Am J Epidemiol 2012;175:66–73. 10.1093/aje/kwr265 [DOI] [PMC free article] [PubMed] [Google Scholar]
- 27.Harrell FE Jr, Lee KL, Pollock BG. Regression models in clinical studies: determining relationships between predictors and response. J Natl Cancer Inst 1988;80:1198–202. 10.1093/jnci/80.15.1198 [DOI] [PubMed] [Google Scholar]
- 28.Higgins JP, Thompson SG, Deeks JJ et al. Measuring inconsistency in meta-analyses. BMJ 2003;327:557–60. 10.1136/bmj.327.7414.557 [DOI] [PMC free article] [PubMed] [Google Scholar]
- 29.Higgins JPT, Green S. Cochrane Handbook for Systematic Reviews of Interventions. Oxford, UK: The Cochrane Collaboration, 2011:261–6. [Google Scholar]
- 30.Begg CB, Mazumdar M. Operating characteristics of a rank correlation test for publication bias. Biometrics 1994;50:1088–101. 10.2307/2533446 [DOI] [PubMed] [Google Scholar]
- 31.Sterne JA, Egger M. Funnel plots for detecting bias in meta-analysis: guidelines on choice of axis. J Clin Epidemiol 2001;54:1046–55. 10.1016/S0895-4356(01)00377-8 [DOI] [PubMed] [Google Scholar]
- 32.Duval S, Tweedie R. Trim and fill: a simple funnel-plot-based method of testing and adjusting for publication bias in meta-analysis. Biometrics 2000;56:455–63. 10.1111/j.0006-341X.2000.00455.x [DOI] [PubMed] [Google Scholar]
- 33.Moriyama IM. The Eighth Revision of the International Classification of Diseases. Am J Public Health Nations Health 1966;56:1277–80. 10.2105/AJPH.56.8.1277 [DOI] [PMC free article] [PubMed] [Google Scholar]
- 34.Kupka K. International Classification of Diseases: Ninth Revision. WHO Chron 1978;32:219–25. [PubMed] [Google Scholar]
- 35.Bramer GR. International statistical classification of diseases and related health problems. Tenth revision. World Health Stat Q 1988;41:32–6. [PubMed] [Google Scholar]
- 36.Goya L, Martin MÁ, Sarriá B et al. Effect of cocoa and its flavonoids on biomarkers of inflammation: studies of cell culture, animals and humans. Nutrients 2016;8:pii: E212 10.3390/nu8040212 [DOI] [PMC free article] [PubMed] [Google Scholar]
- 37.Huxley RR, Neil HA. The relation between dietary flavonol intake and coronary heart disease mortality: a meta-analysis of prospective cohort studies. Eur J Clin Nutr 2003;57:904–8. 10.1038/sj.ejcn.1601624 [DOI] [PubMed] [Google Scholar]
- 38.Hollman PC, Geelen A, Kromhout D. Dietary flavonol intake may lower stroke risk in men and women. J Nutr 2010;140:600–4. 10.3945/jn.109.116632 [DOI] [PubMed] [Google Scholar]
- 39.Geleijnse JM, Hollman PCh. Flavonoids and cardiovascular health: which compounds, what mechanisms. Am J Clin Nutr 2008;88:12–13. [DOI] [PubMed] [Google Scholar]
- 40.Landberg R, Sun Q, Rimm EB et al. Selected dietary flavonoids are associated with markers of inflammation and endothelial dysfunction in US women. J Nutr 2011;141:618–25. 10.3945/jn.110.133843 [DOI] [PMC free article] [PubMed] [Google Scholar]
- 41.Boesten DM, von Ungern-Sternberg SN, den Hartog GJ et al. Protective pleiotropic effect of flavonoids on NAD+ levels in endothelial cells exposed to high glucose. Oxid Med Cell Longev 2015;2015:894597 10.1155/2015/894597 [DOI] [PMC free article] [PubMed] [Google Scholar]
- 42.Murphy KJ, Chronopoulos AK, Singh I et al. Dietary flavanols and procyanidin oligomers from cocoa (Theobroma cacao) inhibit platelet function. Am J Clin Nutr 2003;77:1466–73. [DOI] [PubMed] [Google Scholar]
- 43.Sagara M, Kanda T, NJelekera M et al. Effects of dietary intake of soy protein and isoflavones on cardiovascular disease risk factors in high risk, middle-aged men in Scotland. J Am Coll Nutr 2004;23:85–91. 10.1080/07315724.2004.10719347 [DOI] [PubMed] [Google Scholar]
- 44.Steffen Y, Gruber C, Schewe T et al. Mono-O-methylated flavanols and other flavonoids as inhibitors of endothelial NADPH oxidase. Arch Biochem Biophys 2008;469:209–19. 10.1016/j.abb.2007.10.012 [DOI] [PubMed] [Google Scholar]
- 45.Silva B, Oliveira PJ, Dias A et al. Quercetin, kaempferol and biapigenin from Hypericum perforatum are neuroprotective against excitotoxic insults. Neurotox Res 2008;13:265–79. 10.1007/BF03033510 [DOI] [PubMed] [Google Scholar]
- 46.Perez-Vizcaino F, Duarte J. Flavonols and cardiovascular disease. Mol Aspects Med 2010;31:478–94. 10.1016/j.mam.2010.09.002 [DOI] [PubMed] [Google Scholar]
- 47.Li M, Hou W, Zhang X et al. Hyperuricemia and risk of stroke: a systematic review and meta-analysis of prospective studies. Atherosclerosis 2014;232:265–70. 10.1016/j.atherosclerosis.2013.11.051 [DOI] [PubMed] [Google Scholar]
Associated Data
This section collects any data citations, data availability statements, or supplementary materials included in this article.
Supplementary Materials
bmjopen-2015-008680supp.pdf (127.7KB, pdf)
bmjopen-2015-008680supp_tables.pdf (99.8KB, pdf)
Egger funnel plot for detection of publication bias for stroke risk.
bmjopen-2015-008680supp_figure.pdf (107.8KB, pdf)