

ABSTRACT
Objective:
The purpose of this study was to evaluate an improved oriented speckle reducing anisotropic diffusion (IADF) filter that suppress the speckle noise from ultrasound B-mode images and shows better result than previous filters such as anisotropic diffusion, wavelet denoising and local statistics.
Methods:
The clinical ultrasound images of the cervix were obtained by ATL HDI 5000 ultrasound machine from the Regional Cancer Centre, Medical College campus, Thiruvananthapuram. The standardized ways of organizing and storing the image were in the format of bmp and the dimensions of 256 × 256 with the help of an improved oriented speckle reducing anisotropic diffusion filter. For analysis, 24 ultrasound cervix images were tested and the performance measured.
Results:
This provides quality metrics in the case of maximum peak signal-to-noise ratio (PSNR) of 31 dB, structural similarity index map (SSIM) of 0.88 and edge preservation accuracy of 88%.
Conclusion:
The IADF filter is the optimal method and it is capable of strong speckle suppression with less computational complexity.
Keywords: Anisotropic diffusion filter, denoising, speckle noise, ultrasound image
RESUMEN
Objetivo:
El propósito de este estudio fue evaluar un filtro de difusión anisotrópica mejorado para la reducción del speckle (DARS) orientado. El filtro elimina el speckle (moteado o ruido granular) de las imágenes ecográficas en modo B, y muestra mejores resultados que los filtros previos, tales como la difusión anisotrópica, la transformada de ondeletas (wavelets) y las estadísticas locales.
Métodos:
Las imágenes de ecografía clínica del cuello uterino fueron obtenidas mediante el equipo de ultrasonido ATL HDI 5000 del Centro Regional de Cáncer, Universidad Médica, Thiruvananthapuram. Las formas estándares de organizar y almacenar la imagen fueron el formato bmp y las dimensiones de 256 × 256 con la ayuda de un filtro de difusión anisotrópica mejorado para la reducción del speckle orientado. Para el análisis, se sometieron a prueba 24 imágenes de ultrasonido del cuello uterino, y se midieron los resultados.
Resultados:
Esto proporciona métricas de calidad en el caso de una relación señal a ruido de pico (RSRP) máxima de 31 dB, un mapa de índice de similitud estructural (SSIM) de 0.88, y una precisión de la preservación del borde de 88%.
Conclusión:
El filtro DARS constituye el método óptimo, y es capaz de suprimir un fuerte ruido speckle con menos complejidad computacional.
INTRODUCTION
Cervical cancer is the second most common type of cancer among women, with more than 250 000 deaths every year (1). The mortality rate of cervical cancer in India is more than the mortality rate of child birth [0.8 per cent vs 0.6 per cent] (2). Moreover, it is estimated that 70 to 80% of the total female population in India is found to be affected by cervical cancer (3, 4). In South India, it is expected that the death rate will increase further and it is believed that carcinoma of the uterine cervix is the major cause (5). Cervical cancer can be cured, if detected in the early stages. In India, magnetic resonance imaging (MRI) scan is preferred for identification of cervical cancer, however, the cost of the system is high; hence, identification through ultrasound can reduce the cost. But ultrasound images are highly affected by artefacts. So by introducing improved anisotropic diffusion filter denoising approach, the quality of the image can be improved.
Denoising of an image is a vital image processing task, both as a method itself, and as a part in other processes (5). There are many ways to denoise an image. The major property of an image denoising model is that it will remove noise, preserve edges and enhance maximum peak signal to noise ratio (PSNR).
In the presently offered medical imaging modalities, ultrasound imaging is considered non-invasive, practically harmless to the human body, portable, accurate and cost effective (6). These characteristics have made the ultrasound imaging the foremost prevalent diagnostic tool in nearly all hospitals around the world. Therefore, in the past few decades, considerable efforts in the field of ultrasound imaging are directed at development of signal processing techniques (7).
Ultrasound images are mainly corrupted through intrinsic artefact called “speckle” (7), which is the outcome of the constructive and destructive coherent abstraction of ultrasound resonances. These resonances or echoes can be due to device malfunctions or because of an inexperienced radiologist.
The evaluation of post-processing speckle reducing technique (8) employs the most common techniques of anisotropic diffusion (9), wavelet denoising and local statistics (10). Other approaches are proposed, together with the non-local means method. Generally, the anisotropic diffusion (11) [particularly oriented speckle reducing anisotropic diffusion – OSRAD], nonlinear multi-wavelet diffusion (NMWD) filter and other wavelet-based methods are not sufficient for a speckle removal. In the existing device, the OSRAD filter is considered the appropriate method for clinical application, based on consideration of its performance on both simulated and clinical data, and additional evaluation of its computational necessities (12). However, the OSRAD filter shows poor visual quality of images with low structural similarities.
In this paper, an improved anisotropic diffusion filter (IADF) was designed to exhibit strong speckle suppression by changing the eigenvalues, and the performance of the improved filter is evaluated. The IADF is an iterative process, everywhere kernel information is processed and regular update is carried out at the kernel set. This technique can also be accurately deployed for a large number of cases.
METHODS
The multiplicative Lee filter approximates with a linear model to get the signal estimate, and the weighting function is described previously (10). The filter projected by Kuan et al comes by transforming into a signal-dependent additive noise formulation rather than the linear approximation utilized in the Lee filter (7). An equivalent general form of the Lee filter is used, but with a weighting function described by Kuan et al (7) and it effectively controls the amount of smoothing applied to the image by the filter (13). Frost et al estimated the noisefree image by convolving the observed image with a spatiallyvarying kernel, as cited by Kuan et al (7). Yu and Acton developed a diffusion approach better suited to speckle noise removal. The diffusion partial differential equations (PDE) is employed, the variation coefficient utilized in synthetic aperture radar (SAR) filtering strategies as a signal/edge discriminator for filtering processes where the ratio of local standard deviation to mean is given (14). Detail preserving anisotropic diffusion (DPAD) filter is proposed that improves upon the operation of the SRAD filter (12).
Weickert introduced a coherence enhancing diffusion (CED) tensor-valued diffusion function, permitting the level of smoothing to vary directionally (15). The nonlinear coherent diffusion (NCD) technique of Abd-Elmoniem et al tries to discriminate between different levels of speckle, based on the similarity to completely developed speckle. Image regions closely resembling totally developed speckle are mean filtered, while those dissimilar remain unchanged (11). As with the CED technique, this approach utilizes a tensor-valued diffusion function (16), calculated as a component-wise convolution of a Gaussian kernel with the structure tensor (11). Here, the initial stage of smoothing performed is not employed; therefore, the structure matrix represents gradient information from image details of even the smallest size.
Oriented speckle reducing anisotropic diffusion
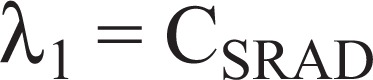
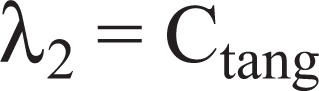
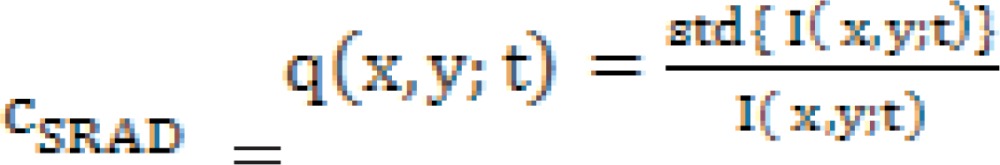
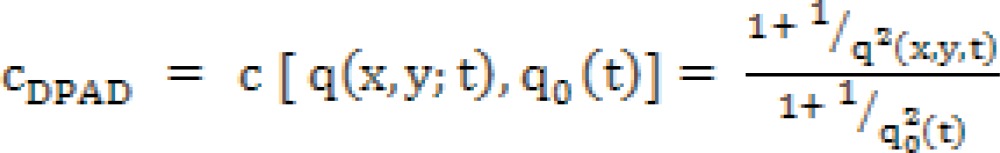
Krissian et al extended the SRAD technique to a matrix diffusion scheme (16). This permits the speckle adaptive diffusion to vary in strength within the contour and curvature directions. The enhancements of the DPAD method are utilized in this filter, like the employment of a larger window to estimate q(x,y;t) and the median estimation of q0(t). The OSRAD diffusion function c (q) relies on the Kuan et al filter (7).
The local directional variance is interrelated to the local geometry of the image. The extension of the SRAD technique to a matrix scheme is performed by finding the local directions of the gradient and curvature. This could be performed utilizing the Hessian matrix, as here, the structure tensor Tp is employed, like the CED and NCD methods. As in the CED technique, the eigenvectors of Tp are accustomed to construct the diffusion matrix, D. The eigenvalues of D, defining the strength of diffusion within the gradient and curvature directions, are given as
 |
[1] |
 |
[2] |
Where λ1 gradient direction, λ2 curvature direction, CSRAD is the SRAD diffusion [c (q)] and Ctang is a constant. Diffusion is then performed.
Improved oriented speckle reducing anisotropic diffusion
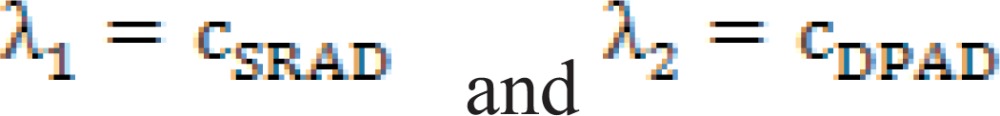
Krissian et al extended the SRAD method to a matrix diffusion scheme (16). This permits the speckle adaptive diffusion to differ in power in the contour and curvature directions. The improvements of the DPAD technique are used in this filter, such as the usage of a larger window to evaluate q(x,y;t) and the median approximation of q0(t). The OSRAD diffusion function c (q) is based on the Kuan et al filter (7).
The local directional variance is related to the local geometry of the image. The extension of the SRAD technique to a matrix scheme is achieved by finding the local directions of gradient and curvature. This can be performed using the Hessian matrix, but here, the structure tensor is used, similar to the CED and NCD methods. As in the CED method, the eigenvectors of Tp are used to construct the diffusion matrix, D. The eigenvalues of D, describing the strength of diffusion in the gradient and curvature directions, are specified as (18):
 |
[3] |
where
 |
[4] |
 |
[5] |
Diffusion steps
Improved anisotropic diffusion filter scheme the separate set image gradient (RxI, RyI, LxI, LyI) and apply eigenvalues to improve the performance of the similarity index and the edge preservation accuracy.
- Calculate the image gradient (RxI, RyI, LxI, LyI)
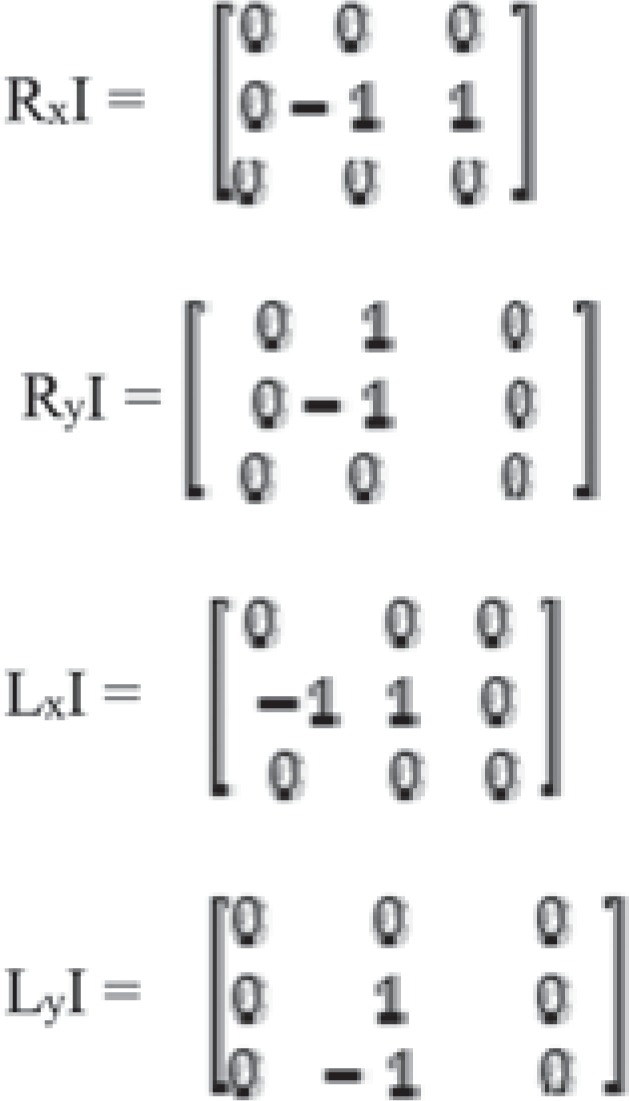
Make the kernel window co-ordinates (X,Y)
Build the Gaussian second derivatives filters (Dxx, Dyy, Dxy) DGaussyy = DGaussxx
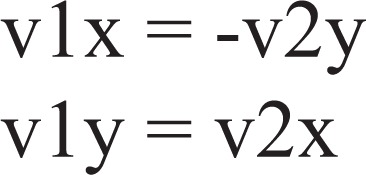
Compute the eigenvectors (Vx, Vy)
- Normalize the values and check whether eigenvectors are orthogonal
-
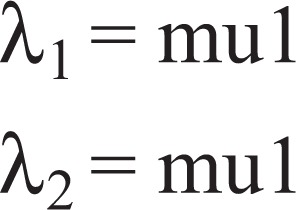
Compute the eigenvalues (mu1, mu2)
Sort eigenvalues by absolute value abs(λ1) < abs(λ2)
Check abs(mu1) < abs(mu2)
Replace the value of OSRAD filter λ1 and λ2 with λ1 =cSRAD and λ2 =cDPAD mentioned as part of the proposed system
Update the kernel information based on the Gaussian second order derivatives and λ1 and λ2
Reconstruct the image using the updated kernel information from step 10
Display the reconstructed image as denoised results
In the existing approach, λ2 =ctang is a constant, but in the proposed approach, eigenvalues are taken as the extension of DPAD. To measure the variation caused by filtering, the difference between the filtered and reference value is used. This is normalized relative to the value in the reference image.
Filter performance evaluation
The effects of filtering are calculated by application of image quality metrics. Image performance metrics are applied to the ultrasound images. The performance of each filter is evaluated quantitatively for ultrasound image with speckle noise using quality metrics such as maximum peak signal-to-noise ratio (PSNR), structural similarity index (SSIM) and figure of merit (FoM).
i) Peak signal-to-noise ratio
The PSNR indicates the level of chosen signal to the level of background noise and is computed using
 |
[6] |
where MSE is defined as mean square error and  is the maximum intensity in the unfiltered images (18). The larger PSNR values show good quality image.
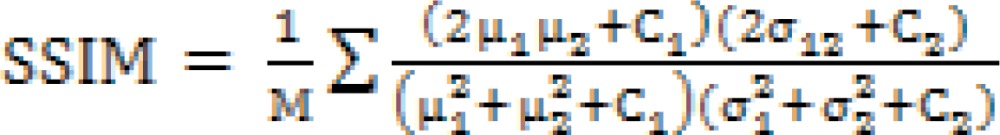
ii) Structural similarity
The SSIM measure is a way for assessing the similarity between two images. It is used to assess the preservation of spatial information of the pixel in the filtering process.
 |
[7] |
where μ1, μ2 and σ1, σ2 are the means and standard deviations of the images being compared, and σ12 is the covariance between them; is the total number of pixels. The SSIM has values in the −1 to 1 range, with unity representing structurally similar images. The SSIM lies between −1 for a bad and 1 for a good similarity between the original and despeckled images (11).
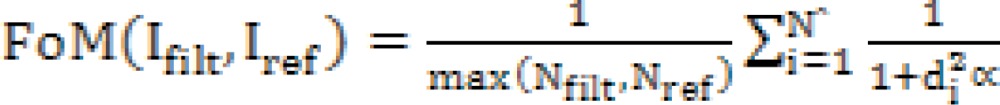
iii) Figure of merit
The FOM indicates edge pixel displacement between each filtered image Ifilt and reference Iref.
 |
[8] |
where Nfilt and Nref are the number of edge pixels in edge maps of Ifilt and Iref. Parameter α is set to a constant 1/9, and di is the Euclidean distance of the ith detected edge pixel and the nearest ideal edge pixel. The FOM has a range between 0 and 1, with 1 representing perfect edge preservation (11).
RESULTS
In this experiment, the clinical ultrasound images of cervix dataset obtained from the Regional Cancer Centre, Thiruvananthapuram, is shown in Fig. 1. The standardized ways of organizing and storing the image are in the format of bmp and the dimensions of 256 256. For analysis, 24 ultrasound images were tested at different times. Figure 2 shows the different levels of speckle noise such as 0.01, 0.02 and 0.03 of test image TI1 from the dataset. Figure 3 demonstrates the seven types of filter, processed from speckle noise 0.03 (level 3) ultrasound test image from the dataset. Tables 1–3 show the performances (PSNR, SSIM and edge preservation accuracy [FOM]) for all test images with IADF.
Fig. 1. Ultrasound cervix dataset test images (TI1-TI24).

Fig. 2. Noisy input image TI1. a) Noisy input image at level 0.01, b) noisy image at level 0.02, c) noisy image at level 0.03.

Fig. 3. Denoising of cervix input image (level 3) of different filters. a) Lee filter, b) Frost filter, c) Kuan filter, d) speckle reducing anisotropic diffusion (SRAD) filter, e) detail preserving anisotropic diffusion (DPAD) filter, f) oriented speckle reducing anisotropic diffusion (OSRAD) filter, g) improved anisotropic diffusion filter (IADF) (proposed).

Table 1. Peak signal-to-noise ratio (PSNR) of improved anisotropic diffusion filter (IADF).
| Performance matrix | PSNR |
|---|---|
| Test images | IADF (proposed) |
| TI2, TI3, TI5, TI7, TI10, TI11, TI13, TI16, TI17, TI19, TI21, TI22, TI23 | 31 dB |
| TI1, TI4, TI6, TI8, TI9, TI12, TI14, TI15, TI18, TI20, TI24 | 30 dB |
Table 3. Edge preservation accuracy of improved anisotropic diffusion filter (IADF).
| Performance matrix | Edge preservation accuracy |
|---|---|
| Test images | IADF (proposed) |
| TI6, TI10, TI13, TI14, TI19, TI20, TI21, TI24 | 88% |
| TI4, TI11, TI17, TI22 | 86% |
| TI5, TI12, TI18, TI23 | 84% |
| TI3, TI9, TI16 | 82% |
| TI1, TI2, TI7, TI8, TI15 | 81% |
Table 2. Structural similarity of improved anisotropic diffusion filter (IADF).
| Performance matrix SSIM | |
|---|---|
| Test images | IADF (proposed) |
| TI5, TI6, TI10, TI11, TI12, TI16, TI17, TI20, TI21 | 0.88 |
| TI3, TI8, TI14, TI18, TI23, TI24 | 0.85 |
| TI2, TI7, TI13, TI22 | 0.84 |
| TI4, TI9, TI15, TI19 | 0.82 |
| TI1 | 0.80 |
SSIM: structural similarity index map
From Tables 1–3, there are a few observations. The outcome shows that best performance for PSNR (31 dB) and SSIM (0.88) were achieved, respectively from the test images of TI2, TI3, TI5, TI7, TI10, TI11, TI13, TI16, TI17, TI19, TI21, TI22, TI23 and TI5, TI6, TI10, TI11, TI12, TI16, TI17, TI20, TI21. Similarly, edge preservation accuracy (88%) was obtained from the test images of TI6, TI10, TI13, TI14, TI19, TI20, TI21, TI24, respectively.
These observations show the IADF achieved best results for all cases. Some images show the predominant results for proposed filter and as an average, the best overall filter performances were obtained by the combination of all the datasets. Overall, experimental results proved that the IADF suppresses the speckle noise higher than previous filters. Figure 4 compares the rate of different filters with IADF. Figure 5 compares the structural similarity ratio of different filters with IADF. It is noted that IADF shows better performance. Figure 6 compares the accuracy rate of different filters with IADF, and IADF shows better performance in all cases.
Fig. 4. Extracted maximum peak signal-to-noise ratio (PSNR) rate of different filters.

Fig. 5. Extracted maximum structural similarity index map (SSIM) value of different filters.

Fig. 6. Extracted maximum edge preservation accuracy of different filters.

In the case of improved anisotropic diffusion, the filter suppresses the speckle more but the similarity between the two images shows poor performance. Table 4 shows PSNR values of all 24 images and the filters. Table 5 shows structural similarity between all the filters, while Table 6 shows the edge preservation accuracy of all filters. The low PSNR rate of 30 dB and SSIM (0.80) is noted in some test cases. The results also show low edge preservation accuracy (81%) noted in some test cases. Separate set of image gradient and eigenvalues improve the accuracy rate of PSNR, SSIM and edge preservation accuracy.
Table 4. Quality matrix of peak signal-to-noise ratio (PSNR).
| Performance matrix | PSNR (dB) | ||||||
|---|---|---|---|---|---|---|---|
| Test images (TI) | Lee | Frost | Kuan | DPAD | SRAD | OSRAD | IADF (proposed) |
| TI1 | 23.0164 | 22.3975 | 22.4512 | 22.341 | 22.2361 | 24.1209 | 30.023 |
| TI2 | 22.8471 | 21.7312 | 21.4012 | 23.1756 | 23.1765 | 23.1771 | 30.5114 |
| TI3 | 21.4045 | 20.1289 | 21.145 | 24.1472 | 24.1231 | 24.1785 | 30.7482 |
| TI4 | 22.0164 | 21.3975 | 21.4512 | 21.341 | 21.2361 | 21.1209 | 30.024 |
| TI5 | 22.0271 | 21.6312 | 21.1432 | 23.1435 | 23.1765 | 23.1771 | 30.7414 |
| TI6 | 20.4124 | 20.1354 | 21.132 | 24.1874 | 24.1681 | 24.4532 | 30.2482 |
| TI7 | 22.0164 | 21.3975 | 21.4512 | 21.341 | 22.2361 | 23.1209 | 30.7812 |
| TI8 | 21.8471 | 20.1354 | 20.4012 | 22.1756 | 22.1765 | 22.1771 | 30.3114 |
| TI9 | 20.4045 | 21.3975 | 20.145 | 23.1472 | 23.1231 | 23.1785 | 30.4578 |
| TI10 | 22.0164 | 20.7312 | 21.4512 | 21.341 | 21.2361 | 23.1209 | 30.523 |
| TI11 | 20.4045 | 19.1289 | 20.4012 | 22.1756 | 22.1765 | 22.1771 | 30.5123 |
| TI12 | 21.8471 | 21.3975 | 21.145 | 23.1472 | 23.1231 | 24.1785 | 30.2873 |
| TI13 | 22.0164 | 20.7312 | 20.4012 | 22.1756 | 22.1765 | 22.1771 | 30.5123 |
| TI14 | 21.8471 | 19.1289 | 22.4512 | 21.341 | 21.2361 | 23.1209 | 30.0451 |
| TI15 | 20.4045 | 20.7312 | 20.4012 | 22.1756 | 22.1765 | 22.1771 | 30.3451 |
| TI16 | 21.8471 | 21.3975 | 21.4012 | 22.1756 | 23.1231 | 24.1209 | 30.8482 |
| TI17 | 23.0164 | 20.7312 | 20.4012 | 22.1756 | 22.1765 | 22.1771 | 30.5123 |
| TI18 | 21.8471 | 20.7312 | 21.145 | 20.1472 | 22.2361 | 22.1771 | 30.023 |
| TI19 | 21.4045 | 19.1289 | 20.145 | 22.341 | 22.1765 | 24.1785 | 30.5123 |
| TI20 | 22.8471 | 22.3975 | 20.4012 | 22.1756 | 23.1765 | 24.1209 | 30.3114 |
| TI21 | 21.8471 | 20.7312 | 21.4512 | 24.1472 | 22.1765 | 23.1785 | 30.5123 |
| TI22 | 21.8471 | 21.7312 | 20.4012 | 22.1756 | 24.1231 | 22.1771 | 30.7482 |
| TI23 | 23.0164 | 20.7312 | 22.4512 | 23.1756 | 22.1765 | 23.1785 | 30.8482 |
| TI24 | 22.8471 | 20.1289 | 21.145 | 22.1756 | 22.2361 | 23.1771 | 30.3114 |
DPAD: detail preserving anisotropic diffusion; SRAD: speckle reducing anisotropic diffusion; OSRAD: oriented speckle reducing anisotropic diffusion; IADF: improved anisotropic diffusion filter
Table 5. Quality matrix of structural similarity index map (SSIM).
| Performance matrix | SSIM | ||||||
|---|---|---|---|---|---|---|---|
| Test images (TI) | Lee | Frost | Kuan | DPAD | SRAD | OSRAD | IADF (proposed) |
| TI1 | 0.8738 | 0.8517 | 0.8281 | 0.8424 | 0.8704 | 0.1265 | 0.8001 |
| TI2 | 0.3641 | 0.4134 | 0.6885 | 0.2563 | 0.2009 | 0.0781 | 0.8445 |
| TI3 | 0.821 | 0.9293 | 0.5656 | 0.5986 | 0.4897 | 0.0563 | 0.8513 |
| TI4 | 0.8602 | 0.8193 | 0.8136 | 0.7107 | 0.8246 | 0.8153 | 0.8217 |
| TI5 | 0.0683 | 0.0703 | 0.9266 | 0.1404 | 0.0939 | 0.5298 | 0.878 |
| TI6 | 0.442 | 0.4859 | 0.2113 | 0.4409 | 0.4265 | 0.3943 | 0.8753 |
| TI7 | 0.3641 | 0.4134 | 0.6885 | 0.2563 | 0.2009 | 0.0781 | 0.8415 |
| TI8 | 0.821 | 0.9293 | 0.5656 | 0.5986 | 0.4897 | 0.0563 | 0.8513 |
| TI9 | 0.8602 | 0.0703 | 0.8136 | 0.7107 | 0.8246 | 0.8153 | 0.8247 |
| TI10 | 0.0683 | 0.4859 | 0.9266 | 0.1404 | 0.0939 | 0.5298 | 0.878 |
| TI11 | 0.442 | 0.4134 | 0.2113 | 0.4409 | 0.4265 | 0.3943 | 0.8753 |
| TI12 | 0.3641 | 0.9293 | 0.6885 | 0.2563 | 0.2009 | 0.0781 | 0.8753 |
| TI13 | 0.3641 | 0.8193 | 0.5656 | 0.5986 | 0.4897 | 0.0563 | 0.8465 |
| TI14 | 0.821 | 0.0703 | 0.9266 | 0.7107 | 0.4265 | 0.8153 | 0.8513 |
| TI15 | 0.8602 | 0.4134 | 0.2113 | 0.1404 | 0.8246 | 0.5298 | 0.8247 |
| TI16 | 0.0683 | 0.4859 | 0.8281 | 0.4409 | 0.0939 | 0.3943 | 0.878 |
| TI17 | 0.442 | 0.9293 | 0.6885 | 0.8424 | 0.4265 | 0.5298 | 0.8753 |
| TI18 | 0.3641 | 0.8193 | 0.5656 | 0.2563 | 0.4897 | 0.3943 | 0.8513 |
| TI19 | 0.821 | 0.0703 | 0.8136 | 0.5986 | 0.8246 | 0.0781 | 0.8247 |
| TI20 | 0.8602 | 0.4859 | 0.2113 | 0.7107 | 0.0939 | 0.8153 | 0.878 |
| TI21 | 0.0683 | 0.4134 | 0.6885 | 0.5986 | 0.4897 | 0.5298 | 0.8753 |
| TI22 | 0.442 | 0.4859 | 0.5656 | 0.5986 | 0.0939 | 0.3943 | 0.8415 |
| TI23 | 0.821 | 0.0703 | 0.6885 | 0.2563 | 0.4265 | 0.0781 | 0.8513 |
| TI24 | 0.8602 | 0.8193 | 0.8281 | 0.1404 | 0.8246 | 0.8153 | 0.8513 |
DPAD: detail preserving anisotropic diffusion; SRAD: speckle reducing anisotropic diffusion; OSRAD: oriented speckle reducing anisotropic diffusion; IADF: improved anisotropic diffusion filter
Table 6. Quality matrix of figure of merit (FOM).
| Performance matrix | Edge preservation accuracy (%) | ||||||
|---|---|---|---|---|---|---|---|
| Test images (TI) | Lee | Frost | Kuan | DPAD | SRAD | OSRAD | IADF (proposed) |
| TI1 | 0.6531 | 0.7197 | 0.6377 | 0.4227 | 0.1506 | 0.7925 | 0.8111 |
| TI2 | 0.6215 | 0.6803 | 0.6089 | 0.3807 | 0.1359 | 0.7294 | 0.8148 |
| TI3 | 0.6286 | 0.6527 | 0.5688 | 0.3576 | 0.1231 | 0.746 | 0.8243 |
| TI4 | 0.6993 | 0.7375 | 0.6384 | 0.5144 | 0.3118 | 0.7735 | 0.8641 |
| TI5 | 0.7003 | 0.7375 | 0.677 | 0.5525 | 0.3272 | 0.7854 | 0.8439 |
| TI6 | 0.6929 | 0.7575 | 0.6751 | 0.5385 | 0.3438 | 0.7889 | 0.8845 |
| TI7 | 0.6531 | 0.7197 | 0.6751 | 0.3807 | 0.1506 | 0.7925 | 0.8111 |
| TI8 | 0.6215 | 0.6803 | 0.6377 | 0.4227 | 0.1359 | 0.7294 | 0.8148 |
| TI9 | 0.6286 | 0.6527 | 0.6089 | 0.3807 | 0.1231 | 0.746 | 0.8243 |
| TI10 | 0.6531 | 0.7197 | 0.5688 | 0.3576 | 0.3118 | 0.7925 | 0.8811 |
| TI11 | 0.6993 | 0.7375 | 0.6384 | 0.5144 | 0.3118 | 0.7735 | 0.8641 |
| TI12 | 0.7003 | 0.7553 | 0.677 | 0.5525 | 0.3272 | 0.7854 | 0.8439 |
| TI13 | 0.6929 | 0.7575 | 0.6751 | 0.5385 | 0.3438 | 0.7889 | 0.8845 |
| TI14 | 0.6531 | 0.7197 | 0.6089 | 0.3576 | 0.1506 | 0.7925 | 0.8811 |
| TI15 | 0.6929 | 0.6803 | 0.6377 | 0.4227 | 0.1359 | 0.7294 | 0.8148 |
| TI16 | 0.6215 | 0.6527 | 0.6089 | 0.3807 | 0.1231 | 0.746 | 0.8243 |
| TI17 | 0.6286 | 0.6803 | 0.5688 | 0.3576 | 0.3118 | 0.7735 | 0.8631 |
| TI18 | 0.6993 | 0.7375 | 0.6384 | 0.5144 | 0.3272 | 0.7854 | 0.8439 |
| TI19 | 0.7003 | 0.7553 | 0.677 | 0.5525 | 0.3272 | 0.7889 | 0.8845 |
| TI20 | 0.6929 | 0.7575 | 0.6751 | 0.5385 | 0.3438 | 0.7294 | 0.8758 |
| TI21 | 0.6993 | 0.7375 | 0.6384 | 0.5144 | 0.3438 | 0.7889 | 0.8845 |
| TI22 | 0.7003 | 0.7553 | 0.6384 | 0.5385 | 0.3118 | 0.7735 | 0.8641 |
| TI23 | 0.6929 | 0.7575 | 0.677 | 0.5525 | 0.3272 | 0.7854 | 0.8439 |
| TI24 | 0.6993 | 0.7553 | 0.6751 | 0.5385 | 0.3438 | 0.7889 | 0.8845 |
DPAD: detail preserving anisotropic diffusion; SRAD: speckle reducing anisotropic diffusion; OSRAD: oriented speckle reducing anisotropic diffusion; IADF: improved anisotropic diffusion filter
DISCUSSION
In this work, we presented an efficient IADF that gives better results, and this approach represents some real time performance for denoising an ultrasound image. The proposed approach provides the quality metrics of 31 dB, SSIM of 0.88 and also the edge preservation accuracy of 88%. Additionally, our approach shows better improvement in terms of SSIM with the original image reconstructed.
Further investigations into the nature and uses of IADF are analysed. The computational efficiency and robustness of the proposed approach is compared with several state-of-the-art filters in ultrasound images. The experimental results verify that the proposed technique achieves the highest accuracy among all the strategies under comparison. Lastly, the IADF is tested with mostly real time ultrasound images and shows better improvements with less time for execution.
REFERENCES
- 1.World Health Organization . Comprehensive cervical cancer control: a guide to essential practice. Geneva: WHO; 2006. [PubMed] [Google Scholar]
- 2.India Medical Times Cervical cancer leading cancer-killer among Indian women. Aalatimes Media Venture. 2012. Mar 28, [[cited 2013 Jul 10]]. Available from: http://www.aalatimes.com/2012/03/28/cervical-cancer-leading-cancer-killer-among-indian-women.
- 3.Parkin DM, Bray F, Ferlay J, Pisani P. Global cancer statistics, 2002. CA Cancer J Clin. 2005;55:74–108. doi: 10.3322/canjclin.55.2.74. [DOI] [PubMed] [Google Scholar]
- 4.Castellsague X, Sanjose S de, Aguado T, Louie KS, Bruni L, Munoz J, et al. HPV and cervical cancer in the world 2007 report. Vaccine. 2007;25:C1–C26. [Google Scholar]
- 5.Shanta V. Perspectives in cervical cancer prevention in India. Brussels: International Network for Cancer Treatment and Research; 2003. [Google Scholar]
- 6.Ovireddy S, Muthusamy E. Speckle suppressing anisotropic diffusion filter for medical ultrasound images. Ultrason Imaging. 2014;36:112–132. doi: 10.1177/0161734613512200. [DOI] [PubMed] [Google Scholar]
- 7.Kaur J, Kaur J, Kaur M. Survey of despeckling techniques for medical ultrasound images. Int J Comp Tech Appl. 2011;2:1003–1007. [Google Scholar]
- 8.Aja-Fernandez S, Alberola-Lopez C. On the estimation of the coefficient of variation for anisotropic diffusion speckle filtering. IEEE Trans Image Process. 2006;15:2694–2701. doi: 10.1109/tip.2006.877360. [DOI] [PubMed] [Google Scholar]
- 9.Loizou CP, Pattichis CS, Member S, Christodoulou CI, Istepanian RSH, Pantziaris M, et al. Comparative evaluation of despeckle filtering in ultrasound imaging of the carotid artery. IEEE Trans Ultrason Ferroelectr Freq Control. 2005;52:1653–1669. doi: 10.1109/tuffc.2005.1561621. Available from: http://ieeexplore.ieee.org/stamp/stamp.jsp?arnumber=1561621. [DOI] [PubMed] [Google Scholar]
- 10.Lee JS. Digital image enhancement and noise filtering by use of local statistics. IEEE Trans Pattern Anal Mach Intell. 1980;2:165–168. doi: 10.1109/tpami.1980.4766994. [DOI] [PubMed] [Google Scholar]
- 11.Abd-Elmoniem K, Youssef A-B, Kadah Y. Real-time speckle reduction and coherence enhancement in ultrasound imaging via nonlinear anisotropic diffusion. IEEE Trans Biomed Eng. 2002;49:997–1014. doi: 10.1109/TBME.2002.1028423. [DOI] [PubMed] [Google Scholar]
- 12.Finn S, Glavin M, Jones E. Echocardiographic speckle reduction comparison. IEEE Trans Ultrason, Ferroelectr Freq Control. 2011;58:82–101. doi: 10.1109/TUFFC.2011.1776. [DOI] [PubMed] [Google Scholar]
- 13.Shanthi I, Valarmathi ML. Speckle noise suppression of SAR color image using hybrid mean median filter. Int J Comput Appl. 2011;31:13–22. [Google Scholar]
- 14.Yu Y, Acton S. Speckle reducing anisotropic diffusion. IEEE Trans Image Process. 2002;11:1260–1270. doi: 10.1109/TIP.2002.804276. [DOI] [PubMed] [Google Scholar]
- 15.Liu F, Liu J. Anisotropic diffusion for image denoising based on diffusion tensors. J Vis Commun Image R. 2012;23:516–521. [Google Scholar]
- 16.Krissian K, Westin C-F, Kikinis R, Vosburgh K. Oriented speckle reducing anisotropic diffusion. IEEE Trans Image Process. 2007;16:1412–1424. doi: 10.1109/tip.2007.891803. [DOI] [PubMed] [Google Scholar]
- 17.Hafizah WM, Supriyanto E. Comparative evaluation of ultrasound kidney image enhancement techniques. Int J Comput Appl. 2011;21:15–19. [Google Scholar]
- 18.Jemila Rose R, Allwin S. Speckle suppressing improved oriented speckle reducing anisotropic diffusion (IOSRAD) filter for medical ultrasound images. Appl Mech Mater. 2014;626:106–110. [Google Scholar]