Abstract
The energetic burden of continuously concentrating solutes against gradients along the tubule may render the kidney especially vulnerable to ischemia. Indeed, acute kidney injury (AKI) affects 3% of all hospitalized patients.1,2 Here we show that the mitochondrial biogenesis regulator, PGC1α,3,4 is a pivotal determinant of renal recovery from injury by regulating NAD biosynthesis. Following renal ischemia, PGC1α−/− mice developed local deficiency of the NAD precursor niacinamide (Nam), marked fat accumulation, and failure to re-establish normal function. Remarkably, exogenous Nam improved local NAD levels, fat accumulation, and renal function in post-ischemic PGC1α−/− mice. Inducible tubular transgenic mice (iNephPGC1α) recapitulated the effects of Nam supplementation, including more local NAD and less fat accumulation with better renal function after ischemia. PGC1α coordinately upregulated the enzymes that synthesize NAD de novo from amino acids whereas PGC1α deficiency or AKI attenuated the de novo pathway. Nam enhanced NAD via the enzyme NAMPT and augmented production of the fat breakdown product beta-hydroxybutyrate (β-OHB), leading to increased prostaglandin PGE2, a secreted autocoid that maintains renal function.5 Nam treatment reversed established ischemic AKI and also prevented AKI in an unrelated toxic model. Inhibition of β-OHB signaling or prostaglandins similarly abolished PGC1α-dependent renoprotection. Given the importance of mitochondrial health in aging and the function of metabolically active organs, the results implicate Nam and NAD as key effectors for achieving PGC1α-dependent stress resistance.
The mature renal tubule returns ~140L/day of filtered plasma water back to the circulation by establishing energy-intensive electrochemical gradients between the filtrate and vasculature. The kidney is only second to the heart in mitochondrial abundance.6 We hypothesized that PGC1α (peroxisome proliferator activated receptor gamma co-activator-1-alpha), enriched in renal tubules and important for stress resistance in the brain, heart and other metabolically active organs,4,7–9 regulates oxidative metabolism in the epithelium to affect overall kidney health.
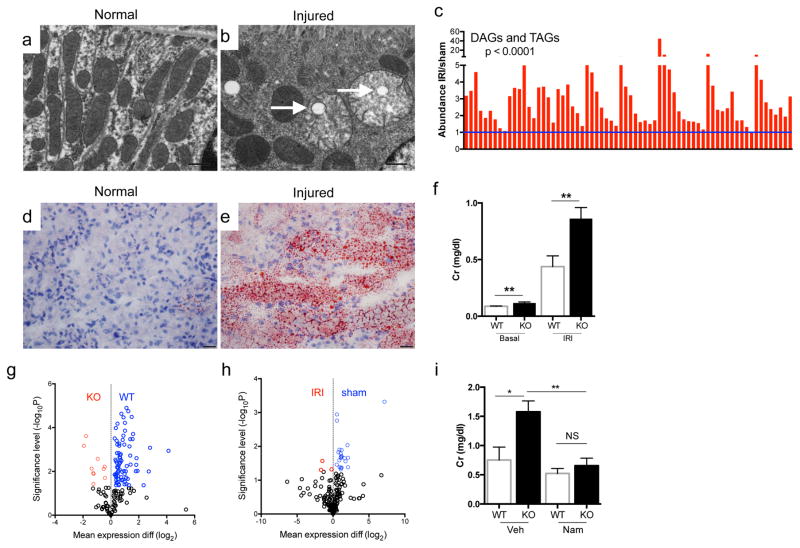
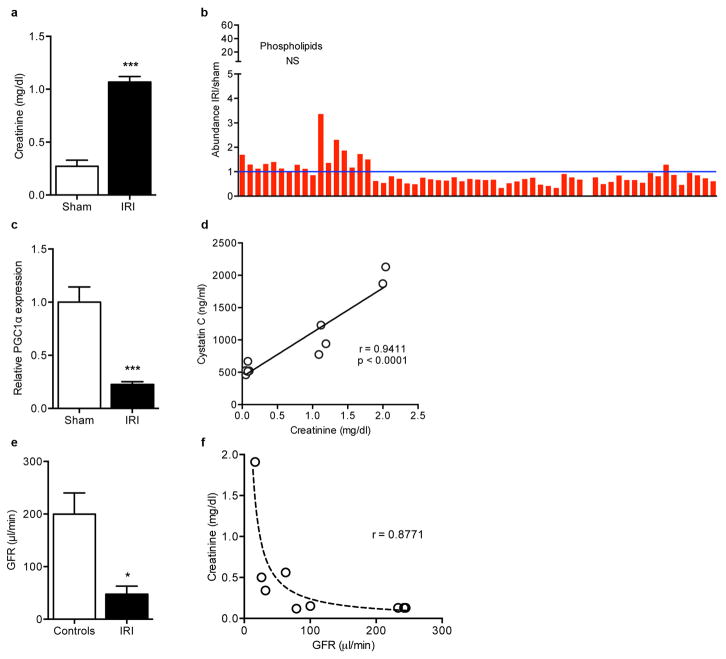
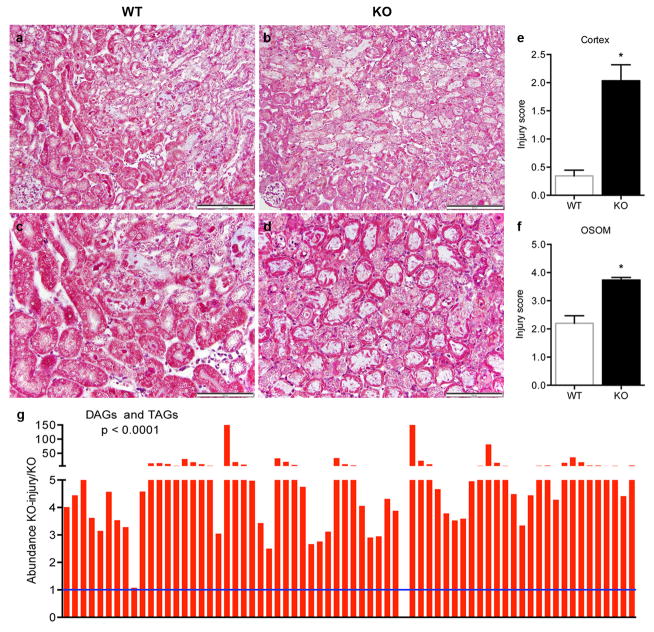
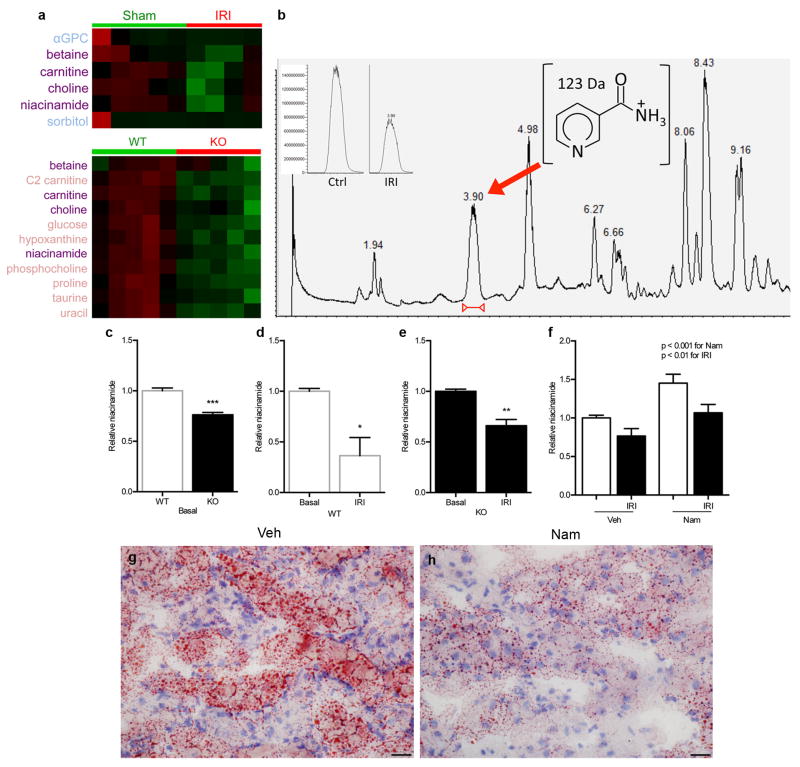
Hans Krebs identified acylglycerols as a major renal fuel.7 Following transient local ischemia, renal function worsened, PGC1α expression declined, tubular mitochondria swelled, and a pronounced accumulation of acylglycerols developed in tubules (p < 0.0001, Fig 1a–e, Extended Data 1a–c). The fidelity of serum creatinine was confirmed by comparison to cystatin C and inulin clearance (Extended Data 1d–f). PGC1α−/− mice experienced worse renal function, greater fat accumulation, and more tubular injury following ischemia (Fig 1f, Extended Data 2a–g). To define pathways specific to PGC1α altered by ischemia, we examined metabolite profiles. Comparing sham vs. post-ischemic kidneys yielded six differentially abundant metabolites; comparing uninjured PGC1α−/− vs. wildtype littermate kidneys yielded 11. Four were shared between settings, with all four lower in PGC1α−/− and post-ischemic kidneys (Fig 1g,h, Extended Data 3a,b).
Figure 1. Niacinamide (Nam) supplementation restores normal post-ischemic response in PGC1α−/− mice.
a, Pre-ischemic normal morphology and b, swollen mitochondria inside tubular cell 24h after ischemia-reperfusion injury (IRI). Scale bar 200nm. c, Renal di-/tri-acylglycerols (DAGs, TAGs) 24h following sham or IRI (n=6/group). P-value by ANOVA. d,e, Oil Red O (pink) for fat in normal and post-ischemic kidneys, scale bar 20μm. f, serum creatinine wildtype (WT) vs PGC1α−/− (KO) mice (basal, n=7/group; post-ischemia, n=18/group). g,h, Volcano plots of kidney metabolites from KO vs. WT or IRI vs. sham (univariate p<0.05 for colored dots, n=6/group). i, Serum creatinine in post-ischemic WT vs. KO mice treated with vehicle (Veh, n=5) vs. Nam (n=9). Error bars SEM, *p<0.05, **p<0.01.
Of these, carnitine deficiency in PGC1α−/− and post-ischemic kidneys supported mitochondrial involvement in both situations. Deficiency of betaine and choline, two osmolytes essential for cell volume maintenance in the uniquely hypertonic renal environment, was not unanticipated. We therefore focused on niacinamide (Nam), the predominant mammalian precursor to synthesize the energy carrier NAD needed for fatty acid oxidation (FAO).8 After confirming the metabolomics results (Extended Data 3c–e), we tested the effect of Nam supplementation. Exogenous Nam increased renal Nam (p < 0.001), normalized post-ischemic fat accumulation, and completely prevented post-ischemic AKI in PGC1α−/− mice (Fig 1i, Extended Data 3f–h), implicating this metabolite as an unexpected effector of PGC1α.
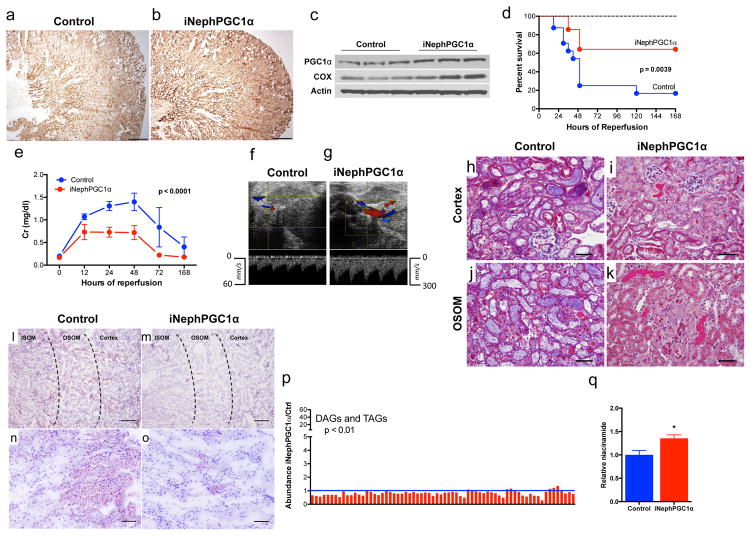
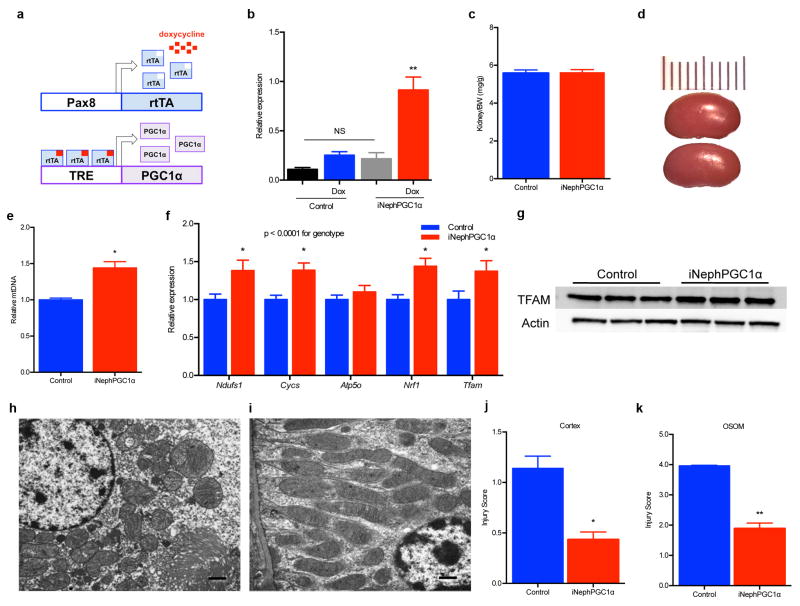
To probe the robustness of PGC1α’s relation to Nam, fat accumulation, and renal function, we developed an inducible tubular epithelial transgenic model using the well-validated Pax8 promoter (iNephPGC1α).9 Heterologous PGC1α was tightly controlled without leaky gene expression; organ size and mass were indistinguishable; and mitochondrial abundance increased—as assessed by comparing mitochondrial to nuclear DNA and mitochondrial gene products to cytosolic gene products—without altering ultrastructural morphology or the anatomical distribution favoring cortex and outer stripe of the outer medulla (Fig 2a–c, Extended Data 4a–i). iNephPGC1α mice tolerated renal ischemia more successfully, achieving better survival (p = 0.0039), more preserved function (p < 0.0001), better kidney perfusion, and less tubular injury (Fig 2d–k, Extended Data 4j,k). Sham-operated mice experienced no significant change in creatinine or reduced survival. Renal Nam was higher in post-ischemic iNephPGC1α mice, and post-ischemic fat accumulation was markedly reduced compared to controls (p < 0.0001, Fig 2l–q). Renal protection in iNephPGC1α mice was shared across distinct models as post-inflammatory renal injury was also attenuated (Extended Data 5a). PGC1α’s effect appeared to be cell-type specific as endothelial over-expression conferred no renoprotection (Extended Data 5b).
Figure 2. Metabolic protection in post-ischemic iNephPGC1α mice.
a,b, Renal cytochrome c oxidase activity (brown), scale bar 500μm. c, Renal PGC1α and cytochrome c oxidase subunit IV. d, Survival curve following IRI (n=14 control; 24 iNephPGC1α). Dashed line for sham-operated mice (n=10). e, Serial serum creatinines from mice in d analyzed by ANOVA. f,g, Renal artery pulse wave and color Doppler 24h after IRI representative of 6/group. h–k, Tubular injury in cortex and outer stripe of outer medulla (OSOM) 24h after IRI representative of 8/group. Scale bar 100μm. l–o, Oil red O (pink) for fat in iNephPGC1α mice and controls 24h after IRI representative of 8/group. Scale bars 200μm (upper) and 50μm (lower). p, Renal Di-/tri-acylglycerols (DAGs, TAGs) in post-ischemic iNephPGC1α mice vs. controls (n=6/group). q, Relative renal Nam 24h after IRI (n=6/group). Error bars SEM, *p<0.05.
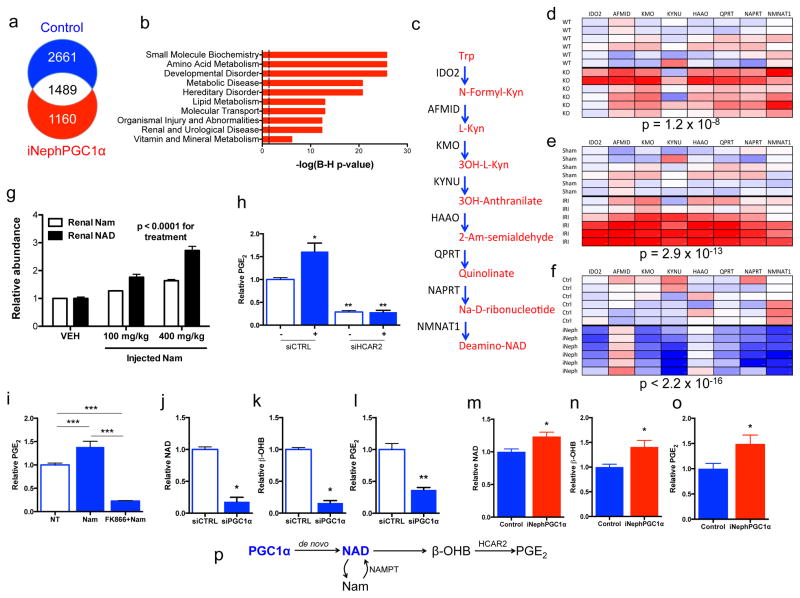
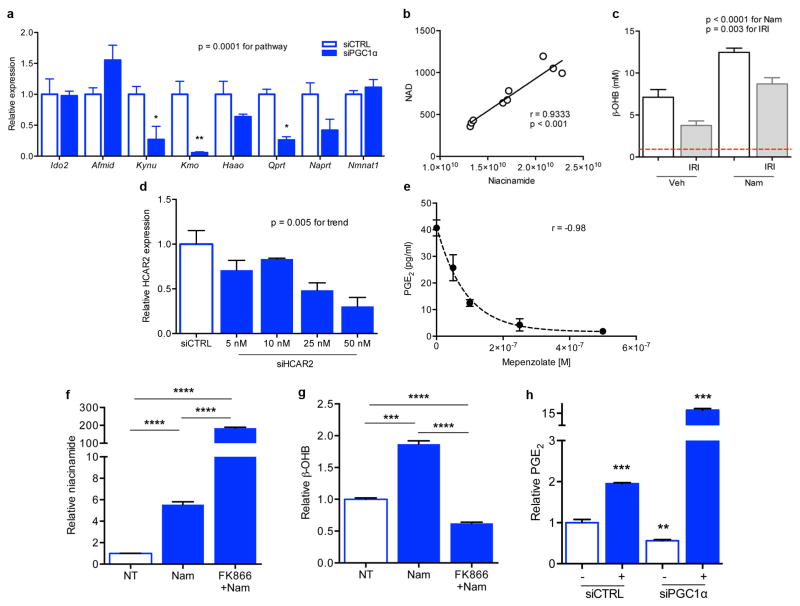
RNA sequencing identified 1160 transcripts associated with PGC1α-dependent renoprotection (Fig 3a, Supplementary Information Table 1). The pathways most over-represented related to intermediary metabolism (Fig 3b). Closer examination revealed that de novo NAD biosynthetic enzymes were coordinately regulated, induced in uninjured iNephPGC1α kidneys and suppressed in post-ischemic or uninjured PGC1α−/− kidneys (Fig 3c–f). PGC1α’s effect on the de novo pathway was cell- autonomous as knockdown in isolated renal tubular cells was sufficient to suppress the pathway (p = 0.0001, Extended Data 6a).
Figure 3. Nam induces β-OHB downstream of PGC1α to augment PGE2.
a, Renal RNA sequencing 24h after IRI or sham operation in controls vs. iNephPGC1α mice with enumerated transcripts. b, Pathway analysis of 1160 transcripts unique to post-ischemic iNephPGC1α mice graphed by −log10[Benjamini-Hochberg-corrected p-value]. Dashed line at p<0.05. c, de novo NAD biosynthetic pathway adapted from KEGG (www.genome.jp/kegg). Trp=tryptophan, Kyn=kynurenine, Am=amino, Na=nicotinate. d–f, Heatmaps (red=lower, blue=higher) of intrarenal expression for de novo pathway from KO vs. WT; 24h after sham vs. IRI; and iNephPGC1α vs. controls (n=6/group). P-values by ANOVA. g, Relative renal Nam and NAD 4h after indicated Nam dose. P-value by ANOVA. h, Conditioned-media-PGE2 of renal tubular cells after HCAR2 knockdown with and without HCAR2 stimulation (+,niacin 10mM, n=6/group). i, PGE2 from renal cells following Nam (1μM for 24h) with and without NAMPT inhibitor FK866 (10nM, n=6/group). j–l, Intracellular NAD, conditioned-media beta-hydroxybutyrate (β-OHB), and conditioned-media PGE2 in PGC1α knockdown cells (n=6/group). m–o, Relative renal NAD, β-OHB, and PGE2 in control vs. iNephPGC1α mice (n=6/group). *p<0.05, **p<0.01, ***p<0.001. p, Renal epithelial PGC1α coordinately upregulates de novo NAD biosynthesis, in the absence of which Nam is utilized through the NAMPT-salvage pathway to generate NAD. Consequently, β-OHB accumulates, which signals HCAR2 to induce PGE2. Error bars SEM.
As epithelial PGC1α defended renal function and resolved post-ischemic fat accumulation, we hypothesized that protection from AKI may relate to Nam, NAD, and fatty acid utilization. Indeed, exogenous Nam dose-dependently increased renal NAD and drove local accumulation of the fatty acid breakdown product β-OHB to ~ten-fold higher than normal circulating concentrations (p < 0.0001, Fig 3g and Extended Data 6b,c). β-OHB activates HCAR2, a G-protein coupled receptor that induces the renoprotective prostaglandin PGE2.5,15 Silencing or chemical inhibition of HCAR2 markedly reduced both basal and ligand-dependent PGE2 secretion (Fig 3h, Extended Data 6d,e). Nam augmented PGE2 secretion, requiring conversion to NAD via the enzyme NAMPT to do so (Fig 3i, Extended Data 6f,g).10 Silencing of PGC1α reduced each intermediate, lowering the cellular NAD and secreted β-OHB and PGE2 (Fig 3j–l). In PGC1α-silenced cells, excess β-OHB was still able to induce PGE2 secretion (p < 0.0001, Extended Data 6h). Finally, renal levels of each component mirrored the cellular results, with opposing effects of PGC1α deficiency and excess on NAD, β-OHB, and PGE2 (Fig 3m–o, Extended Data 7a–c). Together, these results implicated PGC1α-dependent NAD production as an important determinant of cellular metabolism that induces renoprotective molecules (Fig 3p).
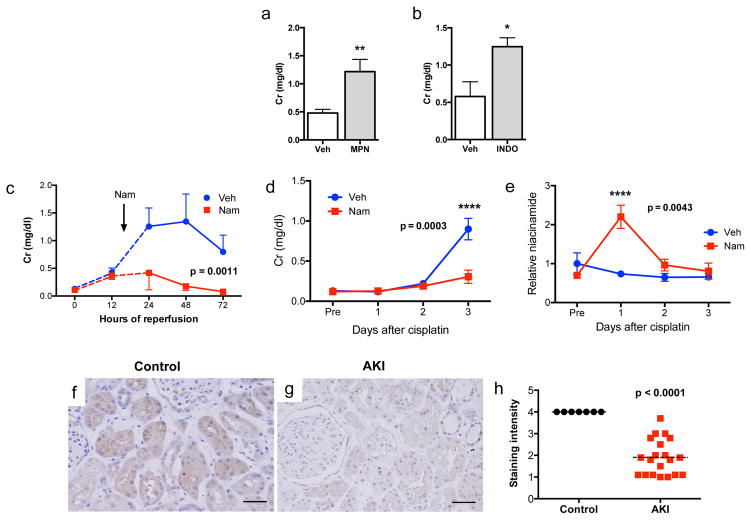
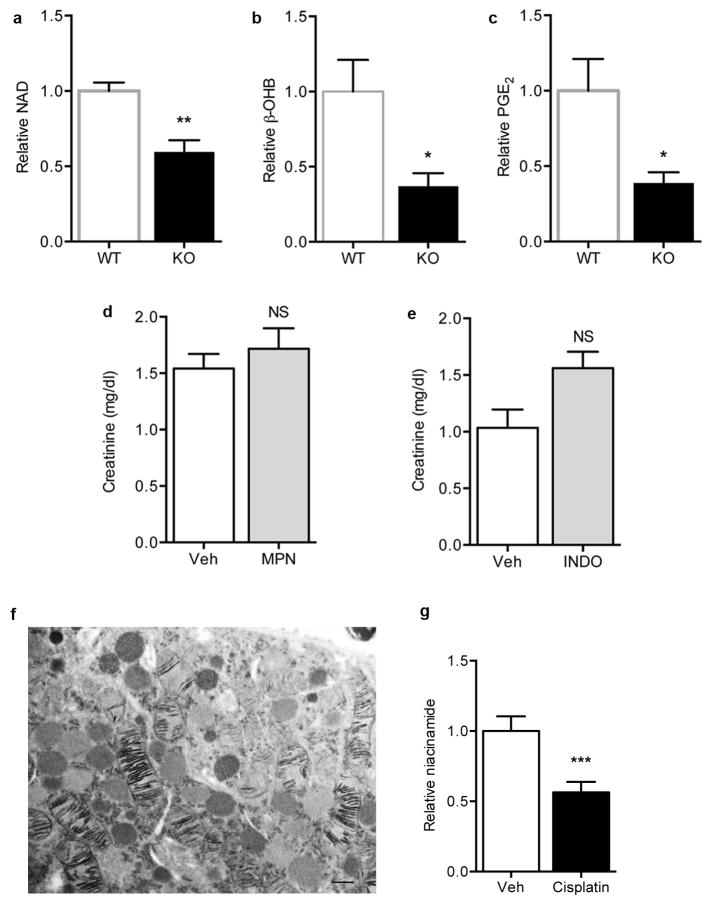
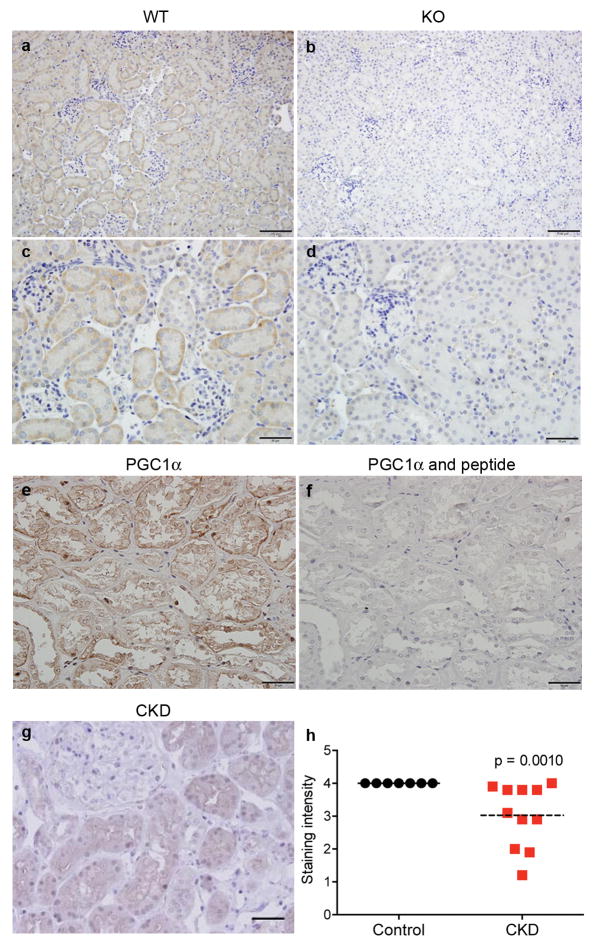
To test this further, we inhibited β-OHB signaling with mepenzolate bromide or prostaglandin synthesis with indomethacin in iNephPGC1α mice subjected to ischemia. Renal protection was similarly abolished in either setting, confirming their roles as PGC1α effectors (Fig 4a,b, Extended Data 7d,e). Since Nam prevented ischemic AKI in PGC1α−/− mice, we then asked whether Nam has a broader therapeutic role. Nam administered after established AKI significantly improved renal function (p = 0.0011, Fig 4c). We also observed that renal Nam declined following cisplatin, a chemotherapy whose use is limited by nephrotoxicity and whose injurious mechanism involves mitochondria but is considered distinct from ischemia (Extended Data 7f,g). Nam supplementation prevented cisplatin-induced AKI (Fig 4d,e). Finally, we found that PGC1α expression in human AKI was strongly suppressed, even in histologically normal regions of renal tissue (Fig 4f–h, Extended Data 8a–f), mirroring the AKI-induced suppression of PGC1α observed in experimental models (Extended Data 1c and 11). These results show that PGC1α is a negatively regulated target in AKI.
Figure 4. PGC1α effectors, Nam as therapy, and PGC1α in human AKI.
a, Serum creatinine in iNephPGC1α mice 24h after IRI with vehicle vs. mepenzolate (MPN, 10mg/kg IP) treatment (n=6/group). b, Serum creatinine in iNephPGC1α mice 24h after IRI with vehicle vs. indomethacin (INDO, 10mg/kg IP) treatment (n=6/group). c, Serial serum creatinines in mice receiving a single dose of Nam (400 mg/kg IP) 18h after the onset of reperfusion, i.e., with established AKI. Analyzed by ANOVA (n=5/group). d, Serial serum creatinines after cisplatin (25mg/kg IP administered on day 0) with or without Nam (400mg/kg IP on day −1 and day 0). Analyzed with Bonferroni-corrected ANOVA (n=5/group). e, Relative renal Nam from d. f,g, Representative immunostaining (brown) for PGC1α from control human kidney and a renal biopsy for AKI. Scale bars 50μm. h, PGC1α immunostaining intensity (1=weakest, 4=strongest). Each dot represents a unique specimen. Analyzed by Mann-Whitney. Error bars SEM, *p<0.05, **p<0.01, ****p<0.0001.
The present results identify PGC1α as a pivotal mediator of renal resistance to acute stressors. By linking oxidative metabolism in the epithelium to overall organ function, the proposed pathway provides new insight into a longstanding observation, namely the exquisite sensitivity of the kidney to ischemia and other insults. More fundamentally, the results implicate NAD biosynthesis as a coordinately regulated target of PGC1α.
NAD has long been recognized for its central role in energy metabolism, with recent work demonstrating that NAD is rate-limiting for mitochondrial function.12 NAD augmentation appears to restore youthful mitochondrial function and reverse age-related declines in health.13 In contrast, NAD depletion has been described as a feature of diabetes.14 Since diabetes and aging are two of the most prevalent predispositions for AKI, the present results motivate interest in whether local NAD concentration may provide a setpoint for resistance to acute renal stressors. NAD may also be important for the gradual decline of kidney function with normal aging.
That an even larger set of known AKI risk factors—including diabetes, but also chronic kidney disease (Extended Data 8g,h), sepsis, and warm ischemia—is associated with reduction of PGC1α,11,15 further attests to the potential relevance of the results to human disease. Experiments targeting mitochondrial biogenesis through a drug-screening approach offer additional promise for this avenue in AKI.16 Since AKI has been associated with death in critically ill patients,1 that excess renal PGC1α improves survival after AKI highlights the importance of the kidney to overall health. Downstream of PGC1α, Nam may not only be an effective preventative agent, but also a potential therapy for established AKI, a set of diseases for which no drug has yet been identified.
PGC1α in skeletal muscle has been shown to exert extracellular effects, whether through the myokine irisin, metabolites such as kynurenine, or the angiogenic factor VEGF.17–19 By comparison, the present results show that renal tubular PGC1α communicates with neighboring cells at least through PGE2. Therapeutic manipulation of renal β-OHB may constitute one means of increasing PGE2. PGE2 is a well-recognized vasodilator in the kidney, but may also be exerting cytoprotective effects in AKI (reviewed in 20), actions that have been demonstrated in multiple animal models and even humans.21–23
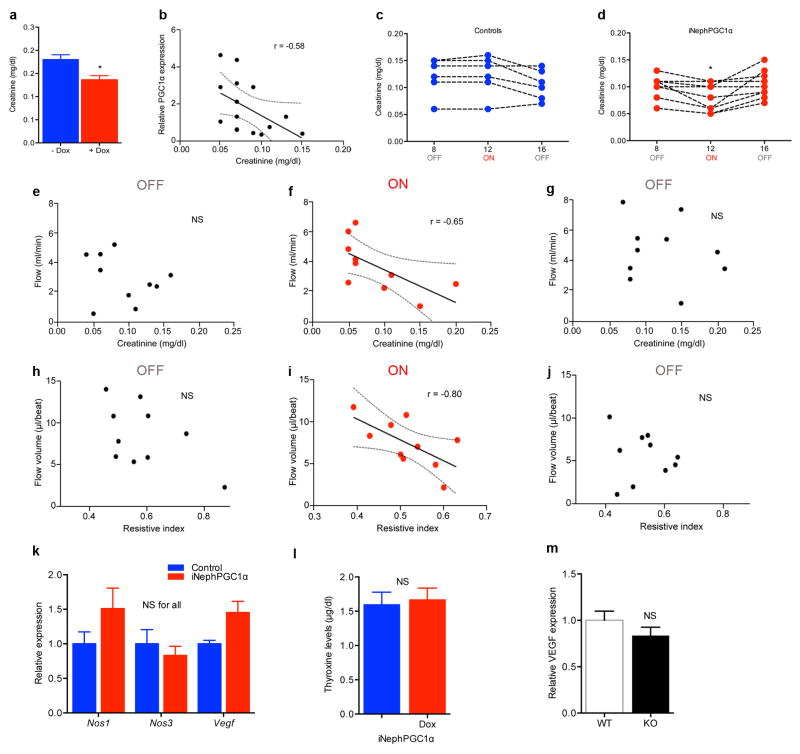
We observed enhanced renal function, vascular relaxation, and increased perfusion at baseline as a result of excess PGC1α in the epithelial compartment of the kidney in the iNephPGC1α model (Extended Data 9a–j), physiological features that would be consistent with functional responses of the local vasculature to the excess renal PGE2 present in this model. However, we also asked whether VEGF was regulated by renal PGC1α as such features could also arise from increased vascularization (Extended Data 9k–m). PGC1α−/− mice showed no decrement in renal VEGF and iNephPGC1α mice displayed only modest induction vs. their respective controls. This strongly contrasts with VEGF induction by skeletal muscle PGC1α,17 suggesting the presence of cell-specific modulators of PGC1α function such as ERRα, which is notably more abundant in skeletal muscle than kidney (www.biogps.org).
Our results suggest several avenues for future investigation. First, the coordinated regulation of NAD biosynthesis by PGC1α may occur in other cells and organs, particularly under stress conditions. Of the major biosynthetic routes to NAD—de novo from amino acids, the Preiss-Handler pathway from niacin, and salvage from Nam via NAMPT—PGC1α’s action on each will require careful dissection as this may vary depending on cell type and condition. The transcription factor(s) with which PGC1α interacts to induce the de novo pathway are of substantial interest. Since ischemia did not reduce renal NAMPT (Extended Data 10), the salvage pathway may be a viable therapeutic route. Second, the rapid reduction of NAD during AKI may also relate to its already short half-life24 as well as the action of NAD-consuming enzymes such as PARPs, nucleotidases, and sirtuins, all of which have been implicated in this condition.25–27 Third, NAD’s emerging role as a guardian against age-related decline in health and mitochondrial function13 suggests that therapeutic manipulation of Nam and NAD may have implications beyond AKI. For example, NAMPT agonism protects against experimental neuronal injury.28 And inhibition of urinary Nam disposal (by blocking N-methylation) prevents experimental obesity.29 Finally, the link from mitochondrial metabolism to renoprotective prostaglandins unites two major avenues of mechanistic investigation in AKI, but other mediators and downstream effectors for renal PGC1α may also exist.
In summary, the present work applies complementary discovery approaches to identify a new pathway by which parenchymal PGC1α affects NAD to protect against renal injury. The results may have mechanistic, diagnostic, and therapeutic implications in the kidney and beyond.
METHODS
Mouse studies
All studies with mice were reviewed and approved by the Institutional Animal Use and Care Committee of Beth Israel Deaconess Medical Center (BIDMC). PGC1α−/− (stock # 008597), Pax8-rtTA (# 007176) and TRE-PGC1α (# 012387) mice were all obtained from Jackson Laboratories and bred at BIDMC. The parental strains were generated on a mixed C57 background with further backcrossing into C57BL/6J as described by the manufacturer, except for the TRE-PGC1α mouse, which was generated on and is maintained on FVB. Primers for genotyping have been described elsewhere.30,31 All experiments were performed with littermate controls.
Ischemia-reperfusion injury (IRI) was performed on 8–12 week-old males through two small paramedial dorsal incisions by applying a microvascular clamp to each renal pedicle for 20 minutes. Mice were anesthetized with isoflurane for the duration of surgery and warmed to 37°C using a servo-controlled heating pad. Incisions were closed in two layers and mice were revived with 1 ml warm saline injected intraperitoneally.
All chemicals were purchased from Sigma-Aldrich unless otherwise noted. Niacinamide was given by intraperitoneal injection of 400 mg/kg/day × 4 days in saline, with the final dose an hour prior to IRI surgery. In rescue experiments, the same dose was administered once 18 hours after reperfusion. Indomethacin was given by intraperitoneal injection of 10 mg/kg in 0.1 M sodium carbonate/saline an hour prior to IRI. The HCAR2 inhibitor, mepenzolate bromide, was given by intraperitoneal injection of 10 mg/kg in saline an hour prior to IRI.32–34 LPS (E.coli serotype O111:B4) was given by intraperitoneal injection of 25 mg/kg in saline. Cisplatin was given by intraperitoneal injection of 25 mg/kg as previously described.35 Unless otherwise stated, blood and kidneys were collected 24 h after the AKI model.
Mass spectrometry measurements
All measurements were performed in a blinded fashion by an independent facility. Creatinine was analyzed by LC/MS-MS at the University of Alabama Birmingham O’Brien Core Center for Acute Kidney Injury Research (NIH P30-DK079337). This method adds the accuracy of MS to the LC method of creatinine measurement endorsed by a renal investigative consortium (diacomp.org). The coefficient of variation was 6% indicating high assay precision.
For metabolomics measurements, snap frozen kidneys were cut to equal weights (20 mg/specimen) and mechanically homogenized into 4 volumes of ice-cold water. Metabolites were assayed as previously described.36 In brief, amino acids, amines, acylcarnitines, nucleotides, and other cationic polar metabolites were measured in 10 μl of kidney homogenate using hydrophilic interaction liquid chromatography coupled with nontargeted, positive ion mode MS analysis on an Exactive Plus Orbitrap MS (Thermo Scientific). Polar and non-polar lipids were measured in 10 μl of kidney homogenate using C8 chromatography and nontargeted, positive ion mode MS analysis on a Q Exactive MS (Thermo Scientific). Identification of known metabolites was achieved by matching retention times and mass-to-charge ratio (m/z) to synthetic mixtures of reference compounds and characterized pooled plasma reference samples. Results were analyzed in MetaboAnalyst (www.metaboanalyst.ca).
LC-MS assays were developed for multiplex quantification of Nam, NAD, and β-hydroxybutyrate (β-OHB) from cellular experiments. NAD measurements reflect total NAD+ plus NADH. Briefly, conditioned medium was extracted with methanol (80% methanol final concentration) spiked with isotopic standards for Nam and β-OHB (CDN Isotopes, Inc.). Precipitated proteins were removed by centrifugation, and supernatants were analyzed directly. For analysis of cell lysates, cells were washed with ice-cold PBS, scraped and lysed on dry ice into methanol containing isotopic standards. After extraction, cell and media supernatants were analyzed by LC-MS/MS using reverse-phase chromatography (NAM and NAD/NADH) or hydrophilic interaction chromatography (β-OHB) coupled to tandem mass spectrometry using an API 5000 triple quadruple mass spectrometer. Analytes were quantified by multiple reaction monitoring using the following m/z transitions: β-OHB 103.1>59, β-OHB IS 105.1>60, NAM 123.3>80.2, NAM IS 127.3>84.2, NAD/NADH 664.2>542.0. Eluting peaks were quantified by area under the curve (AUC).
Raw AUC values were divided by the mean value of the control group for each experiment, thus the results are presented as relative concentrations to the control group. All assays were performed in triplicate and replicate measurements demonstrated a CV < 5%.
RNASEQ sequencing and identification of differentially expressed transcripts
PolyA-enriched RNA was isolated from whole kidneys and checked for quality by denaturing agarose gel as well as Aglient Bioanalyzer. Sequencing libraries were generated from the double-stranded cDNA using the Illumina TruSeq kit according to the manufacturer’s protocol. Library quality control was checked using the Agilent DNA High Sensitivity Chip and qRT-PCR. High quality libraries were sequenced on an Illumina HiSeq 2000. To achieve comprehensive coverage for each sample, we generated ~25–30 million single end reads. Raw results were passed through quality controls steps and aligned to the mouse genome. Gene expression measurement was performed from aligned reads by counting the unique reads. The read count based gene expression data was normalized on the basis of library complexity and gene variation. The normalized count data was compared among groups using a negative binomial model to identify differentially expressed genes. The differentially expressed genes were identified on the basis of raw P value and fold change. Genes were considered significantly differentially expressed if the multiple test corrected p-value was < 0.05 and absolute fold change > 2.
Functional enrichment analysis
Ingenuity Pathway Analysis (IPA 8.0, Qiagen) was used to identify the functions that are significantly affected by significantly differentially expressed genes from different comparisons. The knowledge base of this software consists of functions, pathways, and network models derived by systematically exploring the peer reviewed scientific literature. A detailed description of IPA analysis is available at the Ingenuity Systems’ web site (http//www.ingenuity.com). A p-value is calculated for each function according to the fit of the users’ data to the IPA database using one-tailed Fisher exact test. The functions with multiple test corrected p-values < 0.01 were considered significantly affected.
Western analysis
Kidney lysate preparation, gel electrophoresis, transfer, immunoblotting, detection, and image acquisition were performed as previously described.30 Antibodies against PGC1α (Cayman Chemical), cytochrome c oxidase subunit IV (Cell Signaling Technology), and Transcription Factor A Mitochondrial, TFAM (Abcam) were used as previously described. 30,37
Quantitative PCR
Total RNA extraction and cDNA synthesis were performed as previously described.30 PCR reactions were performed in duplicate using the ABI 7500 Fast Real-Time PCR and TaqMan gene expression assays (Applied Biosystems). The following TaqMan gene probes were used: Ppargc1a, Ndufs1, Cycs, Atp5o, Nrf1, Tfam, Vegfa, Nos1, Nos3, Hcar2. Of the four known Ppargc1a transcripts (1–4), Ppargc1a1 (Taqman Mm00447183_m1) was studied in all gene expression analyses.38 Mouse Ido2, Afmid, Kynu, Kmo, Haao, Qprt, Naprt, and Nmnat1 for SYBR Green PCR have been described elsewhere.39,40 Mouse Nampt SYBR primers were designed using PrimerQuest Tool (Integrated DNA Technologies). Relative expression levels were determined using the comparative threshold method.
Mitochondrial DNA copy number analysis
Total DNA was extracted from mouse kidneys using the DNeasy Blood and Tissue Kit (Qiagen) with on-column RNase digestion per manufacturer’s instructions. Gene expression of mitochondrial-encoded NADH dehydrogenase 1 (mt-Nd1) relative to nuclear 18S rRNA was used to determine mitochondrial DNA copy number as previously described.41
Histopathology
Formalin-fixed, paraffin-embedded blocks were sectioned and stained with H & E, PAS, and Masson trichrome. Ten random high-power fields in the cortex and ten random high-power fields in the outer stripe of the outer medulla were viewed and graded for tubular necrosis—defined as the loss of the proximal tubular brush border, blebbing of apical membranes, tubular necrosis/apoptosis and epithelial cell detachment from _the basement membrane or intraluminal aggregation of necrotic debris. Each high-power field was separately scored on a scale (0 = no necrosis, 1= rare single necrotic cells, 2= frequent single necrotic cells, 3 = groups of necrotic cells, and 4 = confluent tubular necrosis) and the average score was compiled for each specimen and then used for between-group comparisons. All scoring was performed by a single operator blinded to genotype and experimental model (IES).
In situ COX enzyme chemistry
Enzyme histochemistry to detect cytochrome c oxidase (COX) activity was performed on 6 μm snap-frozen sagittal sections as previously described.30 Functional electron microscopy used in the cisplatin kidney injury model was described earlier.35
Electron microscopy
The complete method is previously described.30 Briefly, kidneys were fixed with 1.25% glutaraldehyde in 0.1 M cacodylate buffer (pH 7.4) and cut in 1 μm section in both sagittal and transverse planes for image analysis. After drying the sections, slides were stained at 65°C for 20 minutes in 0.1% Toluidine blue in 1% sodium borate, cooled to room temperature, washed in distilled water, cleaned in xylene, and mounted in Permount sections for light microscopy. Subsequent ultrathin sections (0.5 μm) were examined by transmission electron microscopy (JEOL 1011, JEOL Corp.) with Orca-HR Digital Camera (Hamamatsu Corp.), and Advanced Microscopy Technique Corporation image capture system.
Oil-Red-O staining
Oil-Red-O solution was prepared by dissolving 0.5 g Oil-Red-O (Poly Scientific) in 100 ml isopropanol. Frozen sections were cut to 5 μm and natively stained in Oil-Red-O solution for 20 minutes at room temperature, then rinsed in running tap water for 2 min. Hematoxylin counter-staining was performed without differentiation in HCl-ethanol and sections were rinsed with water, then mounted with VectaMount AQ Aqueous Mounting medium (Vector Labs).
Human biopsy series
All studies were approved by the Institutional Review Board at BIDMC. Control specimens came from normal tissue sections of nephrectomies. CKD diagnoses included focal segmental glomerulosclerosis, chronic allograft nephropathy, chronic interstitial nephritis, and chronic IgA nephropathy. AKI diagnoses included acute ischemic injury, post-transplant delayed graft function attributable to ischemia-reperfusion injury, and acute interstitial nephritis. PGC1α antibody (Abcam ab54481) was used at a dilution of 1:100 and developed with horseradish peroxidase (ImmPRESS polymer staining kit, Vector Labs). The peptide immunogen SKYDSLDFDSLLKEAQRSLRR (synthesized by the Biopolymers Lab, Koch Institute at MIT) was pre-incubated in 100-fold excess of the PGC1α antibody to confirm antibody specificity in human IHC studies. Ten randomly selected high-powered fields were viewed per specimen, with each field scored on a 4-point scale (1 = weakest, 4 = strongest) based on the intensity of staining, specifically in non-necrotic areas and unscarred areas and avoiding obvious collecting ducts. The average score of each specimen was then used for between-group comparisons. All scoring was performed by a single operator blinded to the underlying diagnosis (IES).
Microultrasound
The full method is previously described.30 Briefly, mice were lightly anesthetized, secured to a heat-controlled stage, and continuously monitored for respiration, ECG, and core temperature. A high frequency, high resolution digital imaging platform with linear array technology and equipped with a high-frequency linear array probe MS550D (22–55 MHz) was used throughout the study (Vevo 2100 Visual Sonics). The flow volume was modeled as a circular cylinder of length equal to the average velocity time integral and diameter measured empirically (n = 3 cardiac cycles), then multiplied by the heart rate (bpm), then converted from mm3/min to ml/min. All measurements and analyses were performed by a single blinded operator (EVK).
Cellular studies
Mouse intermedullary collecting duct (IMCD3) cells were obtained from ATCC. Please refer to their website for validation and mycoplasma testing. Cells were transfected with siRNA targeting mouse PGC1α, HCAR2 or a negative control siRNA (Qiagen) for 24 h. Niacin, mepenzolate bromide, β-hydroxybutyrate, the NAMPT inhibitor FK866,42 and niacinamide were diluted to the indicated concentrations in serum- free cell culture medium. Prostaglandin E2 (PGE2) was measured in the conditioned media 24–72 hours after treatment.
Cystatin C
Cystatin C in mouse serum (1:200 dilution) was measured by ELISA (R&D Systems).
FITC-inulin clearance
The full method is described elsewhere.43 Briefly, male C57BL/6J mice (Jackson Laboratories) were given a single bolus injection of 5%-FITC- inulin (3.74 μl/g body weight). Clearance kinetics of FITC-inulin post-injection was measured by serial blood collection at specified time points from 3 through 70 minutes post-injection. Blood samples were centrifuged and resulting plasma was buffered to pH 7.4 with 500 mM HEPES. Fluorescence in the buffered plasma samples was determined with 485 nm excitation, 538 nm emission. Glomerular filtration rate (GFR) was calculated from the two phase exponential decay model outlined previously.
Tissue PGE2 β-OHB, and NAD measurements
PGE2 was measured in mouse kidney tissue by ELISA (Cayman Chemical). β-OHB (Cayman Chemical) and total NAD (BioVision) was measured in mouse kidney tissue by colorimetric assays. These assays were performed on kidneys used for metabolomics and lipidomics in order to compare coordinated changes in metabolism and downstream signaling. NAD measurements reflect total NAD+ plus NADH.
Statistical Analysis
Comparisons between continuous characteristics of subject groups were analyzed with Mann-Whitney U tests or Student’s t test. Survival was analyzed by log-rank test. For comparisons among more than two groups, ANOVA with Bonferroni correction was used where indicated. Associations between microultrasound measurements and other functional parameters were analyzed with Spearman’s rank correlation coefficients. Sample size determination was guided by power calculations and prior experience. The following sample calculation was used to guide creatinine studies in mice: serum creatinine of 1.6 (± 0.3 SD) mg/dl vs. 1.0 (± 0.2 SD) requires n = 5 mice per condition to achieve an α-error < 5% and power 96%. Mice were randomized to experimental intervention vs. control. Two-tailed p-values < 0.05 were considered significant. Results are presented as mean ± SEM and were prepared in GraphPad Prism.
Extended Data
Extended Data Fig 1. Regulation of PGC1α and other features of post-ischemic kidneys.
a, Serum creatinine 24 h after sham or IRI (n=5 vs. 14 mice), ***p< 0.001. b, Absence of classwide changes in intrarenal phospholipids 24 h after IRI vs. sham operation (n=6/group, NS=non-significant). Each bar represents one lipid species. P-value by two-way ANOVA. c, Renal PGC1α expression 24 h after sham or IRI (n = 5 animals per group), **p<0.01. d, Correlation of LC-MS method for serum creatinine and serum cystatin C (measured by ELISA). e, Glomerular filtration rate in controls or 24 h after IRI was determined by two-phase exponential decay curves of fluorescently-labeled inulin as described in methods (n=5/group), *p<0.05. f, Correlation of LC-MS method for serum creatinine with clearance of FITC-inulin. Curve fit according to formula sCr=κ/GFR where κ is a constant. Error bars SEM.
Extended Data Fig 2. Exacerbation of fat accumulation and tubular injury in post-ischemic PGC1α−/− kidneys.
a–d, Low (a,b) and high-power (c,d) photomicrographs 24 h after IRI in WT vs. PGC1α−/− (KO) mice. Scale bars 100 and 50 μm. e,f, Blinded scoring of tubular injury in cortex and outer stripe of outer medulla (OSOM) on 4-point injury scale as described in Methods (n=8 WT vs.12 KO mice), *p<0.05. g, Di-/tri-acylglycerols (DAGs, TAGs) in renal homogenates of KO mice at baseline and 24 h after injury (n=6/group). Each bar represents one lipid species. P-value by two-way ANOVA. Error bars SEM.
Extended Data Fig 3. Niacinamide (Nam) reduction from IRI and PGC1α deficiency.
a, Heatmaps (red=higher, green=lower) of Bonferroni-corrected significantly different metabolites in sham vs. IRI kidneys and WT vs. KO kidneys. Metabolites listed in purple are shared between settings. b, Total ion chromatogram of polar, positive ion mode method for representative WT-IRI sample, with niacinamide (Nam) peak at retention time = 3.88 minutes. Inset shows representative niacinamide peaks for kidney extracts from WT control (Ctrl) and WT-IRI (IRI) mice. c–e, Relative renal Nam abundance in kidneys of KO mice vs. WT littermates; WT littermates at baseline and 24 h after IRI; and KO mice at baseline and 24 h after IRI (n=6/group). f, Relative renal Nam concentrations in kidneys of mice following vehicle (Veh) vs. Nam treatment (400 mg/kg IP × 4d) with and without IRI 24 h prior to tissue collection (n=6/group). P-values by two-way ANOVA. g,h, Oil Red O stain (pink) for fat accumulation 24 h after IRI with or without Nam pretreatment (400 mg/kg IP × 4 d), scale bar 20 μm. Error bars SEM, *p<0.05, **p<0.01, ***p<0.001.
Extended Data Fig 4. Increased mitochondrial abundance and post-ischemic protection in renal tubular epithelial transgenic mice (iNephPGC1α).
a, Schematic for generating iNephPGC1α mice. b, Relative renal PGC1α expression in controls vs. iNephPGC1α mice with and without 4 weeks of doxycycline in drinking water (n = 5/group, **p<0.01 vs. all other groups). c, Ratio of kidney weight to total body weight (note body weights statistically indistinguishable as well, n=4/group). d, Example gross images with 1 cm scale of control vs. iNephPGC1α kidney. e, Renal mitochondrial DNA (mtDNA) copy number as described in Methods. f, Relative renal gene expression of PGC1α targets (Ndufs1, Cycs, Atp5o), partnering transcription factors (Nrf1), and the mitochondrial transcription factor, TFAM. Results analyzed by two-way ANOVA with p-value for genotype as noted. N=8/group. *p<0.05 vs. control after Bonferroni correction. g, Western analysis of kidney lysates for Transcription Factor A, Mitochondrial (TFAM)37 and loading control. h,i, Transmission EM of mitochondria sectioned perpendicular and parallel to long axis demonstrating normal morphology in iNephPGC1α mice (representative of n=4/group), scale bar 500 nm. j,k, Blinded scoring of tubular injury in cortex and outer stripe of outer medulla (n=8 control; 12 iNephPGC1α). Error bars SEM, *p<0.05, **p<0.01.
Extended Data Fig 5. Renal protection in systemic inflammation conferred by renal tubular epithelial, but not endothelial, PGC1α.
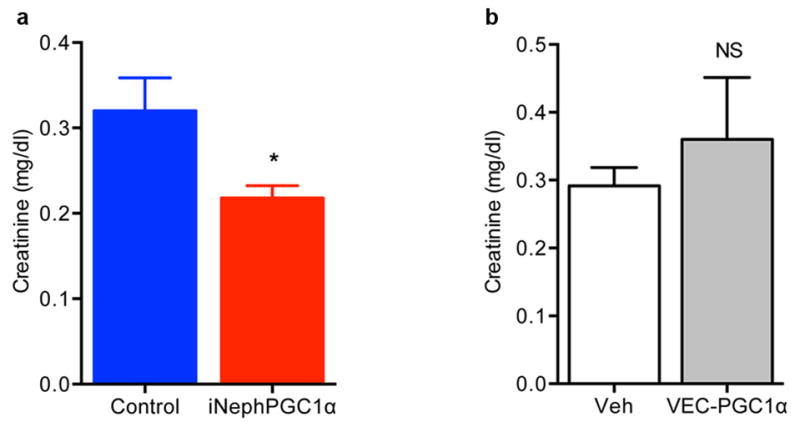
a, Serum creatinine 24 h after bacterial endotoxin injection (LPS O111:B4), n=9/group. b, Serum creatinine 24 h after bacterial endotoxin (LPS O111:B4) in endothelial-specific (VEC=VE-cadherin) PGC1α transgenic mice (VEC-tTA x TRE-PGC1α), n=5/group. Error bars SEM, *p < 0.05.
Extended Data Fig 6. PGC1α-dependent de novo NAD biosynthesis and NAD-dependent accumulation of β-OHB and PGE2.
a, Gene expression for de novo NAD biosynthetic pathway in renal tubular cells 48 h after control vs. PGC1α knockdown (n=3/group). The gene expression set corresponds to the eight transcripts whose abundance was measured in kidney homogenates in Figure 3. P=0.0001 by two-way ANOVA with Bonferroni-corrected comparisons as indicated. b, Correlation of renal Nam vs. renal NAD in mice treated with vehicle or different doses of Nam (100–400 mg/kg IP × 1). Arbitrary units on X- and Y-axes. c, Renal β-OHB concentrations in kidneys of mice following vehicle (Veh) vs. Nam treatment (400 mg/kg IP × 4 d) with and without IRI 24 h prior to tissue collection (n=5/group). P-value by two-way ANOVA. Dashed line indicates normal circulating concentration of β-OHB. d, Dosing for siRNA against HCAR2 in renal tubular cells. e, Dose-inhibition curve in renal tubular cells for PGE2 release following 24 h of mepenzolate bromide at the indicated concentrations (n=3 replicates per concentration).32–34 f,g Intracellular Nam and secreted β-OHB for renal tubular cells following treatment with Nam (1 μM for 24 h) with or without pre-treatment with the NAMPT inhibitor FK866 (10 nM, n=6/group). h, PGE2 in conditioned media of renal tubular cells after control vs. PGC1α knockdown and with and without exogenous β-OHB application (+, 5 mM, n=6/group, p values vs. control group). Error bars SEM, *p<0.05, **p<0.01, ***p<0.001, and ****p<0.0001.
Extended Data Fig 7. Effects of PGC1α on renal metabolites and features of cisplatin nephrotoxicity.
a–c, Relative renal NAD, β-OHB, and PGE2 concentrations in WT littermates vs. PGC1α−/− (KO) mice (n=6/group). d, Serum creatinine in genetic control mice for iNephPGC1α 24 h after IRI with vehicle vs. mepenzolate (MPN, 10 mg/kg IP) treatment (n=5/group). e, Serum creatinine in genetic control mice for iNephPGC1α 24 h after IRI with vehicle vs. indomethacin (INDO, 10 mg/kg IP) treatment (n=6/group). f, Transmission EM with cytochrome c oxidase enzyme histochemistry of proximal tubular cell 24 h following cisplatin exposure (25 mg/kg IP) demonstrating mitochondrial injury. Scale bar 500 nm. g, Relative renal Nam concentrations following cisplatin as in f. Error bars SEM, *p<0.05, **p<0.01, ***p<0.001.
Extended Data Fig 8. Renal immunostaining for PGC1α declines in human chronic kidney disease.
a–d, Low (a,b) and high-power (c,d) photomicrographs of PGC1α immunoreactivity (brown) in wildtype littermates (WT) and PGC1α−/− (KO) kidneys. Scale bars 100 and 50 μm. e,f Representative results of peptide competition attenuating PGC1α immunoreactivity against human kidney (n=4) as described in Methods. g, Representative immunostaining (brown) for PGC1α in a renal biopsy with chronic kidney disease (CKD). Scale bar 50 μm. h, Results of scoring PGC1α immunostaining intensity (1=weakest, 4=strongest) in specimens with CKD by blinded operator. Each dot represents a unique specimen. Analyzed by Mann-Whitney.
Extended Data Fig 9. Evidence for renal-tubular-epithelial-PGC1α-dependent reversible vascular relaxation.
a, Serum creatinine in uninduced (−Dox) vs. induced (+Dox) iNephPGC1α mice (n = 8–10 mice per group). b, Comparison of serum creatinine with degree of renal PGC1α expression, p<0.05. c,d Serial serum creatinines in iNephPGC1α mice vs. controls before PGC1α induction (OFF), after 4 weeks of PGC1α induction (ON), and after 4 weeks of washout (OFF), *p<0.05 by repeated measures ANOVA. e–g, Comparison of serum creatinine at different time points with renal artery flow in iNephPGC1α mice from d, p<0.05 when correlation coefficient r = −0.65. h–j, Comparison of resistive index with renal artery flow volume in iNephPGC1α mice from d, p<0.05 when correlation coefficient r = −0.80. k, Relative renal expression of VEGF and nitric oxide synthases 1 and 3 (n=6/group). Analyzed by two-way ANOVA with Bonferroni corrections. l, Circulating thyroxine levels in iNephPGC1α mice with and without gene induction (n=5/group) to rule out Pax8-related thyrotoxicosis driving perfusion differences as previously described.44 m, Relative renal expression for VEGF in PGC1α−/− mice (KO) vs. WT littermates (n=6/group). Error bars SEM.
Extended Data Fig 10.
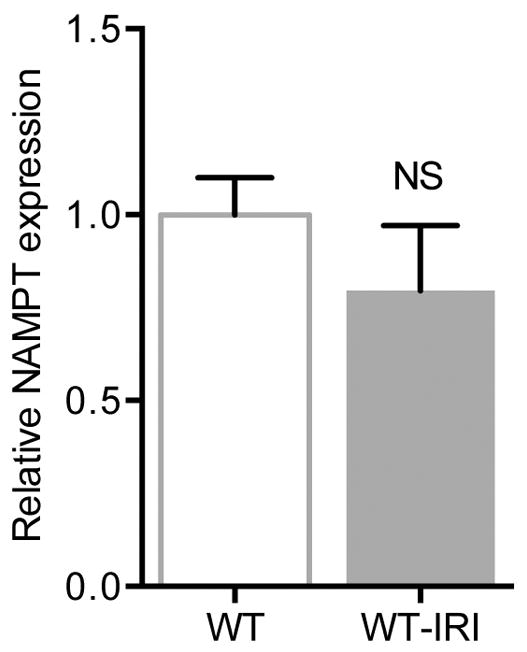
Relative renal expression for NAMPT in wildtype mice before and 24 h after IRI (n=6/group). Error bars SEM.
Supplementary Material
Acknowledgments
The authors thank Mark Zeidel (Harvard Medical School BIDMC) for advice; Zolt Arany (University of Pennsylvania) for the VE-cadherin-tTA x TRE-PGC1α mice; Anupam Agarwal (University of Alabama NIH P30-DK079337) for LC-MS measurements of serum creatinine; Anthony Hollenberg (Harvard Medical School, BIDMC) for thyroxine measurements; and Pal Pacher (NIH) for cisplatin-treated kidneys for microscopy. This work was supported by R01-DK095072 and philanthropic funds to SMP; K08-DK090142 and a grant from Satellite Healthcare to EPR; and K08-DK101560 to EVK.
Footnotes
Supplementary Information is linked to the online version of the paper at www.nature.com/nature.
AUTHOR CONTRIBUTIONS
MTT designed experiments, performed the breeding, genotyping, renal injury models, cellular studies, analyzed data, and wrote the manuscript. ZKZ and IES performed and analyzed histopathology, enzyme histochemistry, electron microscopy, and the human biopsy immunohistochemistry studies. AHB created LC-MS assays, measured metabolites for cellular experiments, and analyzed metabolic results. EVK and SAK performed microultrasounds and analyzed flow results. MKB analyzed raw RNA sequencing data. WK, CBC, and EPR performed metabolomics, follow-up metabolite measurements, and in vivo experiments with cisplatin and Nam. SMP designed the experiments, analyzed results, and wrote the manuscript with input from all authors.
The authors declare no competing financial interests.
References
- 1.Thadhani R, Pascual M, Bonventre JV. Acute renal failure. N Engl J Med. 1996;334:1448–60. doi: 10.1056/NEJM199605303342207. [DOI] [PubMed] [Google Scholar]
- 2.Lewington AJ, Cerda J, Mehta RL. Raising awareness of acute kidney injury: a global perspective of a silent killer. Kidney Int. 2013;84:457–67. doi: 10.1038/ki.2013.153. [DOI] [PMC free article] [PubMed] [Google Scholar]
- 3.Puigserver P, Wu Z, Park CW, Graves R, Wright M, Spiegelman BM. A cold- inducible coactivator of nuclear receptors linked to adaptive thermogenesis. Cell. 1998;92:829–39. doi: 10.1016/s0092-8674(00)81410-5. [DOI] [PubMed] [Google Scholar]
- 4.Ruas JL, White JP, Rao RR, et al. A PGC-1alpha isoform induced by resistance training regulates skeletal muscle hypertrophy. Cell. 2012;151:1319–31. doi: 10.1016/j.cell.2012.10.050. [DOI] [PMC free article] [PubMed] [Google Scholar]
- 5.Hanson J, Gille A, Zwykiel S, et al. Nicotinic acid- and monomethyl fumarate- induced flushing involves GPR109A expressed by keratinocytes and COX-2-dependent prostanoid formation in mice. J Clin Invest. 2010;120:2910–9. doi: 10.1172/JCI42273. [DOI] [PMC free article] [PubMed] [Google Scholar]
- 6.Pagliarini DJ, Calvo SE, Chang B, et al. A mitochondrial protein compendium elucidates complex I disease biology. Cell. 2008;134:112–23. doi: 10.1016/j.cell.2008.06.016. [DOI] [PMC free article] [PubMed] [Google Scholar]
- 7.Weidemann MJ, Krebs HA. The fuel of respiration of rat kidney cortex. Biochem J. 1969;112:149–66. doi: 10.1042/bj1120149. [DOI] [PMC free article] [PubMed] [Google Scholar]
- 8.Collins PB, Chaykin S. The management of nicotinamide and nicotinic acid in the mouse. J Biol Chem. 1972;247:778–83. [PubMed] [Google Scholar]
- 9.Traykova-Brauch M, Schonig K, Greiner O, et al. An efficient and versatile system for acute and chronic modulation of renal tubular function in transgenic mice. Nat Med. 2008;14:979–84. doi: 10.1038/nm.1865. [DOI] [PMC free article] [PubMed] [Google Scholar]
- 10.Revollo JR, Grimm AA, Imai S. The NAD biosynthesis pathway mediated by nicotinamide phosphoribosyltransferase regulates Sir2 activity in mammalian cells. J Biol Chem. 2004;279:50754–63. doi: 10.1074/jbc.M408388200. [DOI] [PubMed] [Google Scholar]
- 11.Tran M, Tam D, Bardia A, et al. PGC-1alpha promotes recovery after acute kidney injury during systemic inflammation in mice. J Clin Invest. 2011;121:4003–14. doi: 10.1172/JCI58662. [DOI] [PMC free article] [PubMed] [Google Scholar]
- 12.Bai P, Canto C, Oudart H, et al. PARP-1 inhibition increases mitochondrial metabolism through SIRT1 activation. Cell Metab. 2011;13:461–8. doi: 10.1016/j.cmet.2011.03.004. [DOI] [PMC free article] [PubMed] [Google Scholar]
- 13.Gomes AP, Price NL, Ling AJ, et al. Declining NAD(+) induces a pseudohypoxic state disrupting nuclear-mitochondrial communication during aging. Cell. 2013;155:1624–38. doi: 10.1016/j.cell.2013.11.037. [DOI] [PMC free article] [PubMed] [Google Scholar]
- 14.Garcia Soriano F, Virag L, Jagtap P, et al. Diabetic endothelial dysfunction: the role of poly(ADP-ribose) polymerase activation. Nat Med. 2001;7:108–13. doi: 10.1038/83241. [DOI] [PubMed] [Google Scholar]
- 15.Vafai SB, Mootha VK. Mitochondrial disorders as windows into an ancient organelle. Nature. 2012;491:374–83. doi: 10.1038/nature11707. [DOI] [PubMed] [Google Scholar]
- 16.Jesinkey SR, Funk JA, Stallons LJ, et al. Formoterol restores mitochondrial and renal function after ischemia-reperfusion injury. J Am Soc Nephrol. 2014;25:1157–62. doi: 10.1681/ASN.2013090952. [DOI] [PMC free article] [PubMed] [Google Scholar]
- 17.Arany Z, Foo SY, Ma Y, et al. HIF-independent regulation of VEGF and angiogenesis by the transcriptional coactivator PGC-1alpha. Nature. 2008;451:1008–12. doi: 10.1038/nature06613. [DOI] [PubMed] [Google Scholar]
- 18.Bostrom P, Wu J, Jedrychowski MP, et al. A PGC1-alpha-dependent myokine that drives brown-fat-like development of white fat and thermogenesis. Nature. 2012;481:463–8. doi: 10.1038/nature10777. [DOI] [PMC free article] [PubMed] [Google Scholar]
- 19.Agudelo LZ, Femenia T, Orhan F, et al. Skeletal muscle PGC-1alpha1 modulates kynurenine metabolism and mediates resilience to stress-induced depression. Cell. 2014;159:33–45. doi: 10.1016/j.cell.2014.07.051. [DOI] [PubMed] [Google Scholar]
- 20.Breyer MD, Jacobson HR, Breyer RM. Functional and molecular aspects of renal prostaglandin receptors. J Am Soc Nephrol. 1996;7:8–17. doi: 10.1681/ASN.V718. [DOI] [PubMed] [Google Scholar]
- 21.Papanicolaou N, Callard P, Bariety J, Milliez P. The effect of indomethacin and prostaglandin (PGE2) on renal failure due to glycerol in saline-loaded rats. Clinical science and molecular medicine. 1975;49:507–10. doi: 10.1042/cs0490507. [DOI] [PubMed] [Google Scholar]
- 22.Mauk RH, Patak RV, Fadem SZ, Lifschitz MD, Stein JH. Effect of prostaglandin E administration in a nephrotoxic and a vasoconstrictor model of acute renal failure. Kidney Int. 1977;12:122–30. doi: 10.1038/ki.1977.89. [DOI] [PubMed] [Google Scholar]
- 23.Sketch MH, Jr, Whelton A, Schollmayer E, et al. Prevention of contrast media-induced renal dysfunction with prostaglandin E1: a randomized, double-blind, placebo-controlled study. American journal of therapeutics. 2001;8:155–62. doi: 10.1097/00045391-200105000-00004. [DOI] [PubMed] [Google Scholar]
- 24.Feldkamp T, Kribben A, Roeser NF, et al. Preservation of complex I function during hypoxia-reoxygenation-induced mitochondrial injury in proximal tubules. Am J Physiol Renal Physiol. 2004;286:F749–59. doi: 10.1152/ajprenal.00276.2003. [DOI] [PubMed] [Google Scholar]
- 25.Morigi M, Perico L, Rota C, et al. Sirtuin 3-dependent mitochondrial dynamic improvements protect against acute kidney injury. J Clin Invest. 2015;125:715–26. doi: 10.1172/JCI77632. [DOI] [PMC free article] [PubMed] [Google Scholar]
- 26.Ebrahimkhani MR, Daneshmand A, Mazumder A, et al. Aag-initiated base excision repair promotes ischemia reperfusion injury in liver, brain, and kidney. Proc Natl Acad Sci U S A. 2014;111:E4878–86. doi: 10.1073/pnas.1413582111. [DOI] [PMC free article] [PubMed] [Google Scholar]
- 27.Rajakumar SV, Lu B, Crikis S, et al. Deficiency or inhibition of CD73 protects in mild kidney ischemia-reperfusion injury. Transplantation. 2010;90:1260–4. doi: 10.1097/TP.0b013e3182003d9b. [DOI] [PMC free article] [PubMed] [Google Scholar]
- 28.Wang G, Han T, Nijhawan D, et al. P7C3 neuroprotective chemicals function by activating the rate-limiting enzyme in NAD salvage. Cell. 2014;158:1324–34. doi: 10.1016/j.cell.2014.07.040. [DOI] [PMC free article] [PubMed] [Google Scholar]
- 29.Kraus D, Yang Q, Kong D, et al. Nicotinamide N-methyltransferase knockdown protects against diet-induced obesity. Nature. 2014;508:258–62. doi: 10.1038/nature13198. [DOI] [PMC free article] [PubMed] [Google Scholar]
- 30.Tran M, et al. PGC-1alpha promotes recovery after acute kidney injury during systemic inflammation in mice. J Clin Invest. 2011;121:4003–4014. doi: 10.1172/JCI58662. [DOI] [PMC free article] [PubMed] [Google Scholar]
- 31.Traykova-Brauch M, et al. An efficient and versatile system for acute and chronic modulation of renal tubular function in transgenic mice. Nat Med. 2008;14:979–984. doi: 10.1038/nm.1865. [DOI] [PMC free article] [PubMed] [Google Scholar]
- 32.Rask-Andersen M, Almen MS, Schioth HB. Trends in the exploitation of novel drug targets. Nature reviews Drug discovery. 2011;10:579–590. doi: 10.1038/nrd3478. [DOI] [PubMed] [Google Scholar]
- 33.Singh V, et al. Mycobacterium tuberculosis-driven targeted recalibration of macrophage lipid homeostasis promotes the foamy phenotype. Cell host & microbe. 2012;12:669–681. doi: 10.1016/j.chom.2012.09.012. [DOI] [PubMed] [Google Scholar]
- 34.Feingold KR, Moser A, Shigenaga JK, Grunfeld C. Inflammation stimulates niacin receptor (GPR109A/HCA2) expression in adipose tissue and macrophages. J Lipid Res. 2014;55:2501–2508. doi: 10.1194/jlr.M050955. [DOI] [PMC free article] [PubMed] [Google Scholar]
- 35.Zsengeller ZK, et al. Cisplatin nephrotoxicity involves mitochondrial injury with impaired tubular mitochondrial enzyme activity. J Histochem Cytochem. 2012;60:521–529. doi: 10.1369/0022155412446227. [DOI] [PMC free article] [PubMed] [Google Scholar]
- 36.Rhee EP, et al. A genome-wide association study of the human metabolome in a community-based cohort. Cell Metab. 2013;18:130–143. doi: 10.1016/j.cmet.2013.06.013. [DOI] [PMC free article] [PubMed] [Google Scholar]
- 37.Kang C, Ji LL. Muscle immobilization and remobilization downregulates PGC-1alpha signaling and the mitochondrial biogenesis pathway. J Appl Physiol (1985) 2013;115:1618–1625. doi: 10.1152/japplphysiol.01354.2012. [DOI] [PubMed] [Google Scholar]
- 38.Ruas JL, et al. A PGC-1alpha isoform induced by resistance training regulates skeletal muscle hypertrophy. Cell. 2012;151:1319–1331. doi: 10.1016/j.cell.2012.10.050. [DOI] [PMC free article] [PubMed] [Google Scholar]
- 39.Nakahata Y, Sahar S, Astarita G, Kaluzova M, Sassone-Corsi P. Circadian control of the NAD+ salvage pathway by CLOCK-SIRT1. Science. 2009;324:654–657. doi: 10.1126/science.1170803. [DOI] [PMC free article] [PubMed] [Google Scholar]
- 40.Agudelo LZ, et al. Skeletal muscle PGC-1alpha1 modulates kynurenine metabolism and mediates resilience to stress-induced depression. Cell. 2014;159:33–45. doi: 10.1016/j.cell.2014.07.051. [DOI] [PubMed] [Google Scholar]
- 41.Liu L, et al. Nutrient sensing by the mitochondrial transcription machinery dictates oxidative phosphorylation. J Clin Invest. 2014;124:768–784. doi: 10.1172/JCI69413. [DOI] [PMC free article] [PubMed] [Google Scholar]
- 42.Hasmann M, Schemainda I. FK866, a highly specific noncompetitive inhibitor of nicotinamide phosphoribosyltransferase, represents a novel mechanism for induction of tumor cell apoptosis. Cancer research. 2003;63:7436–7442. [PubMed] [Google Scholar]
- 43.Qi Z, et al. Serial determination of glomerular filtration rate in conscious mice using FITC-inulin clearance. Am J Physiol Renal Physiol. 2004;286:F590–596. doi: 10.1152/ajprenal.00324.2003. [DOI] [PubMed] [Google Scholar]
- 44.Antonica F, et al. Generation of functional thyroid from embryonic stem cells. Nature. 2012;491:66–71. doi: 10.1038/nature11525. [DOI] [PMC free article] [PubMed] [Google Scholar]
Associated Data
This section collects any data citations, data availability statements, or supplementary materials included in this article.


