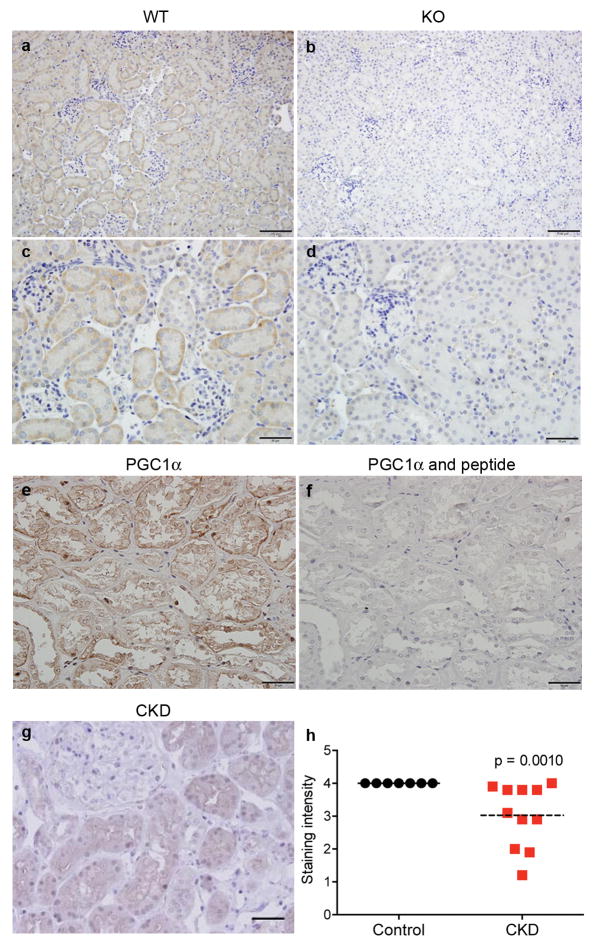
Extended Data Fig 8. Renal immunostaining for PGC1α declines in human chronic kidney disease.
a–d, Low (a,b) and high-power (c,d) photomicrographs of PGC1α immunoreactivity (brown) in wildtype littermates (WT) and PGC1α−/− (KO) kidneys. Scale bars 100 and 50 μm. e,f Representative results of peptide competition attenuating PGC1α immunoreactivity against human kidney (n=4) as described in Methods. g, Representative immunostaining (brown) for PGC1α in a renal biopsy with chronic kidney disease (CKD). Scale bar 50 μm. h, Results of scoring PGC1α immunostaining intensity (1=weakest, 4=strongest) in specimens with CKD by blinded operator. Each dot represents a unique specimen. Analyzed by Mann-Whitney.

