Abstract
Exhaled methane concentration measurements are extensively used in medical investigation of certain gastrointestinal conditions. However, the dynamics of endogenous methane release is largely unknown. Breath methane profiles during ergometer tests were measured by means of a photoacoustic spectroscopy based sensor. Five methane-producing volunteers (with exhaled methane level being at least 1 ppm higher than room air) were measured. The experimental protocol consisted of 5 min rest—15 min pedalling (at a workload of 75 W)—5 min rest. In addition, hemodynamic and respiratory parameters were determined and compared to the estimated alveolar methane concentration. The alveolar breath methane level decreased considerably, by a factor of 3–4 within 1.5 min, while the estimated ventilation-perfusion ratio increased by a factor of 2–3. Mean pre-exercise and exercise methane concentrations were 11.4 ppm (SD:7.3) and 2.8 ppm (SD:1.9), respectively. The changes can be described by the high sensitivity of exhaled methane to ventilationperfusion ratio and are in line with the Farhi equation.
Keywords: photoacoustic spectroscopy, Farhi equation, methane breath test, spirometer
1. Introduction
Methane (CH4) plays an important role in atmospheric chemistry, and it is the second principal anthropogenic greenhouse gas after carbon dioxide. Its average atmospheric concentration is currently about 1.8 ppm [1]. It is produced primarily by methanogens under anaerobic conditions in wetlands, farmlands, landfills, the gastrointestinal tract of mammals, and by non-microbial emissions from fossil fuel use and biomass burning. In addition, independent observations from various research fields have shown that plants, animals, and the marine environment produce methane under aerobic conditions [2].
Various studies demonstrated that blood-borne methane mainly originates from anaerobic fermentation in the intestine. Methane can then traverse the intestinal mucosa and be absorbed into the systemic circulation. Since it has a low solubility, it is rapidly excreted by the lungs. If the methane concentration of exhaled breath exceeds the ambient air level by 1 ppm, the subject is considered to be a methane producer [3]. Numerous studies have been conducted to estimate the ratio of producers. Approximately 30–60% of adults were found to be methane producers, based on the analysis of exhaled air [3]. Considering methane production gender, age, and ethnic differences were usually observed; [4–7] additionally a wide day-to-day (interday) variation was reported [8]. However, the factors influencing the number of methanogens and the amount of produced methane are still unexplored.
The methane breath test is increasingly used in the diagnostics of certain gastrointestinal conditions. In clinical practice, a combined hydrogen and methane breath test has been shown to be superior for the diagnosis of carbohydrate malabsorption syndromes and small intestinal bacterial overgrowth [3]. Additionally, numerous studies have found correlations between breath methane levels and diseases such as irritable bowel syndrome, large bowel cancer, and constipation [3, 9–11]. However, the results are controversial [9, 10] and the impact of endogenous bacterial methane generation is still not known with certainty. Moreover, the dynamics of endogenous methane elimination through the respiratory system has not been investigated yet and is therefore largely unknown.
Gas chromatography mass spectrometry (GC-MS) is widely used, and considered as the gold standard analytical technique in breath analysis, even though it does not allow continuous, real-time measurements. Direct mass-spectrometric techniques (for instance, selected ion flow tube (SIFT), proton transfer reaction mass spectrometry (PTR-MS and PTR-TOF-MS) and laser spectrometry) enable real-time quantitative breath gas analysis [12]. Recently in a pilot study, atmospheric and breath methane could be quantified by SIFT-MS [13]. The huge potential of PTR-MS in real-time measurements was verified in numerous studies [14–17]. King et al [14–16] reported dynamics of non-polar, low-soluble volatile organic compounds (VOCs) with simultaneous assessment of physiological factors affecting exhalation kinetics during ergometer tests. Nevertheless, the normal chemical ionization scheme of PTR-MS with H+ is selective to VOCs with proton affinities higher than water (166.5 kcal mol−1). Methane (with a proton affinity of 129.9 kcal mol−1) is detectable by PTR-MS only with O2+ as precursor as presented in a preliminary, non-quantitative measurement of methane during exercise on an ergometer [18].
Real-time atmospheric methane measurements have been performed recently using photoacoustic spectroscopy (PAS) based sensors [19, 20]. PAS is a special mode of optical absorption spectroscopy that is based on the conversion of absorbed light energy into acoustic waves. The amplitude of the generated sound is directly proportional to the concentration of the absorbing gas component. PAS provides high selectivity, sensitivity and linear response over 4–5 orders of magnitude. In addition, due to its robust design it is portable [21]. The present paper utilizes a PAS sensor to determine breath methane profiles during physical activity.
2. Materials and methods
2.1. Test subjects
Subjects were selected on the basis of a positive breath methane measurement. Volunteers (12 male, 10 female; age 16–57 years) were asked to exhale into a glass flask (volume of 200 cm3, the diameter of the opening was 1.74 cm) using a straw for approximately 1.5 min. Expired air was continuously transferred to the PAS system by means of a pump via a Teflon tube. 6 of 22 volunteers were found to be methane producers and they were asked to participate in the ergometer tests. In total, 5 subjects (3 male, 2 female; age 21–57 years) were involved in the ergometer tests. Participants were asked to refrain from food at least 12 h before the tests (overnight fast); only drinking of water was allowed. No test subject reported any prescribed medication or drug intake. All results are obtained in conformity with the Declaration of Helsinki and with the necessary approvals by the Ethics Commission of Innsbruck Medical University.
2.2. PAS setup
Methane concentrations were monitored by an in-house developed near-infrared laser based PAS sensor. The instrument has been described in detail elsewhere [22]. The emission source of the PAS system is a distributed feedback diode laser tuned to a methane absorption line around 1.65 µm. No measurable cross-sensitivity for common constituents of breath (water vapour, carbon dioxide, or carbon monoxide) was found at this wavelength. Calibration was performed with gas mixtures (range: 0.25–101 ppm) prepared from a cylinder of 101 ppm CH4 in synthetic air (certificated calibration gas from Messer Hungarogas, Hungary) and from humidified synthetic air. The minimum detectable concentration was calculated as the triple standard deviation (3σ) of the photoacoustic signal at zero CH4 concentration, divided by the sensitivity (i.e. the slope of the CH4 calibration curve). It was found to be 0.25 ppm with an integration time of 8 s.
2.3. Ergometer test
Exercise tests were conducted on a medical ergometer (Daum Electronic GmbH, Germany). The protocol started with a 5 min resting phase (sitting on the ergometer without workload). Then the participants were challenged to pedal for 15 min at constant speed (approximately 65 rpm) on the ergometer which was set up for a workload resistance of 75 W. The protocol ended with a 5 min resting phase (recovery). The gas sampling flow was approximately 70 ml min−1 and the time resolution was 4 s. The Teflon sampling tube of the PAS system was connected to a silicone head mask (Hans Rudolph, USA) by a metal Luer lock. The volume of the gas sampling tube was 18.8 cm3; hence it took the sample approximately 16 s to reach the measuring cell.
Additionally, tests were performed to study the effect of hypo- and hyperventilation on exhaled methane concentration in resting phase. A female subject (26 years) was sitting and altering her respiratory frequency resulting in increased and decreased alveolar ventilation. The test was repeated four times.
Heart rate and respiratory parameters (ventilation, O2, and CO2 concentrations) were measured by a spirometer (Metalyzer®3B, Biophysik GmbH, Germany). The data sampling interval was 15 s. Before each measurement the methane concentration of room air was determined, and this inhaled value was subtracted from measured exhaled methane values. In addition, a correction was used to take into account that mixed expired breath was measured.
2.4. Estimation of methane concentration in alveolar air
Although, methane concentration in mixed expired air (Cmixed) was measured, calculations were made to determine the methane concentration in alveolar air (CA) considering dead space ventilation () and the methane concentration of inhaled air (CI). From
| (1) |
follows
| (2) |
where is the alveolar ventilation. Since the blood-air partition coefficient (of methane) λb:air is very small (less than 0.1) CA (CI) ≈ CA (0) + CI, the following simplified expression was used:
| (3) |
Dead space volume was estimated as approximately 1 ml per pound of body weight for adults [23].
2.5. Estimation of cardiac output from heart rate data
Cardiac output was estimated from the measured heart rate values. Cardiac output by definition is the product of heart rate and stroke volume. During moderate workload there is a linear relationship between heart rate and stroke volume (and also between heart rate and cardiac output) [24]. Stroke volume increases only slightly—in case of male volunteers we assumed that the stroke volume changed between 82 ml (at rest) and 100 ml (at a workload of 75 W) proportionally to the heart rate rise. In case of female volunteers we used the assumption that on average the stroke volume of women is 85% of the stroke volume of men [25]. Consequently, we estimated that the stroke volume of women altered between 70 and 85 ml proportionally to the heart rate.
3. Results
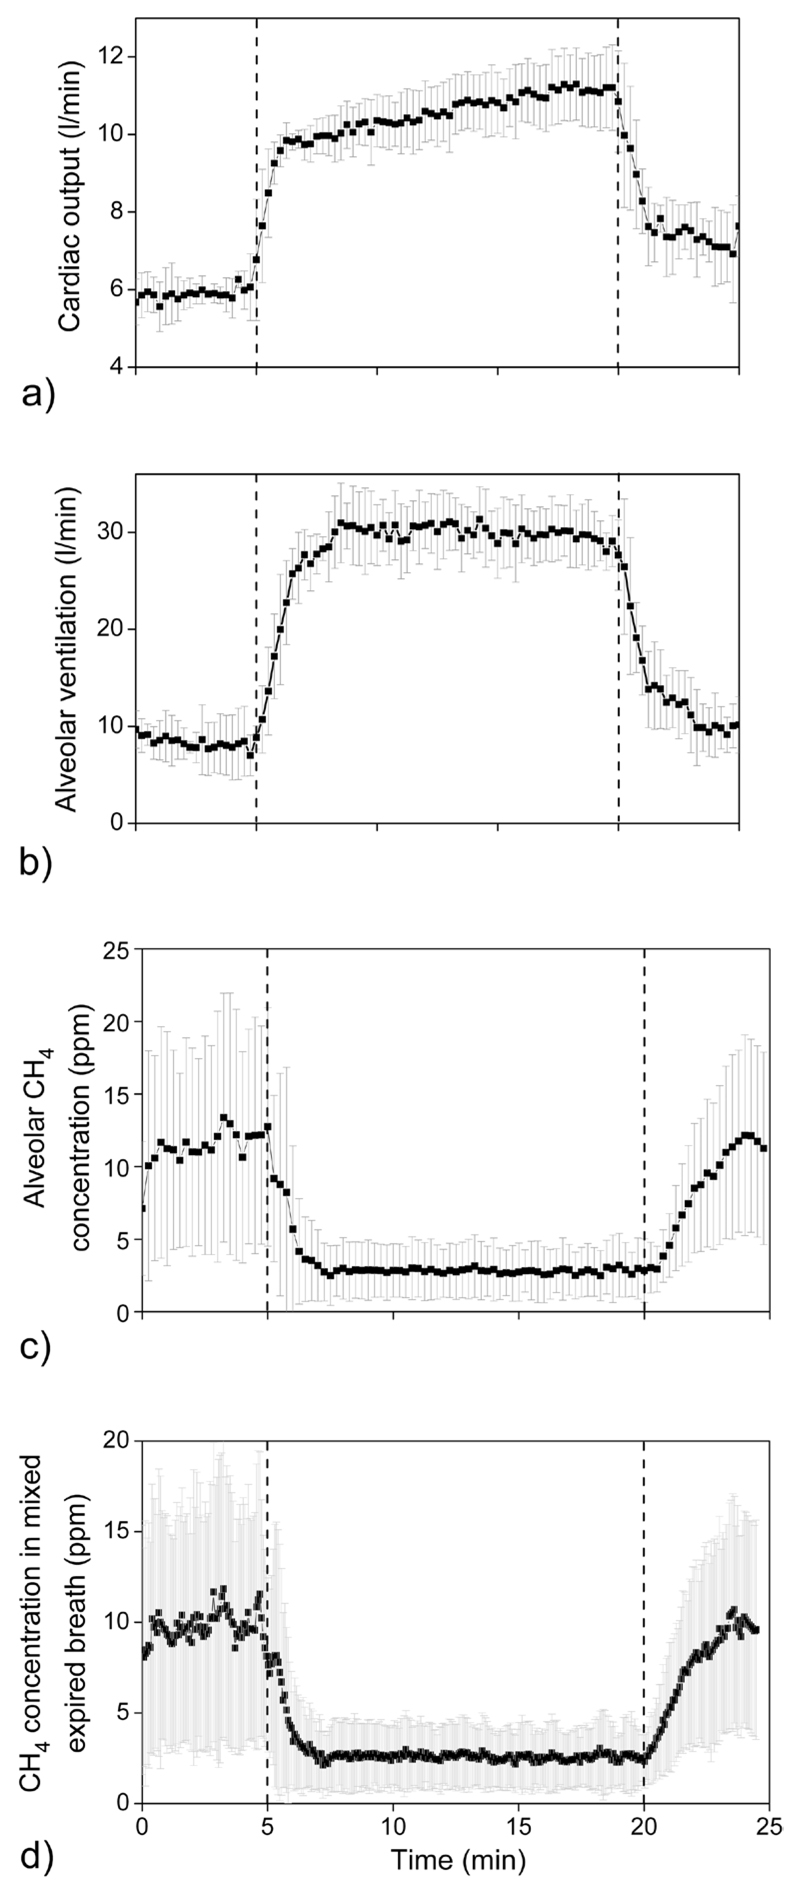
In accordance with previous studies [14–16] it was found that hemodynamic and respiratory variables generally exhibit a very consistent behaviour among all test subjects. Cardiac output rapidly increased from approx. 5–6 L min−1 at rest to a constant plateau of about 10–11 L min−1 during permanent workload of 75 W. Simultaneously, estimated alveolar ventilation showed an increase from 6–10 L min−1 to a steady state level of approx. 27–34 L min−1.
Average values (n = 5) of estimated cardiac output, estimated alveolar ventilation, estimated alveolar methane concentration, and exhaled methane concentration during the challenge test are presented in figures 1(a)–(d). It has to be taken into account that 16 s are required to transfer the sample from the mask to the PAS system due to the volume of the gas sampling line. As a result, there is a time shift between data provided by the spirometer and the methane concentration values. Consequently, the methane profile was shifted forward by 16 s in all figures.
Figure 1.
Average values of the volunteers (n = 5) of cardiac output (a), alveolar ventilation (b), alveolar methane concentration (c), and exhaled methane concentration (d). Constant workload of 75 W was between 5–20 min (areas between the two dashed lines). Error bars denote standard deviation of data. The alveolar methane concentration, alveolar ventilation, and cardiac output were estimated as given in sections 2.4 and 2.5.
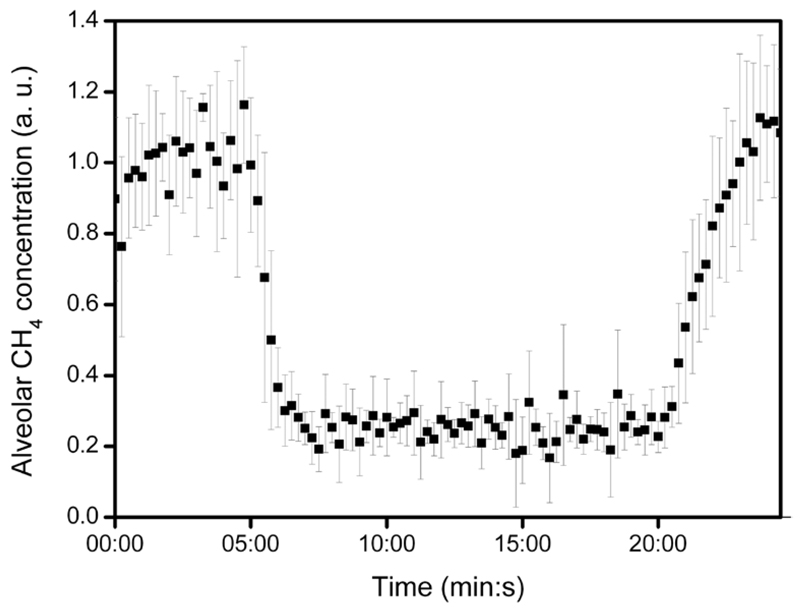
Estimated alveolar methane concentration of the 5 subjects at rest varied within the range of 1–19 ppm with an average of 11.4 ppm (table 1). Exhaled methane exhibited a drastic decrease shortly after the onset of exercise. It declined usually by a factor of about 3–4 (in case of one volunteer by 5) within approximately 1.5 min of pedalling. After the end of the workload the methane concentration in breath started to recover. In order to compare the individual profiles having different methane level, methane concentration values were normalized with the pre-exercise average of all readings per individual; the average of the relative alveolar methane concentration profile of the subjects (with standard deviation) is presented in figure 2.
Table 1.
Exhaled methane concentration and / (estimated ventilation-perfusion ratio) of 5 subjects on average during resting phase 1 (0–5 min) and for the constant plateau of ergometer phase (7.5–20 min) intervals of the ergometer test.
| Estimated alveolar CH4 (ppm) |
Estimated / |
|||
|---|---|---|---|---|
| Resting phase 1 |
Ergometer phase |
Resting phase 1 |
Ergometer phase |
|
| Subject | Mean ± SD | Mean ± SD | Mean ± SD | Mean ± SD |
| 1 | 16.6 ± 3.5 | 3.3 ± 0.2 | 1.31 ± 0.27 | 2.49 ± 0.19 |
| 2 | 18.8 ± 2.8 | 5.4 ± 0.6 | 1.72 ± 0.36 | 2.95 ± 0.26 |
| 3 | 6.6 ± 0.8 | 1.7 ± 0.2 | 1.11 ± 0.18 | 2.99 ± 0.22 |
| 4 | 13.8 ± 2.4 | 3.4 ± 0.3 | 1.81 ± 0.33 | 2.99 ± 0.20 |
| 5 | 1.4 ± 0.4 | 0.4 ± 0.2 | 1.10 ± 0.16 | 2.63 ± 0.17 |
| Mean (n = 5) | 11.4 ± 7.3 | 2.8 ± 1.9 | 1.41 ± 0.34 | 2.81 ± 0.23 |
SD, standard deviation.
Figure 2.
Relative changes of alveolar methane concentration during ergometer test: 5 min rest—15 min workload—5 min rest (recovery). Note that the average of the measurements of 5 subjects (normalized with the pre-exercise average per individual) is indicated. Error bars show standard deviation of data. The alveolar methane concentration was estimated from mixed expired concentration as given in section 2.4.
Table 1 shows the average of data obtained from ergometer measurements. The Pearson correlation coefficient between average pre-exercise and workout alveolar methane concentration was found to be R = 0.957, p = 0.011 (n = 5).
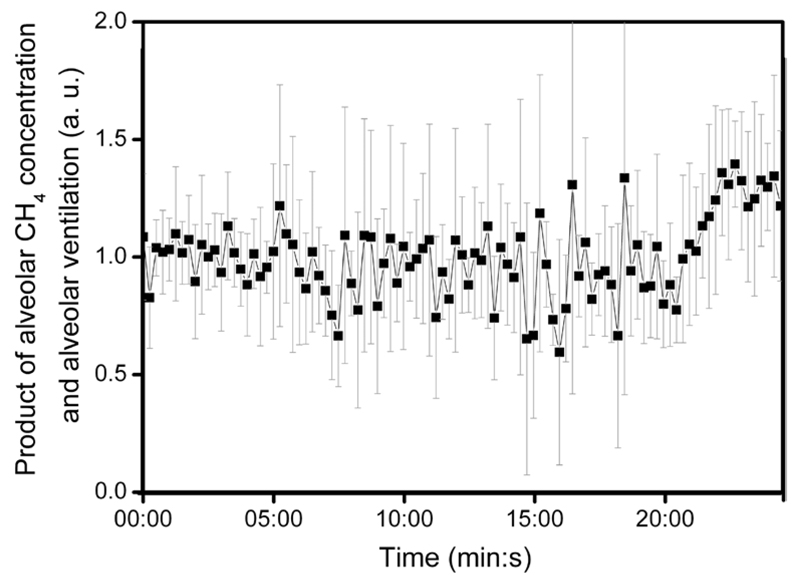
It was also observed that the product of estimated alveolar ventilation and alveolar methane concentration is approximately constant on average during the whole experiment. Figure 3 shows the mean value (n = 5) of alveolar ventilation multiplied by alveolar methane concentration (the product was normalized with the pre-exercise average of each subject).
Figure 3.
Product of alveolar methane concentration and alveolar ventilation during the ergometer test. Average values of the subjects (n = 5) with error bars indicating standard deviation are plotted. The alveolar methane concentration and alveolar ventilation were estimated as given in sections 2.4 and 2.5.
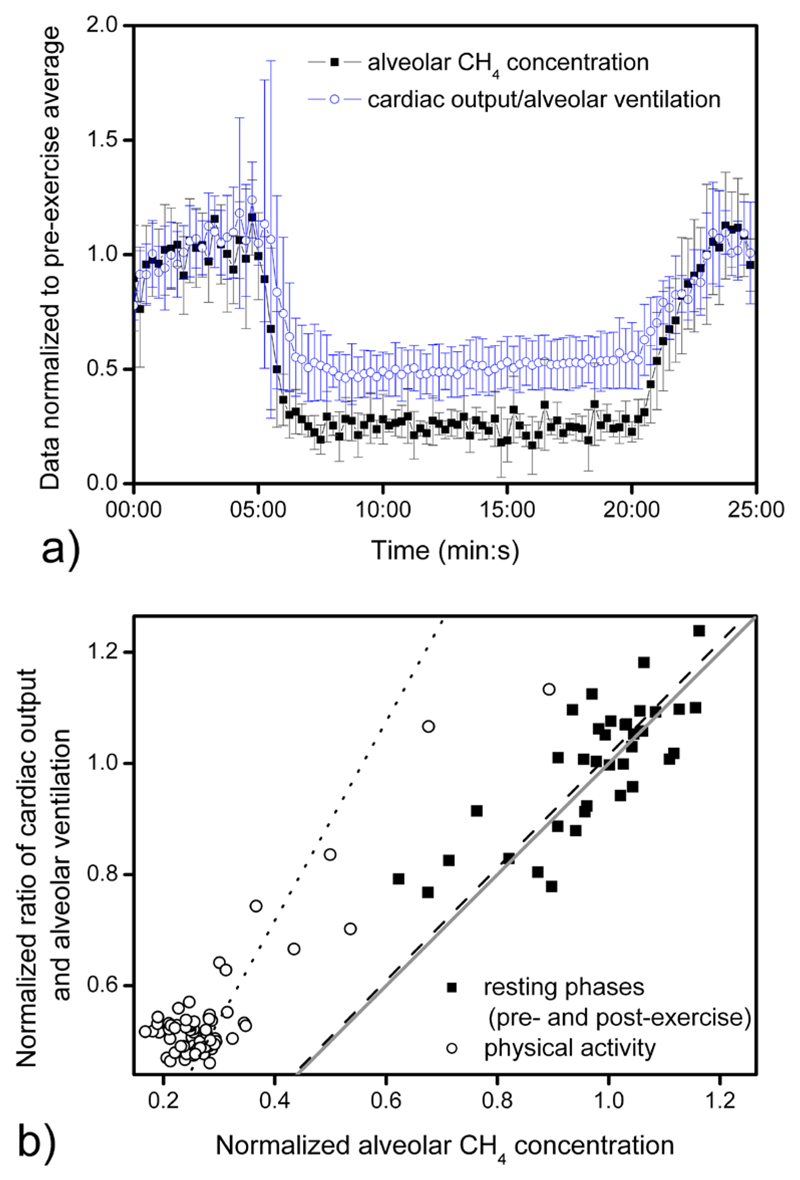
The average of the estimated alveolar methane concentration compared to the inverse of the ventilation-perfusion ratio during ergometer tests (n = 5) is shown in figure 4(a). In order to compare the individual results, data were normalized with the pre-exercise average of all readings per individual. Additionally, figure 4(b) shows the correlation between the alveolar methane concentration and the ratio of cardiac output and alveolar ventilation (after normalization by the pre-exercise average). Under non-exercise conditions (pre- and post-exercise 0–5 min, 21–25 min, denoted by black squares) normalized alveolar methane concentration and the normalized ratio of cardiac output and alveolar ventilation are in good agreement, the average difference was 1.6% (i.e. the linear fit had a slope of 1.016 ± 0.014, n = 36, R = 0.787, p < 0.001). Nevertheless, data obtained during physical activity (indicated by open circles) had an average difference of 79.3% (i.e. the linear fit had a slope of 1.793 ± 0.047, n = 64, R = 0.897, p = 0.018).
Figure 4.
Average of estimated alveolar methane concentration and the inverse of the estimated ventilation-perfusion ratio during ergometer tests (n = 5) (a) as a function of time; (b) compared to each other; dotted and dashed lines indicate linear fit to data obtained under exercise (n = 64, R = 0.897, p = 0.018) and non-exercise conditions (n = 36, R = 0.787, p < 0.001), respectively. Line with a slope of unity is denoted by a grey straight line. The alveolar methane concentration, alveolar ventilation, and cardiac output were estimated as given in sections 2.4 and 2.5.
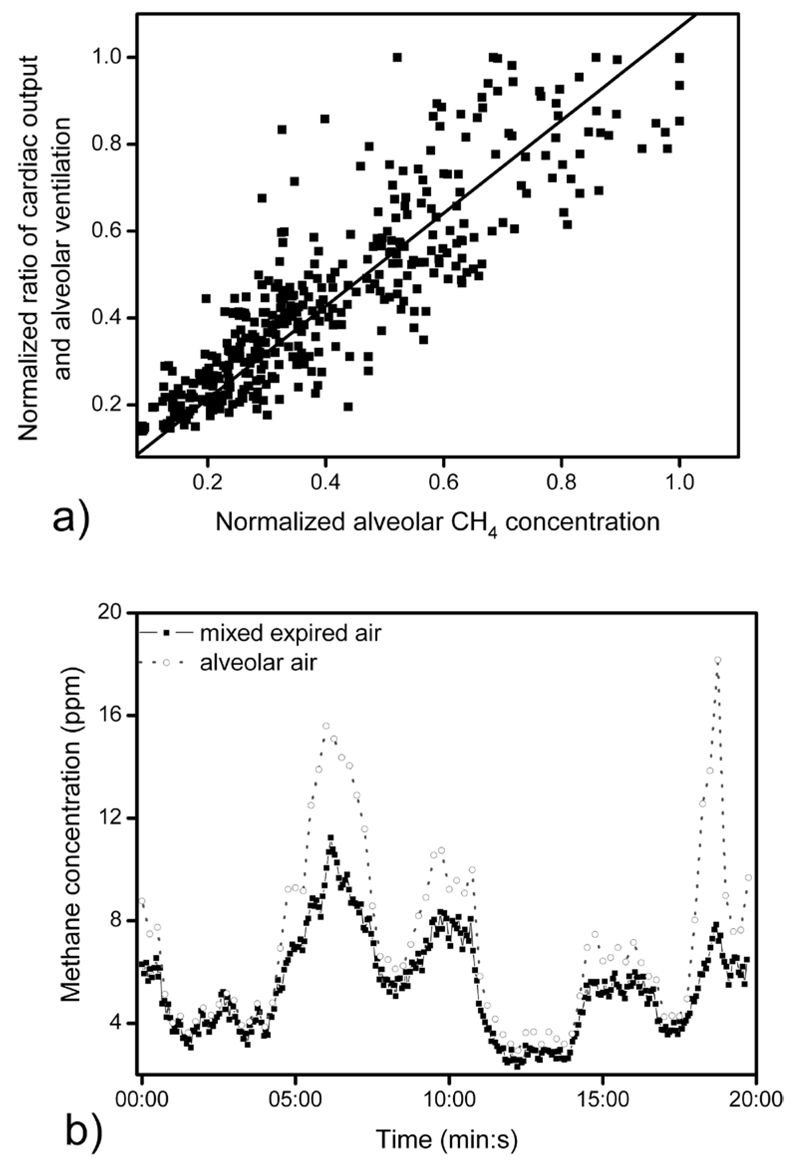
During the hypo- and hyperventilation tests, methane concentration followed rapidly the change of the inverse of the estimated ventilation-perfusion ratio (figures 5(a) and (b)). Figure 5(a) shows alveolar methane concentration as a function of the inverse of the ventilation-perfusion ratio; a good agreement was found, the average difference was 6.9% (i.e. the linear fit had a slope of 1.069 ± 0.013, n = 398, R = 0.886, p < 0.001). The initial value of the estimated alveolar ventilation was 7–8 L min−1 (considered to be normal at rest) while during forced hypo- and hyperventilation it altered between 3–5 L min−1 and 12–15 L min−1. The variation of mixed expired methane concentration ranged between 50–200% of the initial value measured at normal ventilation (figure 5(b)). Additionally, alveolar methane concentration changed over a greater range than mixed expired methane (figure 5(b)).
Figure 5.
(a) Alveolar methane concentration as a function of the inverse of the ventilation-perfusion ratio of a female subject (26 years) during forced hypo- and hyperventilation at rest. All data were normalized against the subject’s initial values (obtained during normal ventilation). Solid line indicates linear regression (n = 398, R = 0.886, p < 0.001). (b) A typical example of methane concentration in mixed expired and alveolar air during hypo- and hyperventilation. The alveolar methane concentration, alveolar ventilation, and cardiac output were estimated as given in sections 2.4 and 2.5.
4. Discussion
Methane breath profiles during the exercise tests were highly reproducible and showed very consistent behaviour among all test subjects (figures 1 and 2).
During workloads of 75 W, alveolar methane levels decreased by a factor of 3–4. According to previous findings of King et al [14–16] it was concluded that short-term effects observable in breath methane levels are principally caused by changes in pulmonary gas exchange patterns rather than fluctuations in the endogenous synthesis. Methane breath profiles during ergometer challenge are in agreement with the behaviour anticipated from classical pulmonary inert gas elimination theory. In a recent study exhaled butane was found to behave similarly to methane during ergometer test [16]. The similarity between the behaviour of methane and butane stems from their low solubility in blood and non-polarity. The Farhi equation [26] predicts that, the increasing/decreasing of the alveolar ventilation will decrease/increase exhaled breath concentrations (as a result of increased/decreased dilution) if other factors are equal. Whereas the relationship between breath concentrations and cardiac output is monotonic and reflects dependence on supply. The basic Farhi equation reads:
| (4) |
where CA and Cv indicate the VOC concentration in alveolar air and in mixed venous blood, respectively; is the alveolar ventilation, is the cardiac output and λb:a refers to the blood-air partition coefficient. λb:a for methane was estimated by a formula given by Poulin and Krishnan; [27, 28] the calculated λb:a was 0.0242. Although, different values have been reported for λb:a of methane in human blood (0.038 [29] and 0.066 [30]), nevertheless it can be safely assumed that λb:a is less than 0.1. Consequently it is negligible from the Farhi equation:
| (5) |
The alveolar ventilation usually increases more intensively than the cardiac output during exertion of an effort [16, 28]. Exhaled methane concentration strongly depends on ventilation-perfusion ratio ( / ), which was approximately 1 at rest and increased by a factor of 2–3 during exercise, while methane concentration decreased by a factor of 3–4 (in case of one volunteer by 5) (table 1). Average values of methane concentration during ergometer tests compared to the calculated / values are shown in figures 4(a) and (b). As far as figure 4(b) is concerned, adherence to the simplified Farhi equation (equation (5)) would yield a slope of 1 for / as a function of the methane concentration. Linear fit of data corresponding to the resting phases (pre- and post-exercise) has a slope of 1.016 ± 0.014. However, data measured during resting phases and physical activity are well separated and the slopes of the linear fits are different (for physical activity it is 1.793 ± 0.047). The alveolar methane concentration during exercise seems to decrease more than expected from the Farhi equation (i.e. the drop of estimated / ). This difference might be explained if one assumes that the absolute blood flow through the intestine stays constant during moderate exercise, since blood flow through tissues is matched with the metabolic needs of the tissues. In that case the relative blood flow through the intestine is different at rest and during exercise. This will lead to a decreased mixed venous concentration and hence to an additional decrease of the alveolar methane concentration during exercise.
Hypo- and hyperventilation tests were carried out to examine if the fit of the data to the Farhi equation was maintained under non-exercise conditions when alveolar ventilation was varied. The results of these hypo- and hyperventilation tests of a single volunteer suggest that at rest the alveolar methane concentration and the ratio of the cardiac output and the alveolar ventilation (all normalized against the subject’s initial values) are in quantitative agreement with equation (5) (figure 5(a)). Figures 4(b) and 5(a) suggest that under non-exercise conditions normalized alveolar methane concentration and the ratio of estimated cardiac output and alveolar ventilation are in good agreement (the linear fit had a slope of 1.016 ± 0.014 for pre- and post-exercise conditions and 1.069 ± 0.013 for hypo- and hyperventilation tests). Consequently, it can be concluded that the Farhi equation can describe quantitatively the experimental results of the subjects under non-exercise conditions. Nevertheless, data suggest that during exercise the Farhi equation can explain breath methane concentration changes only qualitatively (figures 4(a) and (b)).
In addition, figure 5(b) indicates that methane levels change considerably both in expired and alveolar air as a result of altering ventilation. This is consistent with previous findings indicating that great care should be taken during exhaled air sampling targeting gases with low solubility in blood (including methane), since it is well known that most subjects hyperventilate when they are asked to exhale for the purpose of breath collection [31, 32].
5. Conclusions
Data show substantial changes in the breath methane level under exercise and non-exercise conditions due to its high sensitivity to ventilation-perfusion ratio (that originates from the low blood-air partition coefficient of methane). These changes can be described qualitatively by the Farhi equation. Ergometer tests and hypo- and hyperventilation experiments indicated that substantial differences can occur between measurements during normal and elevated respiration. These findings suggest that measurements of gases with low blood solubility in breath should be made with close attention paid to alterations in ventilation such as hyperventilation, which frequently occurs when subjects give breath samples.
Acknowledgments
The authors would like to thank the referees for their valuable and constructive comments on the manuscript.
We appreciate funding from the Austrian Federal Ministry for Transport, Innovation and Technology (BMVIT/BMWA, project 836308, KIRAS) and from the Austrian Agency for International Cooperation in Education and Research (OeAD-GmbH, project SPA 04/158 - FEM_PERS). A S was supported by a scholarship of Aktion Österreich–Ungarn (Ernst Mach-Stipendien). K U gratefully acknowledges support from the Austrian Science Fund (FWF): project number P24736-B23. V R gratefully acknowledges a Lise-Meitner fellowship from the Austrian Science Fund (FWF): project number M1213. We thank the government of Vorarlberg (Austria) for its generous support.
The research was supported by the European Union and the State of Hungary, co-financed by the European Social Fund in the framework of TÁMOP 4.2.4.A/2-11-1-2012-0001 ‘National Excellence Program’.
References
- [1].Nisbet EG, Dlugokencky EJ, Bousquet P. Methane on the rise—again. Science. 2014;343:493–5. doi: 10.1126/science.1247828. [DOI] [PubMed] [Google Scholar]
- [2].Keppler F, Boros M, Frankenberg C, Lelieveld J, McLeod A, Pirttila AM, Röckmann T, Schnitzler JP. Methane formation in aerobic environments. Environ Chem. 2009;6:459–65. [Google Scholar]
- [3].de Lacy Costello BPJ, Ledochowski M, Ratcliffe NM. The importance of methane breath testing: a review. J Breath Res. 2013;7 doi: 10.1088/1752-7155/7/2/024001. 024001. [DOI] [PubMed] [Google Scholar]
- [4].Levitt MD, Furne JK, Kuskowski M, Ruddy J. Stability of human methanogenic flora over 35 years and a review of insights obtained from breath methane measurements. Clin Gastroenterol Hepatol. 2006;4:123–9. doi: 10.1016/j.cgh.2005.11.006. [DOI] [PubMed] [Google Scholar]
- [5].Pitt P, De Bruijn KM, Beeching MF, Goldberg E. Studies on breath methane: the effect of ethnic origins and lactulose. Gut. 1980;21:951–9. doi: 10.1136/gut.21.11.951. [DOI] [PMC free article] [PubMed] [Google Scholar]
- [6].Polag D, Leiß O, Keppler F. Age dependent breath methane in the German population. Sci Total Environ. 2014;481:582–7. doi: 10.1016/j.scitotenv.2014.02.086. [DOI] [PubMed] [Google Scholar]
- [7].Peled Y, Gilat T, Liberman E, Bujanover Y. The development of methane production in childhood and adolescence. J Pediatr Gastroenterol Nutr. 1985;4:575–9. doi: 10.1097/00005176-198508000-00013. [DOI] [PubMed] [Google Scholar]
- [8].Minocha A, Rashid S. Reliability and reproducibility of breath hydrogen and methane in male diabetic subjects. Dig Dis Sci. 1997;42:672–6. doi: 10.1023/a:1018832117482. [DOI] [PubMed] [Google Scholar]
- [9].Roccarina D, Lauritano EC, Gabrielli M, Franceschi F, Ojetti V, Gasbarrini A. The role of methane in intestinal diseases. Am J Gastroenterol. 2010;105:1250–6. doi: 10.1038/ajg.2009.744. [DOI] [PubMed] [Google Scholar]
- [10].Sahakian AB, Jee SR, Pimentel M. Methane and the gastrointestinal tract. Dig Dis Sci. 2010;55:2135–43. doi: 10.1007/s10620-009-1012-0. [DOI] [PubMed] [Google Scholar]
- [11].Kunkel D, Basseri RJ, Makhani MD, Chong K, Chang C, Pimental M. Methane on breath testing is associated with constipation: a systematic review and meta-analysis. Dig Dis Sci. 2011;56:1612–8. doi: 10.1007/s10620-011-1590-5. [DOI] [PubMed] [Google Scholar]
- [12].Smith D, Spanel P, Herbig J, Beauchamp J. Mass spectrometry for real-time quantitative breath analysis. J Breath Res. 2014;8:027101. doi: 10.1088/1752-7155/8/2/027101. [DOI] [PubMed] [Google Scholar]
- [13].Dryahina K, Smith D, Spanel P. Quantification of methane in humid air and exhaled breath using selected ion flow tube mass spectrometry. Rapid Commun Mass Spectrom. 2010;24:1296–304. doi: 10.1002/rcm.4513. [DOI] [PubMed] [Google Scholar]
- [14].King J, Kupferthaler A, Unterkofler K, Koc H, Teschl S, Teschl G, Miekisch W, Schubert J, Hinterhuber H, Amann A. Isoprene and acetone concentration profiles during exercise on an ergometer. J Breath Res. 2009;3:027006. doi: 10.1088/1752-7155/3/2/027006. [DOI] [PubMed] [Google Scholar]
- [15].King J, Helin K, Unterkofler K, Mochalski P, Kupferthaler A, Teschl G, Teschl S, Hinterhuber H, Amann A. Physiological modeling of isoprene dynamics in exhaled breath. J Theor Biol. 2010;267:626–37. doi: 10.1016/j.jtbi.2010.09.028. [DOI] [PubMed] [Google Scholar]
- [16].King J, Mochalski P, Kupferthaler A, Unterkofler K, Koc H, Filipiak W, Teschl S, Hinterhuber H, Amann A. Dynamic profiles of volatile organic compounds in exhaled breath as determined by a coupled PTR-MS/GC-MS study. Physiol Meas. 2010;31:1169–84. doi: 10.1088/0967-3334/31/9/008. [DOI] [PubMed] [Google Scholar]
- [17].Schwoebel H, Schubert R, Sklorz M, Kischkel S, Zimmermann R, Schubert JK, Miekisch W. Phase-resolved real-time breath analysis during exercise by means of smart processing of PTR-MS data. Anal Bioanal Chem. 2011;401:2079–91. doi: 10.1007/s00216-011-5173-2. [DOI] [PubMed] [Google Scholar]
- [18].King J, Unterkofler K, Teschl S, Amann A, Teschl G. Volatile organic compounds in exhaled breath: real-time measurements, modeling, and bio-monitoring applications. In: Backfrieder W, et al., editors. Proc of the Int Workshop on Innovative Simulation for Health Care. Rende: University of Genova; 2012. pp. 139–44. 978-88-97999-13-3. [Google Scholar]
- [19].Jahjah M, Ren W, Stefanski P, Lewicki R, Zhang J, Jiang W, Tarka J, Tittel FK. A compact QCL based methane and nitrous oxide sensor for environmental and medical applications. Analyst. 2014;139:2065. doi: 10.1039/c3an01452e. [DOI] [PubMed] [Google Scholar]
- [20].Rocha MV, Sthel MS, Silva MG, Paiva LB, Pinheiro FW, Miklos A, Vargas H. Quantum-cascade laser photoacoustic detection of methane emitted from natural gas powered engines. Appl Phys B. 2012;106:701–6. [Google Scholar]
- [21].Bozoki Z, Pogany A, Szabo G. Photoacoustic instruments for practical applications: present, potentials, and future challenges. Appl Spec Rev. 2011;46:1–37. [Google Scholar]
- [22].Tuboly E, Szabo A, Eros G, Mohacsi A, Szabo G, Tengolics R, Rakhely G, Boros M. Determination of endogenous methane formation by photoacoustic spectroscopy. J Breath Res. 2013;7:046004. doi: 10.1088/1752-7155/7/4/046004. [DOI] [PubMed] [Google Scholar]
- [23].Schwartzstein RM, Parker MJ. Respiratory Physiology: a Clinical Approach. Baltimore: Williams & Wilkins; 2006. [Google Scholar]
- [24].Rodeheffer RJ, Gerstenblith G, Becker LC, Fleg JL, Weisfeldt ML, Lakatta EG. Exercise cardiac output is maintained with advancing age in healthy human subjects: cardiac dilatation and increased stroke volume compensate for a diminished heart rate. Circulation. 1984;69:203–13. doi: 10.1161/01.cir.69.2.203. [DOI] [PubMed] [Google Scholar]
- [25].Johnson AT. Biomechanics and Exercise Physiology: Quantitative Modeling. Boca Raton: CRC Press; 2007. [Google Scholar]
- [26].Farhi LE. Elimination of inert gas by the lung. Respir Physiol. 1967;3:1–11. doi: 10.1016/0034-5687(67)90018-7. [DOI] [PubMed] [Google Scholar]
- [27].Poulin P, Krishnan K. An algorithm for predicting tissue: blood partition coefficients of organic chemicals from n-octanol: water partition coefficient data. J Toxicol Environ Health. 1995;46:117–29. doi: 10.1080/15287399509532021. [DOI] [PubMed] [Google Scholar]
- [28].Amann A, Mochalski P, Ruzsanyi V, Broza YY, Haick H. Assessment of the exhalation kinetics of volatile cancer biomarkers based on their physicochemical properties. J Breath Res. 2014;8:016003. doi: 10.1088/1752-7155/8/1/016003. [DOI] [PMC free article] [PubMed] [Google Scholar]
- [29].Wagner PD, Naumann PF, Laravuso RB. Simultaneous measurement of eight foreign gases in blood by gas chromatography. J Appl Physiol. 1974;36:600–5. doi: 10.1152/jappl.1974.36.5.600. [DOI] [PubMed] [Google Scholar]
- [30].Poyart C, Bursaux E, Freminet A, Bertin M. Interactions of short chain aliphatic hydrocarbons with human blood and haemoglobin A solutions. Biomedicine. 1976;25:224–7. [PubMed] [Google Scholar]
- [31].Cope KA, Watson MT, Foster WM, Sehnert SS, Risby TH. Effects of ventilation on the collection of exhaled breath in humans. J Appl Physiol. 2004;96:1371–9. doi: 10.1152/japplphysiol.01034.2003. [DOI] [PubMed] [Google Scholar]
- [32].Amann A, Miekisch W, Pleil J, Risby TH, Schubert J. Methodological issues of sample collection and analysis of exhaled breath. Eur Respir Monogr 49: Exhaled Biomarkers. 2010;49:96–114. [Google Scholar]


