Abstract
We have recently provided evidence that the perception of number and texture density is mediated by two independent mechanisms: numerosity mechanisms at relatively low numbers, obeying Weber's law, and texture-density mechanisms at higher numerosities, following a square root law. In this study we investigated whether the switch between the two mechanisms depends on the capacity to segregate individual dots, and therefore follows similar laws to those governing visual crowding. We measured numerosity discrimination for a wide range of numerosities at three eccentricities. We found that the point where the numerosity regime (Weber's law) gave way to the density regime (square root law) depended on eccentricity. In central vision, the regime changed at 2.3 dots/°2, while at 15° eccentricity, it changed at 0.5 dots/°2, three times less dense. As a consequence, thresholds for low numerosities increased with eccentricity, while at higher numerosities thresholds remained constant. We further showed that like crowding, the regime change was independent of dot size, depending on distance between dot centers, not distance between dot edges or ink coverage. Performance was not affected by stimulus contrast or blur, indicating that the transition does not depend on low-level stimulus properties. Our results reinforce the notion that numerosity and texture are mediated by two distinct processes, depending on whether the individual elements are perceptually segregable. Which mechanism is engaged follows laws that determine crowding.
Keywords: numerosity, texture density, crowding, numerical cognition, approximate number system
Introduction
Even when counting is not permitted, humans and other animals are quite competent at estimating the number of objects in the field (Dehaene, 2011). Recent evidence shows that perception of numerosity shares many features with other perceptual domains, suggesting it is a primary component of the visual system. Importantly, numerosity is susceptible to adaptation: After exposure of several seconds to a stimulus (adapter) containing a high number of dots, the next stimulus, will be perceived as containing fewer dots than it actually does (Burr & Ross, 2008). In addition, like most other visual attributes, numerosity tends to obey Weber’s law, at least over a limited range (Jevons, 1871; Ross, 2003; Whalen, Gallistel, & Gelman, 1999): The discrimination threshold (just noticeable difference) of numerosity tends to increase linearly with stimulus intensity, leading to a stable Weber fraction (discrimination threshold divided by stimulus intensity) across a large range of numerosity.
Some authors have questioned whether number is sensed directly, suggesting instead that it can be derived only from texture density, which is also subject to adaptation (Durgin, 1995). Perhaps the strongest evidence that texture and number tap distinct mechanisms is the recent study of Arrighi, Togoli, and Burr (2014), reporting numerosity adaptation in the temporal domain and between sensory modalities: Adapting to temporal series of sounds affect the perceived numerosity of series of flashes and vice versa. Furthermore, cross-format adaptation between sequentially presented strings of items, and simultaneously presented spatial arrays was observed. This study meets the criterion suggested by Durgin (2008a) for demonstrating that numerosity adaptation does not act via texture mechanisms: “Cross-modal studies seem a more promising avenue for distinguishing aftereffects of perceived number from retinotopic aftereffects in the early visual analysis of texture density.”
Using a numerosity comparison task, Anobile, Cicchini, and Burr (2014) recently demonstrated that numerosity and texture-density tap two different mechanisms. They measured Weber fraction for numerosity discrimination for a wide range of numerosities and found that for low density patterns (less than 0.3 dots/°2), thresholds increased proportionally with numerosity, implying a constant Weber fraction, agreeing with much previous literature (Ross, 2003; Whalen et al., 1999). For denser stimuli, however, thresholds increased only with the square root of numerosity. These results are inconsistent with a model where number is derived as a product of texture-density and area, and point to the existence of two separate mechanisms for estimating numerosity and texture-density, operating over different ranges.
What determines whether numerosity or texture-density mechanisms are at work? In the present study we tested the idea that this depends on a crowding-like effect. Visual crowding is an essential bottleneck that sets limits on object perception, impairing the ability to recognize and respond appropriately to cluttered objects. It occurs when nearby (nonoverlapping) flankers hinder the identification, but not detection of a target object. These interactions between target and flankers create a major limitation on peripheral vision, affecting a range of visual attributes, including orientation (Wilkinson, Wilson, & Ellemberg, 1997), position (Greenwood, Bex, & Dakin, 2009), motion (Bex & Dakin, 2005), and color (van den Berg, Roerdink, & Cornelissen, 2007), over large regions of visual field (Toet & Levi, 1992). The primary determinant of crowding is the center-to-center spacing between target and flankers, not the edge-to-edge spacing: Crowding is therefore relatively independent of the sizes of both target and flankers (Levi, 2008). Importantly, the minimum center-to-center spacing at which crowding does not occur, termed the “critical spacing,” varies directly with eccentricity (Bouma, 1970).
How does crowding apply to numerosity estimation, and why should it set the operation range of numerosity estimation? For relatively sparse patterns (low density), single items can be easily selected and enumerated (Ross & Burr, 2012). Conversely, in highly cluttered patterns, single items are difficult to identify, and might thus be less “countable” (Cavanagh & He, 2011). We suggest that sparse patterns are estimated through the numerosity estimation system, and crowded patterns by texture-density mechanisms. In conditions where area is constant, both density and number are valid cues, so the system with the greater sensitivity in a particular condition should determine threshold.
To test this hypothesis we measured numerosity discrimination thresholds for a large range of numbers, asking subjects to judge which of two clouds of dots appeared more numerous. We manipulated crowding in two ways: by varying stimulus eccentricity from central fixation and by varying dot-size (hence coverage area). Our predictions were that the transition point between the numerosity and texture-density regimes should change as a function of stimuli eccentricity, and be independent of dot size: for central presentations, where crowding is low, numerosity estimation should prevail even for relatively high numerosities and density, while at higher eccentricities, the texture-density system should cut in earlier. The results show that transition from the numerosity to texture regime does indeed depend on eccentricity, and is independent of dot-size, implying the action of crowding-like mechanisms.
Methods
Stimuli were generated with the Psychophysics Toolbox (Brainard, 1997) and presented at a viewing distance of 57 cm on a 23-inch LCD Acer monitor (resolution = 1,920 × 1,080 pixels; refresh rate = 60 Hz; mean luminance = 60 cd/m2; Acer S231HL, China), run by a Macintosh laptop (MacBookPro, Apple, Cupertino, CA).
Participants
Eight subjects (three authors; mean age, 28) with normal or corrected-to-normal vision participated.
Stimuli and procedure
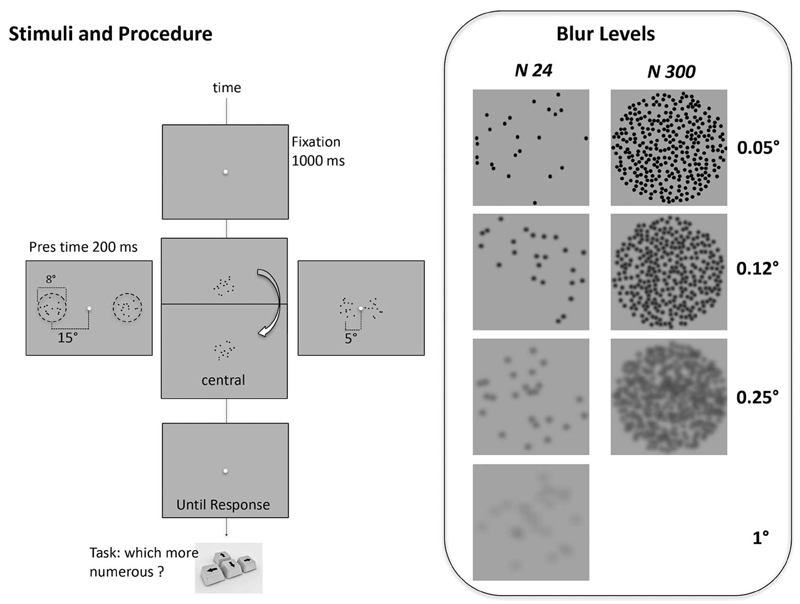
We measured numerosity discrimination thresholds of two clouds of nonoverlapping dots confined to circular regions of 8° diameter. Dots were black, and for most experiments 0.25° diameter, except when we manipulated dots size (Figures 4 and 5). The position of the dots was chosen at random, respecting only the condition that two dots (center-to-center) should not be separated by less than 0.25° (except for the experiment reported in Figure 7, which controls for the consequences of this rule). In separate sessions, the patches were presented centrally (0°) or centered at 5° or 15° left and right of fixation point (Figure 1). In the central condition, the two patches were presented sequentially (ISI 450 ms). In case of 5° and 15° of eccentricity, numerosity of the patch to the left of the fixation point (the reference) was constant within a session, whereas that of the patch to the right of the fixation point (the probe) varied from trial to trial. For the central condition, reference and probe were presented around fixation sequentially in random order from trial to trial.
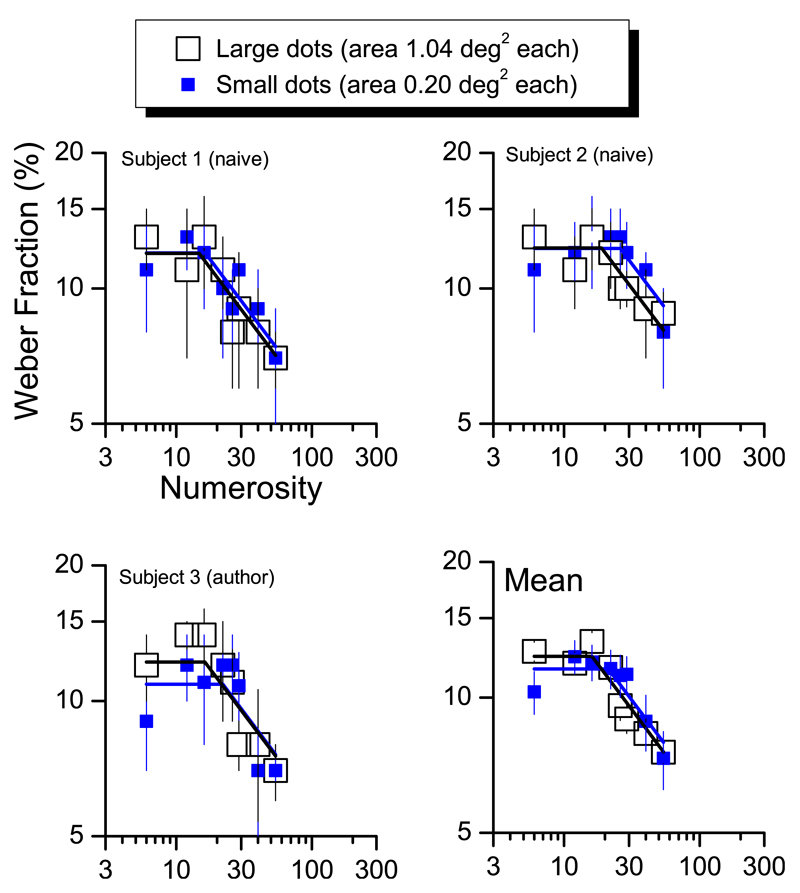
Figure 4.
Effect of dots size on transition point. Weber Fractions for three subjects and group mean as a function of tested numerosity divided by the two levels of dots size. Big open squares refer to patches stimuli made by big dots (diameter of 0.58°), small filled symbols by small dots (diameter of 0.25°). Lines are two-limb best fit of the data (blue for small dots data, black is case of large dots).
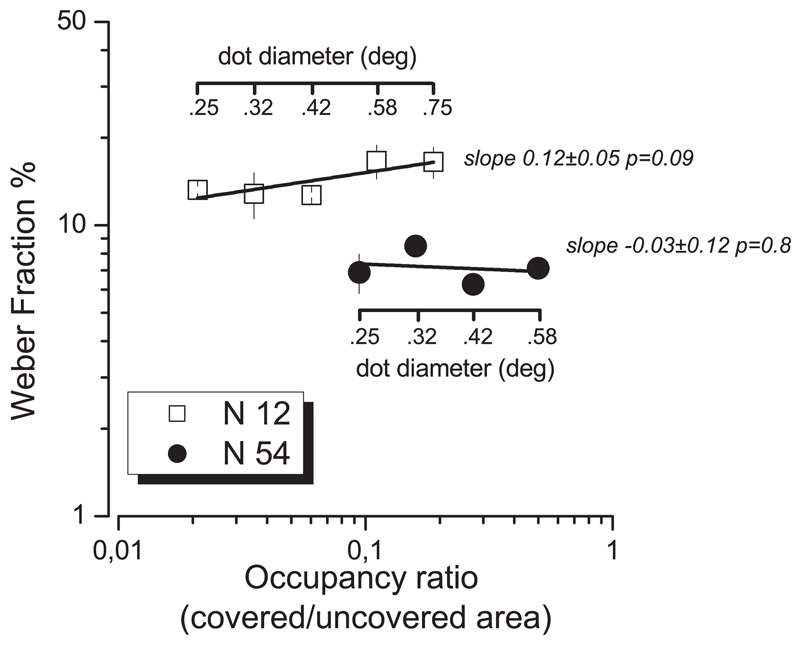
Figure 5.
Weber Fraction (averaged on three subjects) as a function of stimuli occupancy (ratio between covered and uncovered area), for two numerosity levels (N 12, open squares and N 54 filled circles) tested at 5° of eccentricity from the central fixation point. Single dot diameter was varied from 0.25 to 0.75° (for N 54, to prevent overlap between elements, the maximum testable dots size was 0.58°). Continuous lines report best-fitting linear regressions.
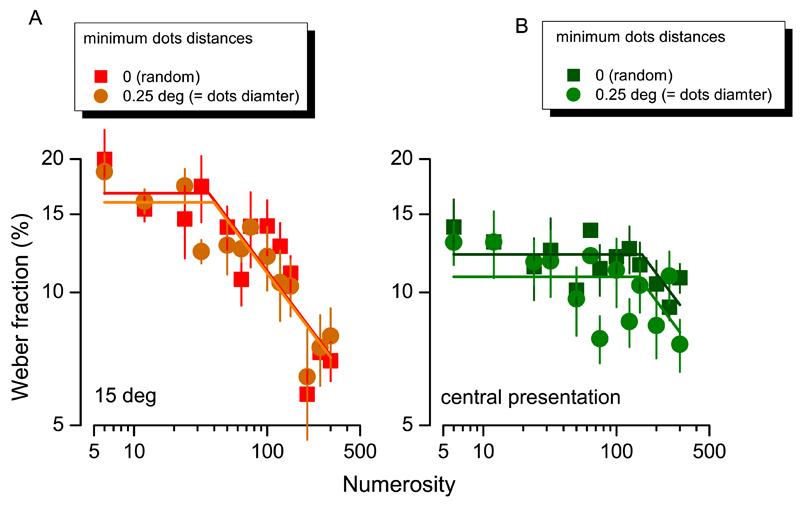
Figure 7.
Effect of stimulus regularity. Weber fractions for numerosity discrimination as a function of numerosity for two levels of stimuli regularity: patches stimuli composed by randomly displayed dots (squares) or spaced dots (circles). For peripheral (A) as well as central (B) presentation the switching points for the curve fits remain similar.
Figure 1.
Stimuli and procedure. Each trial started with a central fixation point lasting for 1 s, then two patches of dots were presented for 200 ms. Subjects were asked to indicate which of the two patches contained more dots by appropriate key-press. In separate sessions, stimuli were presented centrally, or centered at 5° or 15° left and right of fixation point. In the central condition, the two patches were presented sequentially with an interstimulus interval of 450 ms. Box at right: examples of blurred stimuli for two sample numerosities (24 at left, 250 right). The blur of the dots was manipulated by convolving a raw image of a dot with Gaussian filters of various standard deviations corresponding to Gaussians with full width at half height of 0.05, 0.12, 0.25, 0.5 and 1 degrees of visual angle.
The number of dots in the probe patch was varied according to the QUEST adaptive algorithm (Watson & Pelli, 1983), perturbed by a Gaussian jitter (σ = 0.15 log units). At the beginning of each trial, subjects fixated a point in the center of the screen. After 500 ms, the stimuli were presented for 200 ms, and subjects were asked to indicate by button-press which cloud was more numerous. The proportion of trials in which the probe appeared more numerous than the reference was plotted against the number of reference dots and fitted with a Gaussian error function. The median of this function estimates the point of subjective equality, and the standard deviation estimates the precision threshold (i.e., a just-noticeable difference), which was divided by point of subjective equality (a measure of perceived numerosity) to estimate the Weber fraction.
In separate blocks different numerosity were tested: 6, 12, 24, 32, 50, 64, 75, 100, 125, 150, 200, 250, and 300; 90-trial sessions were run for each numerosity, with the order of conditions randomized across subjects. Four of the eight subjects were also tested in control conditions in which we manipulated stimulus low-level features or presentation modality. In the low-level features control experiments, we measured Weber fractions while manipulating contrast and blur of the stimuli. In these conditions the patches were at middle eccentricity (5°) and presentation was simultaneous. In the “contrast experiment” the contrast, defined as k = (Lmean − Lmin)/Lmean) of all dots varied between 5 and 30% (5, 10, 20, 30). In the “blur experiment” we varied the blur of the dots (Figure 1, right box), by taking a raw image of a dot and convolving it with a Gaussian filter of various standard deviations: 1, 2.5, 5, 10, and 20 pixels, corresponding to Gaussians with full width at half height of 0.05, 0.12, 0.25, 0.5, and 1 degrees of visual angle. In a final control experiment we investigated the effect of presentation modality, where we repeated the experiment at 15° eccentricity with simultaneous presentation with a sequential presentation modality (ISI 450 ms), identical to the central condition.
Data fitting
We fitted data, plotted on double logarithmic coordinates, with a two-limb piecewise linear function which had a constant Weber fraction (w) of w0 (slope 0) up to the switching point (N'), then decreased with slope −α:
| (1) |
| (2) |
As most subjects showed a similar decrease of Weber fraction beyond N', we first fit all data and obtained a value of α = 0.4, which was then kept constant throughout all the individual fits.
Results
Effect of eccentricity on number discrimination
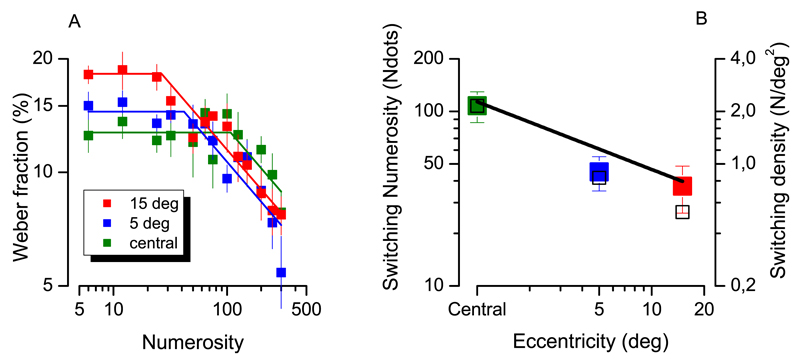
We measured numerosity discrimination threshold by asking subjects to judge which of two clouds of dots was more numerous (2AFC). We tested a large range of numerosities (from six to 300 dots) at three stimulus eccentricities (0, 5, and 15°). Figure 2A shows the average numerosity discrimination precision (Weber fraction) as a function of numerosity for the three eccentricity conditions. As we previously demonstrated (Anobile et al., 2014), Weber fractions remained stable (following Weber Law) over the low numerosity range, then start to decrease, following an approximate square root law. The different dependency on numerosity indicates the action of a different mechanism, one dedicated to perception of texture-density.
Figure 2.
(A) Geometrical means of Weber Fraction as a function of numerosity, for the three conditions (central-green, 5° eccentricity-blue, and 15° eccentricity-red). Numerosity ranged from 6 to 300. Continuous lines are two-limb linear functions (on log coordinates) that best fit the data. (B) Numerosity where the regime changed, as function of stimulus eccentricity. Filled squares, (color code as before) report geometrical mean of knee points extracted fitting single subjects data. Open squares represent the knee points obtained fitting the average data across subjects, shown in Figure 2A. Error bars show ±1 SEM.
To estimate where the data switched from one regime to another, we fitted Weber fractions with a two-limb piecewise linear function (continuous lines, see data fitting section for details), both for the averaged data shown in this figure, and separately for all eight subjects. Clearly, the break in the two-limb function N'—determining the point where Weber’s law gives way to the square root law—depends on eccentricity, occurring much earlier in the periphery than in central vision.
Figure 2B plots the geometrical means of the knee points of the functions fitted separately for each subject (filled squares) and also the estimates obtained by fitting the mean results across subjects, taken from Figure 2A (open squares). In the central condition (green square) the change in psychophysical regime occurs at 114 elements, in the 5° condition at 60 and in the 15° condition at 40 dots. These numerosities correspond to densities of 2.27, 1.19, and 0.8 dots/°2.
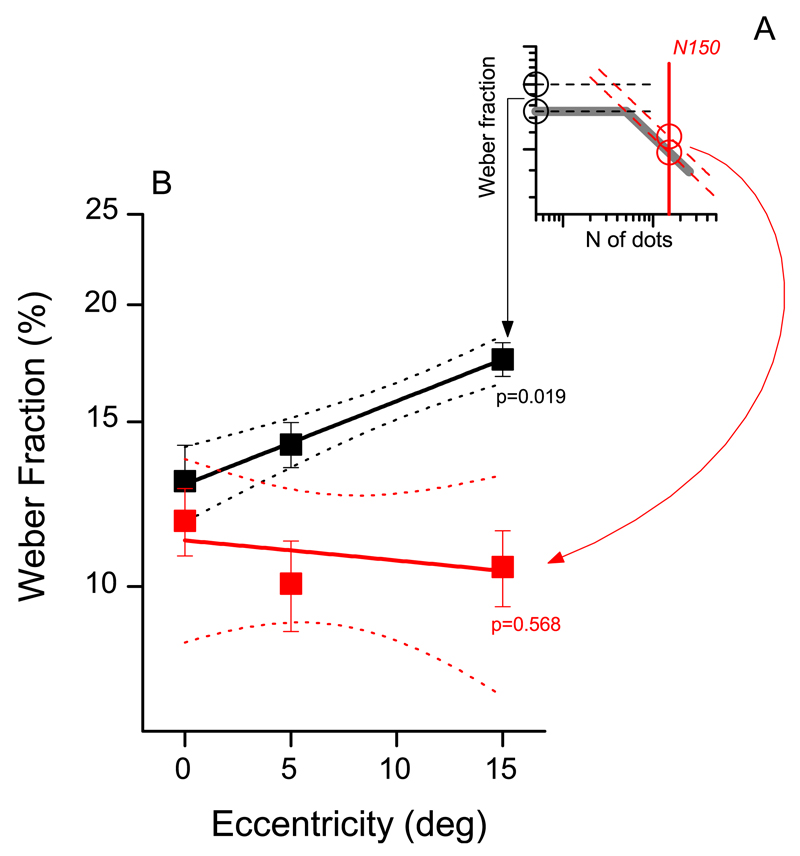
To illustrate better the effect of eccentricity on numerosity judgments we plotted separately the Weber fraction in the low (N < N') and high (N > N') numerosity ranges. To obtain robust estimates of both quantities we fitted individual data with the two-limbed function defined by Equation 1 and 2. We then used the constant part of the function, w0, to represent low numerosity performance, and the decreasing limb of the function for higher numerosities. For ease of comparison of the two quantities we express the high-numerosity performance as the Weber fraction at the sample numerosity of 150 w150 = w0(150/N')−α (see Figure 3A). Figure 3B shows that thresholds in the low numerosity range (black symbols and lines) increase with eccentricity (slope = 0.89 ± 0.02, R2 = 0.99, p = 0.019). However, in the high numerosity range, precision is virtually independent of eccentricity, slightly (but nonsignificantly) improving with eccentricity (slope = −0.004 ± 0.006, R2 = 0.61, p = 0.57).
Figure 3.
Effect of eccentricity in the low and high numerosity ranges. Mean Weber fractions for N < N' (black symbols and lines) and N > N' (red symbols and lines) as a function of eccentricity. Dotted lines show 95% CI, error bars ±1 SEM.
To test the significance of the effect of eccentricity on the texture-density regime we performed a two-way repeated-measures ANOVA, with Weber fraction as dependent variable and numerosity (five levels) and eccentricity (three levels) as independent variables. We restricted our analysis to the higher numerosities (N: 125, 150, 200, 250, and 300), belonging to the texture-density regime. Results confirmed the main effect of numerosity, F(24, 4) = 12.011, p < 0.001. More importantly, Weber fractions in the texture-density range are not affected by eccentricity, F(12, 2) = 1.61, p = 0.24, and we found no interaction between numerosity and eccentricity, F(48, 8) = 0.60, p = 0.77.
Effect of dot size and surface coverage
With the experiments performed so far, it is not clear whether the critical factor determining the transition from a number to texture regime is number of elements per area (and hence average center-to-center spacing), or proportion of area covered by the stimuli (hence edge-to-edge spacing). If dot-size is constant, these two variables covary. The question is very relevant, as a signature of crowding is that it depends on center-to-center, not edge-to-edge spacing. We therefore repeated the experiment (at 5° eccentricity) with two dot diameters, 0.25° (as in the previous studies), and 2.3 times large (0.58° diameter).
Figure 4 shows the results, for three example subjects, two naïve and one author. For all three subjects, the transition point was independent of the size of the stimuli. In all cases the transition point was around 22 dots, corresponding to a density of 0.43 dots/°2. Repeated-measures one-way ANOVA revealed no significant effect of dot-size on transition point, F(2) = 8.44, p > 0.10.
Figure 5 examines more systematically the effect of dot-size. For two representative numerosities, 12 and 54, we measured discrimination thresholds for three subjects for dot diameters ranging from 10 to 30 pixels at 5° eccentricity. The results, averaged over three subjects, show that dot size—and hence occupancy, or surface coverage—had very little effect on sensitivity. While there was a large difference in sensitivity for the two numerosities (about a factor of 2), sensitivity did not change systematically with occupancy, for either numerosity. The slopes of both best-fitting regression lines were not significantly different from zero.
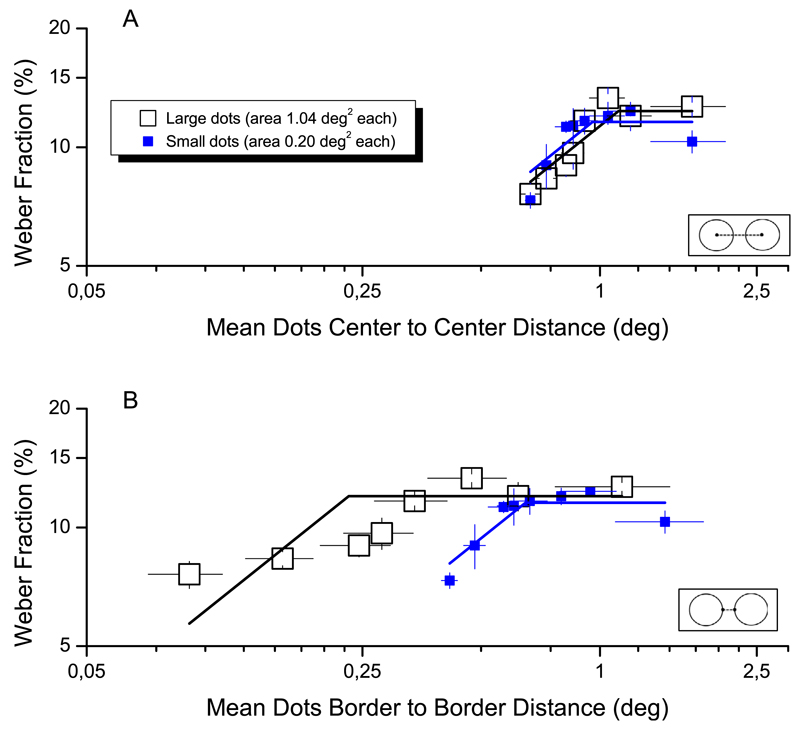
As mentioned above, a signature of crowding is that it depends on center-to-center distances rather than edge-to-edge spacing. To examine this, we computed for each numerosity the average distance of each dot to its nearest neighbor. We repeated this process 100 times and averaged the results.
Figure 6 plots mean Weber fraction (three subjects) both as a function of center-to-center distance (Figure 6A) and border-to-border distance (Figure 6B). When plotted against center-to-center distance, all points for both small- and large-dot stimuli tend to line up to form a single two-limbed curve. On the other hand, when plotted against border-to-border distances (Figure 6B), two separate curves emerge. The plot of Figure 6A complements the previous plots as a function of density, showing an initial increase of near unit slope, followed by a flat regime. The switch between the two occurs when center to center distance is about 1° (i.e., 0.96° for small dots, or 1.05° for large dots), consistently to what reported in Figure 2B (blue squares). This shows nicely that in the texture region small interdot distances), Weber fractions are proportional to dot distance.
Figure 6.
Weber fractions as a function of inter-dot distance. Weber fractions for numerosity are plotted as a function of average center-to-center inter-dot distance (A) or average border-to-border distance (B). As in Figure 4, large open squares refer to patches stimuli made by large dots (area of 1.04°), small filled symbols to small dots (diameter of 0.25°). Continuous lines represent two-limb piecewise linear functions which have slope 2α until knee point and are flat thereafter.
Regularity of dot distributions
As described in the Methods section, the dot distributions were pseudo-random, as they were not permitted to superimpose on neighboring dots. As density increases, this will necessarily result in the arrays becoming more regularly spaced. To test whether the regularity caused by this procedure affected results, we repeated the experiment with dot stimuli positioned entirely at random (resulting in superposition of dots at the higher densities). Figure 7 (results averaged over three subjects) shows that there is very little difference in thresholds for the two conditions, both yielding very similar switching points for the curve fits.
Effect of presentation modality, contrast, and blur
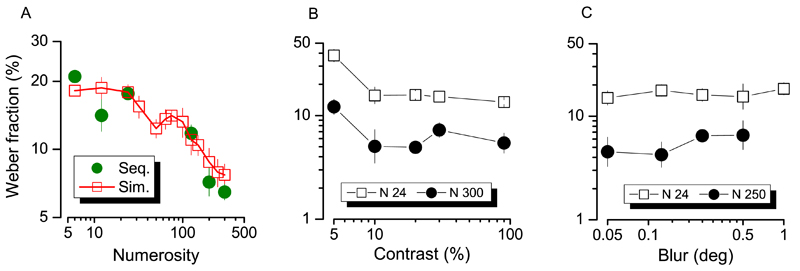
The aforementioned effects of eccentricity were obtained comparing central against peripheral presentations (Figure 2). However, in the central condition stimuli were necessarily presented sequentially (ISI 0.45 s) whereas in peripheral conditions (15° and 5°) presentation was simultaneous. To control for this possible confound we tested four subjects (already tested at 15° of eccentricity using a simultaneous left-right presentation) with a sequential modality (ISI 0.45 s), mirroring the central condition. Figure 8A shows that these two presentation modalities lead to very similar results (green sequential, red simultaneous).
Figure 8.
(A) Subjects geometrical mean of Weber fraction measured with sequentially (green symbols) or simultaneously presented stimuli at 15° of eccentricity from central fixation point. (B) mean Weber fraction as a function of dots contrast or blur (C) level for two different level of numerosity.
In a separate set of experiments we examined the effect of two other important variables that might covary with eccentricity, contrast, and blur (Valsecchi, Toscani, & Gegenfurtner, 2013). Figure 8B shows the effect of dot contrast on Weber fractions at two representative numerosities N24 (clearly in the numerosity estimation range) and N300 (well within the density regime). The graph shows that lowering stimulus contrast has little effect on the discrimination of numerosity, with a degradation of performance occurring only at the lowest contrast (5%). Interestingly, stimulus contrast had the same effect on the patches of both numerosities indicating that it affects equally both the numerosity-based system and the density based system. Figure 8C shows Weber fractions at two representative numerosities (N24 and N250) as function of the spatial blur. The choice of measuring numerosity 250 instead 300, was because at the highest level of blur some of the stimuli become more like a homogenous patch rather than an ensemble of elements (Figure 1 for examples of stimuli). For the same reason, the highest tested level of blur on N250 was settled at 0.5 instead of 1 degrees of visual angle. From the graph, it is clear that changing the blur of the dots leaves the performance substantially unchanged. That blur and contrast do not affect numerosity judgments fit well with recent results provided by Morgan, Raphael, Tibber, and Dakin (2014). These results suggest that the results found in the main experiment (Figure 2) are unlikely driven by low-level stimuli features changes due to peripheral vision but instead to the genuine use of two different perceptual processes. Indeed, the Weber fraction increase found in case of low numbers (i.e., N24) at higher eccentricity (Figure 2) cannot be explained by a loss of perceived contrast or blurring of stimuli in peripheral vision.
Discussion
We (Anobile et al., 2014) recently provided evidence for the existence of two different mechanisms for numerosity and texture perception, each following different psychophysical laws. In this study we tested the idea that the switch-point between numerosity and texture-density perception depends on a crowding-like effect. Taking advantage of the well-known dependency of crowding on eccentricity, we measured numerosity discrimination thresholds over a wide range of numerosities at three stimulus eccentricities, predicting that increasing the eccentricity should increase crowding and therefore change the switching point towards lower numerosities and densities. The data clearly support this hypothesis. The important variable was dots per square degree, or average center-to-center distance, not separation between dot borders, as the effects were independent of dot size, a further signature of crowding. These results reinforce the idea that numerosity and texture-density tap two distinct mechanisms, and go on to show that the conditions that promote density-based estimation are similar to those that induce crowding: numerosity operates on sets of spatially segregable objects, texture-density on a crowded “uncountable” ensemble.
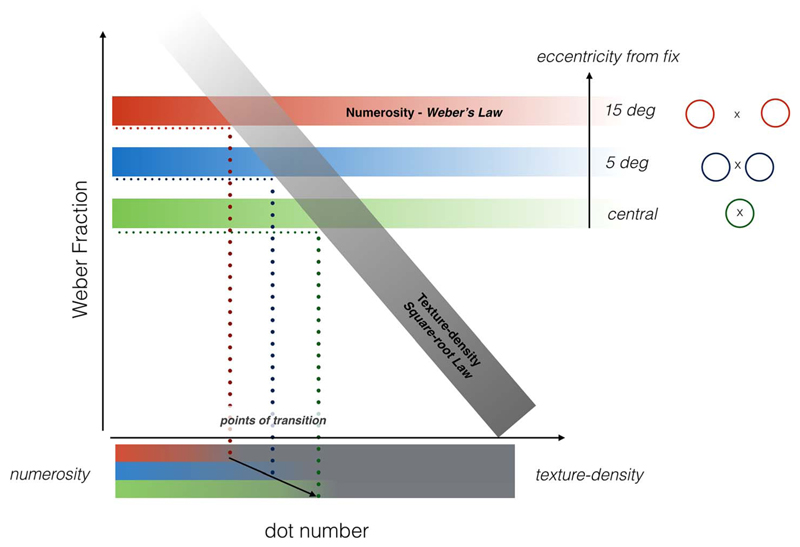
Figure 9 illustrates schematically the concept of the two separate mechanisms. The gray bar represents threshold for the texture discrimination mechanism. The threshold for this mechanism decreases with the square root of numerosity. As average dot-distance also decreases with the square root of numerosity, thresholds (expressed as Weber fractions) are directly proportional to average dot distance. The sensitivity of this mechanism does not seem to depend on eccentricity. For more sparse stimuli that can be segregated perceptually, another mechanism seems to be at work, one that is independent of numerosity, but does depend on eccentricity. As subjects were free to use any criterion for the discrimination, and as area was kept constant, both density and number were equally valid cues for discrimination. Presumably, the more sensitive mechanism prevailed, resulting in the two-limbed functions, with transition point depending on eccentricity.
Figure 9.
Concept of the two separate perceptual mechanisms subserving numerosity discrimination. Sparse stimuli (low numerosities) are sensed by a mechanism obeying Weber's Law (threshold proportional to numerosity), which is dependent on eccentricity (red, blue, and green bars). Texture-discrimination mechanisms (gray bar) come into play with more packed stimuli (higher numerosity): Its threshold decreases with the square root of numerosity. This mechanism does not depend on eccentricity. When comparing the relative numerosity of two patches of items, subjects were free to use any criterion: As the presentation area was kept constant, both texture-density and number were equally valid. According to this model, the measured performance should yield a two-limbed function because subjects rely on the more sensitive mechanism for that specific numerosity level. As the Numerosity mechanism is less precise as eccentricity increase, the transition point between those two mechanisms depends on eccentricity.
We refer here to two mechanisms for numerosity, but in fact there is also a third: at very low numerosities—the so-called subitizing range—yet another mechanism comes into play. This mechanism relies highly on attentional resources (Burr, Turi, & Anobile, 2010; Vetter, Butterworth, & Bahrami, 2008) and seems to be linked to individuation processes and so-called saliency maps (e.g., Knops, Piazza, Sengupta, Eger, & Melcher, 2014; Wutz & Melcher, 2014). We have suggested that the attention-based mechanism supplements—rather than replaces—estimation mechanisms over the subitizing range. Evidence for this suggestion comes from the fact that when attentional resources are deprived, adaptation effects are seen even for very low, subitized numbers (Burr, Anobile, and Turi, 2011): When the attention-based mechanism is neutralized, the estimation mechanism remains, and that shows adaptation effects.
Crowding is a well-studied phenomenon referring to the fact that target objects (typically letters) are more difficult to recognize when flanked by other elements. Crowding is usually defined as the critical center-to-center distance to prevent letter recognition. This distance increases almost linearly with eccentricity, so that the ratio of critical distance to eccentricity remains constant: Referred to as the Bouma constant, this ratio is typically about 0.5 under most conditions (Whitney & Levi, 2011). Our task did not require the recognition of particular items, but the estimation of a global feature, numerosity. That the rules by which this quantity is estimated change with both average center-to-center separation (density) and eccentricity suggests that there are strong similarities with crowding. Interestingly, however, as the stimulus becomes more crowded, discrimination—when normalized by dot-number—improves (Anobile et al., 2014).
The recent study by Valsecchi et al. (2013) also points to the role of crowding in texture and numerosity. They asked subjects to compare the numerosity of peripherally-presented and centrally-presented patterns, and found a systematic underestimation of the peripheral patterns, particularly when they were quite dense and clustered. They suggested that this may reflect could be because of the reduced ability for individuation of peripheral dot patterns, because of crowding-like mechanisms.
Numerosity, like many other visual properties, is susceptible to adaptation. However, many have challenged the notion that it is numerosity that adapts, claiming instead that texture-density adapts (Durgin, 2008b). This has led to suggestions that numerosity is not measured directly, but calculated indirectly via texture density (Durgin, 2008b) or, at least, the two are highly inter-related (Dakin, Tibber, Greenwood, Kingdom, & Morgan, 2011; Tibber, Greenwood, & Dakin, 2012). Our studies do not support these views, but suggest that two distinct mechanisms exist: texture mechanisms at high densities, and numerosity measures at low densities. Of course this leaves open the possibility that around the cusp of the two mechanisms, both will be engaged, and they will interact. Interestingly, many measurements of Dakin et al. (2011) were at moderately high densities, about 5 dots/°2, bordering on the density range.
When stimulus areas are equal, both density and number covary. Durgin (2008b) and Dakin et al. (2011) used stimuli of mismatched area to de-confound this ambiguity, and concluded that numerosity and texture-density tap the same mechanism. They went on to develop a model to describe the perceptual distortions they observed. Broadly speaking, the ratio between the activity of spatial filters sensitive to different frequency bands provides an estimate of both density and number that approximate observer performance. We recently found that for sparse patterns (low numbers), numerosity judgment was much more precise than texture-density (Anobile et al., 2014). The opposite trend was found with highly packed stimuli (high numerosities), where sensitivity for density was higher than for numerosity. This behavioral dissociation suggests that number and texture-density can be independently extracted from visual scenes.
Our current results agree with several other lines of research suggesting that numerosity itself can be detected, without recourse to density. Stoianov and Zorzi (2012) showed that numerosity emerges naturally during unsupervised learning of a hierarchical generative model of perception and, importantly, the model output (like humans) follow Weber law and extract numerosity independently by texture-density. More recently Harvey, Klein, Petridou, and Dumoulin (2013) used high-field functional magnetic resonance to isolate in the human parietal cortex topographically organized neural populations tuned to numerosities. This numerosity brain map seems to ignore completely changes in low-level stimulus features, such as texture-density.
Our crowding hypothesis is consistent with the studies of Franconeri, Bemis, and Alvarez (2009) and He, Zhang, Zhou, and Chen (2009), showing that dots linked by lines to form “dumbbells” seem less numerous than unlinked dots, suggesting that number estimation operates at the level of objects, and object perception requires segmentation. A simple prediction here is that the effect of object-linking on perceived numerosity (or density) should fail at high densities. Interestingly, recently, Valsecchi et al. (2013) found another set of data that link object segregation to numerosity perception. In their study they presented one stimulus centrally and another peripherally and found that the numerosity of the peripheral stimulus is strongly underestimated respect to the central stimulus. After the role of perceived blurring and contrast reduction in peripheral view has been ruled out, they interpreted their results as a consequence of items individuation failure due to visual crowding.
One standard method to test whether two perceptual functions share the same mechanism is to see if the two are affected in the same way by a given manipulation. Using this approach, Ross and Burr (2010) have shown that while numerosity estimates depend strongly on stimulus luminance (increasing systematically with decreasing luminance), texture-density is completely independent from luminance changes. Along similar lines, we show here that numerosity, but not texture-density, depends on stimuli eccentricity: numerosity discrimination thresholds for sparse, but not cluttered, patterns of dots deteriorated as the eccentricity increase. Although controversial (Tibber et al., 2013), several studies have shown that precision in numerosity discrimination (Weber fraction) is strongly related to formal math skills in children (Anobile, Stievano, & Burr, 2013; Halberda, Mazzocco, & Feigenson, 2008; Piazza, 2010), with higher precision associated with higher math scores. Individuals with developmental dyscalculia (a specific developmental deficit in the acquisition of formal math skills) also show severe impairment in precision in numerosity discrimination (Piazza et al., 2010). Piazza, Pinel, Le Bihan, Dehaene (2007) used an fMRI adaptation paradigm with both dot patterns and Arabic digits to show that human intraparietal cortex activation recovered in a distance-dependent fashion whenever a new number was presented, irrespective of how the numerosities were represented. All these studies clearly point to an intriguing relationship between an ancient, nonverbal numerosity estimation system and its culturally mediated counterpart: formal mathematics concepts (Piazza, 2010). Our results demonstrate that only spatially segregable ensembles seem to be processed through the numerosity estimation system. This suggests that numerosity estimation, but not texture-density perception, should correlate with formal math achievement and be impaired in developmental dyscalculia. It would be interesting to test this possibility.
Acknowledgments
This work was supported by the European Research Council (FP7; Space Time and Number in the Brain; and Early Sensory Cortex Plasticity and Adaptability in Human Adults) and the Italian Ministry of University and Research (FIRB RBFR1332DJ).
Footnotes
Commercial relationships: none.
Contributor Information
Giovanni Anobile, Department of Neuroscience, Psychology, Pharmacology and Child Health, University of Florence, Florence, Italy. giovannianobile@hotmail.ithttp://www.pisavisionlab.org/index.php/people/postdocs/anobile.
Marco Turi, Department of Neuroscience, Psychology, Pharmacology and Child Health, University of Florence, Florence, Italy; Department of Translational Research on New Technologies in Medicine and Surgery, University of Pisa, Pisa, Italy. turimarc@gmail.comhttp://www.pisavisionlab.org/index.php/people/postdocs/marco-turi.
Guido Marco Cicchini, Institute of Neuroscience, National Research Council, Pisa, Italy. cicchini@in.cnr.ithttp://www.pisavisionlab.org/index.php/people/postdocs/guido-marco-cicchini.
David C. Burr, Department of Neuroscience, Psychology, Pharmacology and Child Health, University of Florence, Florence, Italy; Institute of Neuroscience, National Research Council, Pisa, Italy. dave@in.cnr.it
References
- Anobile G, Cicchini GM, Burr DC. Separate mechanisms for perception of numerosity and density. Psychological Science. 2014;25(1):265–270. doi: 10.1177/0956797613501520. [DOI] [PubMed] [Google Scholar]
- Anobile G, Stievano P, Burr DC. Visual sustained attention and numerosity sensitivity correlate with math achievement in children. Journal of Experimental Child Psychology. 2013;116(2):380–391. doi: 10.1016/J.Jecp.2013.06.006. [DOI] [PubMed] [Google Scholar]
- Arrighi R, Togoli I, Burr DC. A generalized sense of number. Proceedings of the Royal Society B. 2014;281(1797):20141791. doi: 10.1098/rspb.2014.1791. [DOI] [PMC free article] [PubMed] [Google Scholar]
- Bex PJ, Dakin SC. Spatial interference among moving targets. Vision Research. 2005;45(11):1385–1398. doi: 10.1016/j.visres.2004.12.001. [DOI] [PubMed] [Google Scholar]
- Bouma H. Interaction effects in parafoveal letter recognition. Nature. 1970;226(5241):177–178. doi: 10.1038/226177a0. [DOI] [PubMed] [Google Scholar]
- Brainard DH. The Psychophysics Toolbox. Spatial Vision. 1997;10(4):433–436. [PubMed] [Google Scholar]
- Burr D, Ross J. A visual sense of number. Current Biology. 2008;18(6):425–428. doi: 10.1016/J.Cub.2008.02.052. [DOI] [PubMed] [Google Scholar]
- Burr DC, Anobile G, Turi M. Adaptation affects both high and low (subitized) numbers under conditions of high attentional load. Seeing Perceiving. 2011;24(2):141–150. doi: 10.1163/187847511X570097. [DOI] [PubMed] [Google Scholar]
- Burr DC, Turi M, Anobile G. Subitizing but not estimation of numerosity requires attentional resources. Journal of Vision. 2010;10(6):20, 1–10. doi: 10.1167/10.6.20. [DOI] [PubMed] [Google Scholar]
- Cavanagh P, He S. Attention mechanisms for counting in stabilized and in dynamic displays. In: Dehaene S, Brannon EM, editors. Space, time and number in the brain. San Diego, CA: Academic Press; 2011. pp. 23–35. [Google Scholar]
- Dakin SC, Tibber MS, Greenwood JA, Kingdom FAA, Morgan MJ. A common visual metric for approximate number and density. Proceedings of the National Academy of Sciences of the United States of America. 2011;108(49):19552–19557. doi: 10.1073/Pnas.1113195108. [DOI] [PMC free article] [PubMed] [Google Scholar]
- Dehaene S. The number sense: How the mind creates mathematics (Rev. ed.) New York: Oxford University Press; 2011. [Google Scholar]
- Durgin FH. Texture density adaptation and the perceived numerosity and distribution of texture. Journal of Experimental Psychology: Human Perception and Performance. 1995;21(1):149–169. doi: 10.1037//0096-1523.21.1.149. [DOI] [Google Scholar]
- Durgin FH. Texture density adaptation and visual number revisited. Current Biology. 2008a;18(18):R855–856. R857–858. doi: 10.1016/j.cub.2008.07.053. author reply. [DOI] [PubMed] [Google Scholar]
- Durgin FH. Texture density adaptation and visual number revisited. Current Biology. 2008b;18(18):R855–R856. doi: 10.1016/J.Cub.2008.07.053. [DOI] [PubMed] [Google Scholar]
- Franconeri SL, Bemis DK, Alvarez GA. Number estimation relies on a set of segmented objects. Cognition. 2009;113(1):1–13. doi: 10.1016/J.Cognition.2009.07.002. [DOI] [PubMed] [Google Scholar]
- Greenwood JA, Bex PJ, Dakin SC. Positional averaging explains crowding with letter-like stimuli. Proceedings of the National Academy of Sciences, USA. 2009;106(31):13130–13135. doi: 10.1073/pnas.0901352106. [DOI] [PMC free article] [PubMed] [Google Scholar]
- Halberda J, Mazzocco MMM, Feigenson L. Individual differences in non-verbal number acuity correlate with maths achievement. Nature. 2008;455(7213):665–668. doi: 10.1038/Nature07246. [DOI] [PubMed] [Google Scholar]
- Harvey BM, Klein BP, Petridou N, Dumoulin SO. Topographic representation of numerosity in the human parietal cortex. Science. 2013;341(6150):1123–1126. doi: 10.1126/Science.1239052. [DOI] [PubMed] [Google Scholar]
- He LX, Zhang J, Zhou TG, Chen L. Connectedness affects dot numerosity judgment: Implications for configural processing. Psychonomic Bulletin & Review. 2009;16(3):509–517. doi: 10.3758/Pbr.16.3.509. [DOI] [PubMed] [Google Scholar]
- Jevons WS. The power of numerical discrimination. Nature. 1871;3:363–372. [Google Scholar]
- Knops A, Piazza M, Sengupta R, Eger E, Melcher D. A shared, flexible neural map architecture reflects capacity limits in both visual Short-term memory and enumeration. Journal of Neuroscience. 2014;34(30):9857–9866. doi: 10.1523/Jneurosci.2758-13.2014. [DOI] [PMC free article] [PubMed] [Google Scholar]
- Levi DM. Crowding–an essential bottleneck for object recognition: A mini-review. Vision Research. 2008;4(5):635–654. doi: 10.1016/j.visres.2007.12.009. [DOI] [PMC free article] [PubMed] [Google Scholar]
- Morgan MJ, Raphael S, Tibber MS, Dakin SC. A texture-processing model of the ‘visual sense of number’. Proceedings of the Royal Society B. 2014;281(1790) doi: 10.1098/rspb.2014.1137. [DOI] [PMC free article] [PubMed] [Google Scholar]
- Piazza M. Neurocognitive start-up tools for symbolic number representations. Trends in Cognitive Sciences. 2010;14(12):542–551. doi: 10.1016/J.Tics.2010.09.008. [DOI] [PubMed] [Google Scholar]
- Piazza M, Facoetti A, Trussardi AN, Berteletti I, Conte S, Lucangeli D, Zorzi M. Developmental trajectory of number acuity reveals a severe impairment in developmental dyscalculia. Cognition. 2010;116(1):33–41. doi: 10.1016/j.cognition.2010.03.012. [DOI] [PubMed] [Google Scholar]
- Piazza M, Pinel P, Le Bihan D, Dehaene S. A magnitude code common to numerosities and number symbols in human intraparietal cortex. Neuron. 2007;53(2):293–305. doi: 10.1016/j.Neuron.2006.11.022. [DOI] [PubMed] [Google Scholar]
- Ross J. Visual discrimination of number without counting. Perception. 2003;32(7):867–870. doi: 10.1068/P5029. [DOI] [PubMed] [Google Scholar]
- Ross J, Burr D. Number, texture and crowding. Trends in Cognitive Sciences. 2012;16(4):196–197. doi: 10.1016/j.tics.2012.01.010S1364-6613(12)00032-0. [pii] [DOI] [PubMed] [Google Scholar]
- Ross J, Burr DC. Vision senses number directly. Journal of Vision. 2010;10(2):10, 1–18. doi: 10.1167/10.2.10. [DOI] [PubMed] [Google Scholar]
- Stoianov I, Zorzi M. Emergence of a ‘visual number sense’ in hierarchical generative models. Nature Neuroscience. 2012;15(2):194–196. doi: 10.1038/Nn.2996. [DOI] [PubMed] [Google Scholar]
- Tibber MS, Greenwood JA, Dakin SC. Number and density discrimination rely on a common metric: Similar psychophysical effects of size, contrast, and divided attention. Journal of Vision. 2012;12(6):8, 1–19. doi: 10.1167/12.6.8. http://www.journalofvision.org/content/org/content/12/6/8 [DOI] [PubMed] [Google Scholar]
- Tibber MS, Manasseh GS, Clarke RC, Gagin G, Swanbeck SN, Butterworth B, Dakin SC. Sensitivity to numerosity is not a unique visuospatial psychophysical predictor of mathematical ability. Vision Research. 2013;89:1–9. doi: 10.1016/j.visres.2013.06.006. [DOI] [PMC free article] [PubMed] [Google Scholar]
- Toet A, Levi DM. The two-dimensional shape of spatial interaction zones in the parafovea. Vision Research. 1992;32(7):1349–1357. doi: 10.1016/0042-6989(92)90227-a. [DOI] [PubMed] [Google Scholar]
- Valsecchi M, Toscani M, Gegenfurtner KR. Perceived numerosity is reduced in peripheral vision. Journal of Vision. 2013;13(13):7, 1–16. doi: 10.1167/13.13.7. [DOI] [PubMed] [Google Scholar]
- van den Berg R, Roerdink JB, Cornelissen FW. On the generality of crowding: visual crowding in size, saturation, and hue compared to orientation. Journal of Vision. 2007;7(2):14, 1–11. doi: 10.1167/7.2.14. [DOI] [PubMed] [Google Scholar]
- Vetter P, Butterworth B, Bahrami B. Modulating attentional load affects numerosity estimation: Evidence against a pre-attentive subitizing mechanism. PLoS One. 2008;3(9):e3269. doi: 10.1371/journal.pone.0003269. [DOI] [PMC free article] [PubMed] [Google Scholar]
- Watson AB, Pelli DG. QUEST: A Bayesian adaptive psychometric method. Perception & Psychophysics. 1983;33(2):113–120. doi: 10.3758/bf03202828. [DOI] [PubMed] [Google Scholar]
- Whalen J, Gallistel CR, Gelman R. Nonverbal counting in humans: The psychophysics of number representation. Psychological Science. 1999;10(2):130–137. doi: 10.1111/1467-9280.00120. [DOI] [Google Scholar]
- Whitney D, Levi DM. Visual crowding: A fundamental limit on conscious perception and object recognition. Trends in Cognitive Sciences. 2011;15(4):160–168. doi: 10.1016/j.tics.2011.02.005S1364-6613(11)00032-5. [pii] [DOI] [PMC free article] [PubMed] [Google Scholar]
- Wilkinson F, Wilson HR, Ellemberg D. Lateral interactions in peripherally viewed texture arrays. Journal of the Optical Society of America. A, Optics, Image Science, and Vision. 1997;14(9):2057–2068. doi: 10.1364/josaa.14.002057. [DOI] [PubMed] [Google Scholar]
- Wutz A, Melcher D. The temporal window of individuation limits visual capacity. Frontiers in Psychology. 2014;5 doi: 10.3389/Fpsyg.2014.00952. [DOI] [PMC free article] [PubMed] [Google Scholar]


