The Os01T0156300 protein, a plant-specific DUF1110 protein from O. sativa, was expressed, purified and crystallized. An X-ray diffraction data set was collected from a native crystal to 1.84 Å resolution.
Keywords: plant-specific protein, PAMP-triggered immunity, interactor for OsPUB44, Os01T0156300, Oryza sativa, DUF1110
Abstract
The Os01T0156300 protein from Oryza sativa has been classified into the domain of unknown function (DUF) family DUF1110. DUF1110 family members exist in monocotyledons but not in dicotyledons, and share no sequence identity with proteins for which structures have been reported. In this study, the Os01T0156300 protein was crystallized using the hanging-drop vapour-diffusion method. X-ray diffraction data were collected to 1.84 Å resolution. The crystal belonged to space group P21, with unit-cell parameters a = 89.9, b = 89.8, c = 107.1 Å, β = 106.6°. The asymmetric unit was estimated to contain 6–11 molecules.
1. Introduction
The recognition of pathogen-associated molecular patterns (PAMPs) through cell-surface-localized pattern-recognition receptors (PRRs) initiates a series of plant immune responses (Jones & Dangl, 2006 ▸). A rice U-box-type ubiquitin E3 ligase, OsPUB44, positively regulates PAMP-triggered immunity downstream of PRRs (Ishikawa et al., 2014 ▸). To understand the molecular function of OsPUB44 in immunity, we identified OsPUB44-interacting protein 1 (PBI1; Os01T0156300) as an interactor for OsPUB44 (Kawasaki et al., in preparation). PBI1 contains a plant-specific uncharacterized domain, which belongs to the domain of unknown function (DUF) family identified as DUF1110. In addition to PBI1, rice possesses two additional DUF1110 proteins (Os01T0156400 and Os01T0157100). This family was originally found in the Poaceae (true grasses). It has now been found in nine species, including Setaria italica (foxtail millet; formerly known as Panicum italicum), Zea mays (maize), Sorghum bicolor (sorghum; also known as Sorghum vulgare), Brachypodium distachyon (purple false brome; also known as Trachynia distachya), Triticum aestivum (wheat), Oryza brachyantha, O. glaberrima (African rice), O. sativa subsp. japonica (rice) and O. sativa subsp. indica (rice).
The Pfam database (Finn et al., 2014 ▸) contains 56 different sequences belonging to the DUF1110 family. Although the DUF1110 proteins are conserved in plant species, their biological roles remain unclear. In addition, it is difficult to predict their structures because there are no homologous proteins with known structures deposited in the RCSB Protein Data Bank (PDB). Determining the structure of a DUF1110 family member should help us to understand their biological function.
2. Materials and methods
2.1. Macromolecular production
We prepared pCold GST vector (Hayashi & Kojima, 2008 ▸) containing a DNA fragment corresponding to Os01T0156300 and used this construct to transform E. coli Rosetta (DE3) cells. Table 1 ▸ summarizes the macromolecule-production information. Cells were grown at 310 K in lysogeny broth medium supplemented with 100 µg ml−1 ampicillin. Overexpression was induced by the addition of isopropyl β-d-1-thiogalactopyranoside (IPTG) to a final concentration of 0.4 mM when the optical density (OD) at 600 nm of the culture reached 0.6. Cells were incubated at 288 K for 16 h with shaking at 110 rev min−1, harvested by centrifugation and suspended in buffer consisting of 20 mM Tris–HCl pH 8.0, 200 mM NaCl, 1 mM dithiothreitol (DTT). The suspension was sonicated to disrupt the cells. After centrifugation of the lysate, the supernatant was loaded onto a Glutathione Sepharose 4B (GS4B) column (GE Healthcare), which was equilibrated with the same buffer (20 mM Tris–HCl pH 8.0, 200 mM NaCl, 1 mM DTT). The GS4B resin was washed with the same buffer and the protein was eluted with a glutathione-containing buffer (20 mM Tris–HCl pH 8.0, 200 mM NaCl, 1 mM DTT, 30 mM glutathione pH 8.0). The eluate (10 mg GST-tagged protein) was mixed with 80 units of HRV 3C protease and incubated at 277 K for 4 h to cleave the tag from the target protein. To remove glutathione, HRV 3C protease and the cleaved affinity tag, the target protein was purified using size-exclusion chromatography (SEC) on a Superdex 75 column (GE Healthcare) with a buffer consisting of 20 mM Tris–HCl pH 8.0, 150 mM NaCl, 1 mM DTT. The protein was re-chromatographed using the GS4B affinity column and the residual affinity tag was removed. The properties of the purified protein were evaluated using SEC, dynamic light scattering (DLS; Zetasizer Nano, Malvern), anion-exchange chromatography (HiTrap Q HP, GE Healthcare) and SDS–PAGE. For anion-exchange chromatography, the Os01T0156300 protein was applied onto a HiTrap Q HP column pre-equilibrated with buffer consisting of 20 mM bis-tris pH 6.0, 4 mM β-mercaptoethanol and eluted using an increasing concentration gradient of a buffer consisting of 20 mM bis–tris pH 6.0, 4 mM β-mercaptoethanol, 1 M NaCl.
Table 1. Macromolecule-production information.
The underlined amino-acid sequence indicates the glutathione S-transferase (GST) tag. The HRV 3C protease cleavage sites are between the Q and G residues shown in italics.
| Source organism | O. sativa |
| Expression vector | pCold GST |
| Expression host | E. coli Rosetta (DE3) |
| Complete amino-acid sequence | MNHKVHHHHHHIEGRHMSPILGYWKIKGLVQPTRLLLEYLEEKYEEHLYERDEGDKWRNKKFELGLEFPNLPYYIDGDVKLTQSMAIIRYIADKHNMLGGCPKERAEISMLEGAVLDIRYGVSRIAYSKDFETLKVDFLSKLPEMLKMFEDRLCHKTYLNGDHVTHPDFMLYDALDVVLYMDPMCLDAFPKLVCFKKRIEAIPQIDKYLKSSKYIAWPLQGWQATFGGGDHPPKSDLEVLF QG PGHMMAAEAWRSRFRERVVEAAERWESVGESLATALTHLKSPMHAGDEEEAAAARTRIQLAMGELVDASRNLASAMSLMKVAELLALHGGSVNPSTHLGEISLLGDQYLAERNAGIKLLEAGKDARKAYISVDGCRGNLDAILLLLDHPRVPCVDDFIEEELFVAGDNLQGAIGNAKLGTERAVGARQDVSGAN |
Selenomethionine-labelled (SeMet) Os01T0156300 protein was produced in order to use the single-wavelength anomalous dispersion (SAD) method for phasing. The pCold GST Os01T0156300 vector was used to transform E. coli Rosetta (DE3) cells. These cells were grown at 310 K in M9 medium supplemented with 100 µg ml−1 ampicillin. When the OD at 600 nm of the culture reached 0.3, the amino acids lysine, phenylalanine and threonine at 100 µg ml−1, isoleucine, leucine and valine at 50 µg ml−1 and l-selenomethionine at 60 µg ml−1 were added to block methionine biosynthesis (Doublié, 1997 ▸). Target-protein production was induced by adding IPTG to a final concentration of 0.4 mM when the OD at 600 nm of the culture reached 0.6. Cells were incubated at 288 K for 16 h with shaking at 110 rev min−1. Target-protein purification was achieved using the same protocol as used for the native target protein.
2.2. Crystallization
The Os01T0156300 protein was dialyzed against buffer consisting of 20 mM Tris–HCl pH 8.0, 1 mM DTT. The purified protein was concentrated to 10 mg ml−1. The protein concentration was determined using ultraviolet (UV) absorption measurements at 280 nm. The hanging-drop vapour-diffusion method was used for crystallization. Drops consisting of 1 µl protein solution and 1 µl reservoir solution were suspended over 0.5 ml reservoir solution at 277 K. Crystal Screen 2, PEG/Ion 2, PEGRx 1 and PEGRx 2 (Hampton Research) were used as reservoir solutions. Needle-shaped crystals were obtained in a condition containing polyethylene glycol (PEG) and sodium citrate. On optimization of the reservoir conditions, the Os01T0156300 protein formed rod-shaped crystals with dimensions of about 100 × 300 × 50 µm within 5 d using a reservoir solution consisting of 8%(w/v) PEG 8000, 0.1 M HEPES pH 7.0, 0.2 M sodium citrate. Crystals were sequentially transferred to 24%(v/v) glycerol in reservoir buffer using 2% increments and were then flash-cooled in liquid nitrogen. Details of the crystallization are summarized in Table 2 ▸.
Table 2. Crystallization of the Os01T0156300 protein.
| Method | Hanging-drop vapour diffusion |
| Plate type | 24-well plates |
| Temperature (K) | 277 |
| Protein concentration (mg ml−1) | 10 |
| Buffer composition of protein solution | 20 mM Tris–HCl pH 8.0, 1 mM DTT |
| Composition of reservoir solution | 8% PEG 8000, 0.1 M HEPES pH 7.0, 0.2 M sodium citrate |
| Volume and ratio of drop | 1 µl:1 µl |
| Volume of reservoir (ml) | 0.5 |
2.3. Data collection and processing
Diffraction data sets were collected at 100 K using an MX300HE (Rayonix) charge-coupled device (CCD) detector on the BL44XU beamline at SPring-8, Harima, Japan. The crystal-to-detector distance was 250 mm. The data set for the native crystal was obtained at a wavelength of 0.9 Å. 190 oscillations of 0.6° were collected with an exposure time of 1 s. Reflections were integrated and scaled using the HKL-2000 software package (Otwinowski & Minor, 1997 ▸). Data-collection and processing statistics are shown in Table 3 ▸.
Table 3. Data collection and processing for the Os01T0156300 protein (OsPBI1).
Values in parentheses are for the outer shell.
| Native OsPBI1 | SeMet OsPBI1 | |
|---|---|---|
| Diffraction source | BL44XU, SPring-8 | BL44XU, SPring-8 |
| Wavelength (Å) | 0.90000 | 0.97894 |
| Temperature (K) | 100 | 100 |
| Detector | MX300HE | MX300HE |
| Crystal-to-detector distance (mm) | 250 | 250 |
| Rotation range per image (°) | 0.6 | 1 |
| Total rotation range (°) | 190 | 185 |
| Exposure time per image (s) | 1 | 1 |
| Space group | P21 | P21 |
| a, b, c (Å) | 89.93, 89.78, 107.09 | 90.18, 89.76, 107.92 |
| α, β, γ (°) | 90, 106.6, 90 | 90, 106.7, 90 |
| Mosaicity (°) | 0.26 | 0.43 |
| Resolution range (Å) | 50.0–1.84 (1.87–1.84) | 50.0–2.12 (2.16–2.12) |
| Total No. of reflections | 570139 | 613163 |
| No. of unique reflections | 141131 | 92035 |
| Completeness (%) | 98.0 (97.3) | 98.0 (97.3) |
| Multiplicity | 4.1 (4.2) | 4.1 (4.0) |
| 〈I/σ(I)〉 | 34.3 (3.7) | 47.8 (7.0) |
| R merge † | 0.050 (0.418) | 0.080 (0.394) |
| Overall B factor from Wilson plot (Å2) | 25.0 | 30.9 |
R
merge = 
 , where Ii(hkl) is the ith observed intensity of reflection hkl and 〈I(hkl)〉 is the mean measurement.
3. Results and discussion
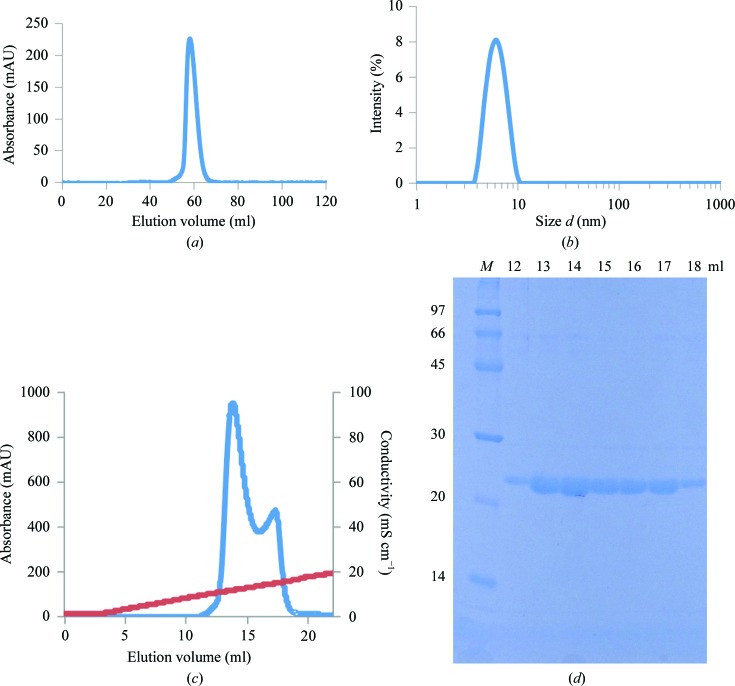
The calculated molecular weight (MW) of the Os01T0156300 protein, which consisted of 195 amino acids after HRV 3C protease cleavage, was 20.8 kDa. The position of its SEC elution peak suggested a MW of 31.4 kDa (Fig. 1 ▸ a and Supplementary Fig. S1). DLS measurements suggested a MW of 56.1 ± 15.6 kDa (Fig. 1 ▸ b). The molecular sizes obtained by SEC and DLS were different. Because the Os01T0156300 protein was purified to a single band on an SDS–PAGE gel, this discrepancy between the MW analyses by SEC and DLS could be because of self-association.
Figure 1.
(a) Size-exclusion chromatogram of the Os01T0156300 protein using a Superdex 75 column. The estimated MW was 31.4 kDa. (b) Size distribution of 2 mg ml−1 Os01T0156300 protein using a Zetasizer Nano ZS at 293 K. The estimated MW was 56.1 ± 15.6 kDa. (c) Anion-exchange chromatogram of the Os01T0156300 protein. (d) SDS–PAGE after anion-exchange chromatography. Elution volumes are shown for the first (12–15 ml) and second (16–18 ml) peaks of the anion-exchange chromatogram. Lane M contains molecular-weight markers (labelled in kDa).
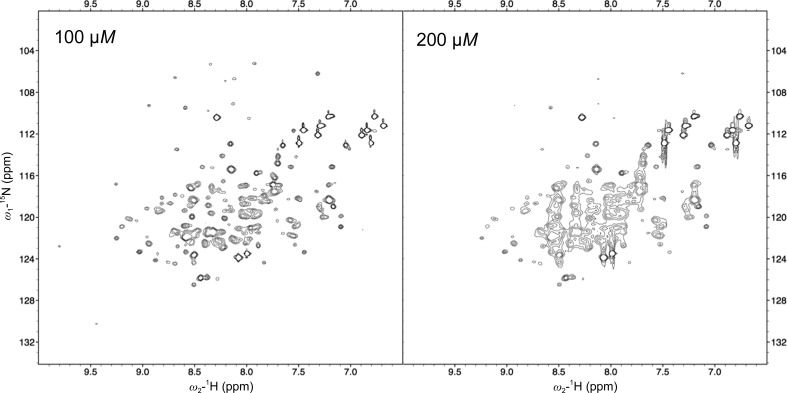
In an effort to evaluate the concentration dependence of this self-association, 1H–15N HSQC spectra were measured at protein concentrations of 50, 100 and 200 µM. A broader spectrum was observed at 200 µM compared with 50 and 100 µM (Fig. 2 ▸). The concentration dependence of SEC showed that a shoulder peak appeared to the higher MW side at high concentration (Supplementary Fig. S2). These results suggest a tendency of the protein to self-associate. To characterize the Os01T0156300 protein, anion-exchange chromatography was used. Two peaks were observed (Figs. 1 ▸ c and 1 ▸ d), and one of the peaks was re-chromatographed using the anion-exchange column 1 d later. Two peaks similar to those seen in the initial chromatography were observed during the second chromatography. The MWs of the proteins from each peak were the same (20.4 kDa), as determined using matrix-assisted laser desorption/ionization time-of-flight mass spectrometry (MALDI-TOF MS) and SDS–PAGE. Furthermore, DLS did not show any difference between the proteins in the two peaks. Taken together, these results imply that the Os01T0156300 protein tends to associate at high concentration.
Figure 2.
1H–15N HSQC spectrum of 100 µM (left) and 200 µM (right) Os01T0156300 protein at 298 K using a Bruker Avance III HD 800 MHz spectrometer equipped with a 1H/13C/15N TXI CryoProbe (Bruker BioSpin). Uniformly 15N-labelled Os01T0156300 protein was prepared in buffer consisting of 10 mM HEPES pH 7.5, 1 mM DTT, 10% D2O. The spectrum was processed using the NMRPipe software package (Delaglio et al., 1995 ▸).
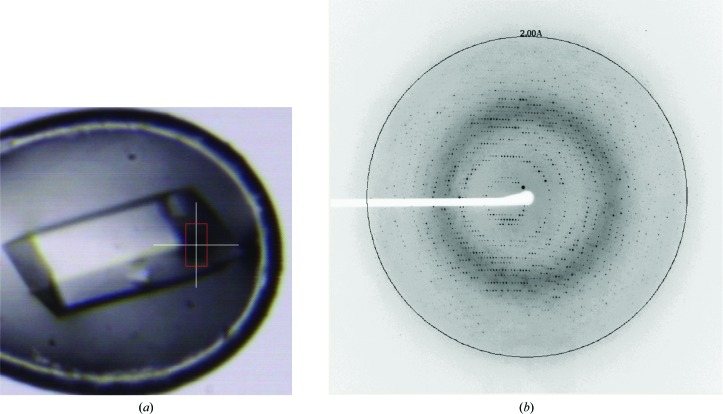
The three-dimensional structure of the Os01T0156300 protein is not currently known. In this study, crystals of the Os01T0156300 protein were obtained in order to determine its structure, which should help in ascribing its biological function. The rod-shaped crystal has dimensions of about 100 × 300 × 50 µm (Fig. 3 ▸ a). The Os01T0156300 protein crystal, which belonged to space group P21, diffracted to 1.84 Å resolution (Fig. 3 ▸ b). The unit-cell parameters of the crystal were a = 89.9, b = 89.8, c = 107.1 Å, β = 106.6°. The calculated Matthews coefficient (Matthews, 1968 ▸) was in the range 1.81–3.32 Å3 Da−1, with a solvent content of 32–63%. This indicates that 6–11 molecules were present in the asymmetric unit. In an effort to find higher noncrystallographic symmetry, self-rotation functions were calculated by MOLREP (Vagin & Teplyakov, 2010 ▸) from CCP4 (Winn et al., 2011 ▸) in the resolution range 20.0–4.0 Å. The self-rotation map showed noncrystallographic twofold axes on the χ = 180° section and threefold axes on the χ = 120° section (Supplementary Fig. S3). According to the self-rotation function, six molecules are most likely to be present in the asymmetric unit. Processing to determine appropriate phasing is currently in progress. Further work is required to reveal the structure and function of the Os01T0156300 protein.
Figure 3.
(a) A crystal of Os01T0156300 protein. The white cross bar is 100 µm in length. (b) A diffraction image (0.6° oscillation) from a Os01T0156300 protein crystal. The diffraction spots extended to 1.84 Å resolution. The 2.00 Å resolution ring is shown.
Supplementary Material
Supporting Information: Supplementary Figures.. DOI: 10.1107/S2053230X16007573/tb5098sup1.pdf
Acknowledgments
We thank Dr T. Sugiki and Dr R. Yonehara for NMR and DLS measurements, respectively. The synchrotron-radiation experiments were performed at BL44XU of SPring-8 with the approval of the Japan Synchrotron Radiation Research Institute (Proposal No. 2015A6500). This research is supported in part by KAKENHI, the Platform Project for Supporting Drug Discovery and Life Science Research, and AMED-CREST from MEXT and AMED.
References
- Delaglio, F., Grzesiek, S., Vuister, G. W., Zhu, G., Pfeifer, J. & Bax, A. (1995). J. Biomol. NMR, 6, 277–293. [DOI] [PubMed]
- Doublié, S. (1997). Methods Enzymol. 276, 523–530. [PubMed]
- Finn, R. D., Bateman, A., Clements, J., Coggill, P., Eberhardt, R. Y., Eddy, S. R., Heger, A., Hetherington, K., Holm, L., Mistry, J., Sonnhammer, E. L. L., Tate, J. & Punta, M. (2014). Nucleic Acids Res. 42, D222–D230. [DOI] [PMC free article] [PubMed]
- Hayashi, K. & Kojima, C. (2008). Protein Expr. Purif. 62, 120–127. [DOI] [PubMed]
- Ishikawa, K., Yamaguchi, K., Sakamoto, K., Yoshimura, S., Inoue, K., Tsuge, S., Kojima, C. & Kawasaki, T. (2014). Nature Commun. 5, 5430. [DOI] [PubMed]
- Jones, J. D. G. & Dangl, J. L. (2006). Nature (London), 444, 323–329. [DOI] [PubMed]
- Matthews, B. W. (1968). J. Mol. Biol. 33, 491–497. [DOI] [PubMed]
- Otwinowski, Z. & Minor, W. (1997). Methods Enzymol. 276, 307–326. [DOI] [PubMed]
- Vagin, A. & Teplyakov, A. (2010). Acta Cryst. D66, 22–25. [DOI] [PubMed]
- Winn, M. D. et al. (2011). Acta Cryst. D67, 235–242.
Associated Data
This section collects any data citations, data availability statements, or supplementary materials included in this article.
Supplementary Materials
Supporting Information: Supplementary Figures.. DOI: 10.1107/S2053230X16007573/tb5098sup1.pdf


