

Abstract
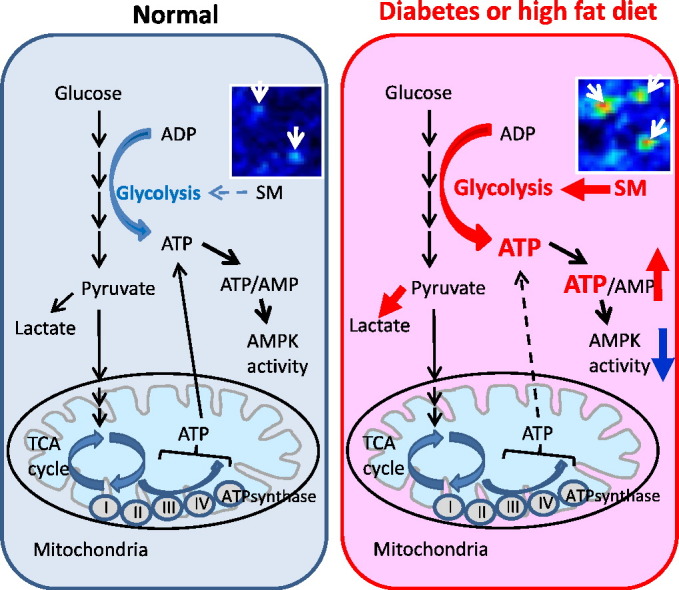
AMP-activated protein kinase (AMPK) is suppressed in diabetes and may be due to a high ATP/AMP ratio, however the quantitation of nucleotides in vivo has been extremely difficult. Via matrix-assisted laser desorption/ionization mass spectrometry imaging (MALDI-MSI) to localize renal nucleotides we found that the diabetic kidney had a significant increase in glomerular ATP/AMP ratio. Untargeted MALDI-MSI analysis revealed that a specific sphingomyelin species (SM(d18:1/16:0)) accumulated in the glomeruli of diabetic and high-fat diet-fed mice compared with wild-type controls. In vitro studies in mesangial cells revealed that exogenous addition of SM(d18:1/16:0) significantly elevated ATP via increased glucose consumption and lactate production with a consequent reduction of AMPK and PGC1α. Furthermore, inhibition of sphingomyelin synthases reversed these effects. Our findings suggest that AMPK is reduced in the diabetic kidney due to an increase in the ATP/AMP ratio and that SM(d18:1/16:0) could be responsible for the enhanced ATP production via activation of the glycolytic pathway.
Keywords: Matrix-assisted laser desorption/ionization mass spectrometry imaging, Sphingomyelin, Chronic kidney disease, ATP, AMPK, Glycolysis
Graphical abstract
Highlights
-
•
MALDI-MSI revealed an increase in glomerular ATP/AMP ratio in the diabetic kidney.
-
•
SM(d18:1/16:0) is increased in the glomeruli of diabetic and high-fat diet-fed mice.
-
•
SM(d18:1/16:0) stimulated ATP production via enhanced aerobic glycolysis and reduced AMPK activity in mesangial cells.
AMPK is known to be suppressed in states of high ATP/AMP ratio but the measurement of nucleotides in vivo has been difficult. Miyamoto et al. utilize matrix-assisted laser desorption/ionization mass spectrometry imaging (MALDI-MSI) to investigate the distribution of nucleotides and find an increase in glomerular ATP/AMP ratio in the diabetic kidney. Untargeted MALDI-MSI revealed that sphingomyelin(d18:1/16:0) is accumulated in the glomeruli of diabetic and high-fat diet-fed mice compared with controls. Sphingomyelin(d18:1/16:0) promotes ATP production in mesangial cells via activation of the glycolytic pathway. The inhibition of sphingomyelin(d18:1/16:0) synthesis may lead to novel therapeutic targets for the treatment of caloric-induced CKD.
1. Introduction
With the increasing number of diabetic patients, the frequency of chronic kidney disease (CKD) and end-stage renal disease (ESRD) continues to increase worldwide (Miyamoto and Sharma, 2013). The progression of CKD is associated with an increase in hypertension, diabetes, and cardiovascular disease (Collins et al., 2010). In spite of recent advances in the treatment and prevention of both CKD and diabetes, diabetic patients remain at high risk for ESRD (Rosolowsky et al., 2011), and the existing therapies for the diabetic kidney disease are insufficient. To develop breakthroughs for new insights into human diabetic kidney disease we recently evaluated cohorts of patients with diabetes with and without overt kidney disease using a rigorous quantitative urine metabolomics approach (Sharma et al., 2013). We found that 12 mitochondria-associated metabolites were consistently and significantly reduced in urine from patients with diabetic kidney disease compared with patients with diabetes and intact renal function. These results and the recent recognition of the roles of reduced AMP-activated protein kinase (AMPK)–PGC1α pathway in diabetic kidneys from humans and animal models suggested that suppression of AMPK activity may be a unifying metabolic response to diabetes resulting in reduced mitochondrial activity, reduced mitochondrial biogenesis, and organ failure in diabetic kidney disease (Dugan et al., 2013, Kang et al., 2015). A fundamental question that has emerged is why is AMPK activity reduced in the diabetic kidney? Although non-invasive biomarker approaches have provided many novel insights in our understanding toward diabetic kidney disease (Sharma et al., 2013), metabolomics analysis of body fluids will not provide the spatial distribution of metabolites that could potentially improve our understanding to key fundamental questions.
AMPK is a master cellular energy sensor that is normally activated in states of caloric depletion (low ATP/high AMP) (Hardie, 2011). Renal AMPK activity is reduced in the kidneys of humans with diabetic kidney disease (DKD), mouse models of DKD (Akita and streptozotocin-induced diabetic mice), and high-fat diet (HFD)-fed mice (Decleves et al., 2011, Dugan et al., 2013, Kidokoro et al., 2013). Although stimulation of AMPK has repeatedly been found to be beneficial, the basis for reduced AMPK activity remains unclear. The most obvious explanation would be that there would be an increase in the ATP/AMP ratio in the diabetic kidney leading to suppression of AMPK activity. However, it is extremely difficult to accurately quantitatively and spatially assess ATP, AMP and ADP in tissues ex vivo since ATP hydrolyzes rapidly during tissue handling and AMP is of very low abundance. One approach to address this question is to assess the levels of these nucleotides by mass spectrometry imaging (MSI) using fresh frozen kidney tissues immediately after harvest.
Recent progress in the field of matrix-assisted laser desorption/ionization mass spectrometry imaging (MALDI-MSI) has shed light on understanding the distribution of analytes in various tissues. MALDI-MSI is a powerful tool that can determine the distribution of hundreds of ionized analytes based on their molecular masses in a single measurement and enables the acquisition of multiple images as 2-dimensional (D) and 3-D ion density maps (Walch et al., 2008, Watrous et al., 2013). MALDI-MSI enables the visualization of individual molecules on tissue sections, without antibodies, staining, or complicated pretreatment steps. Thus, MALDI-MSI may be a suitable tool for investigating the distribution of analytes in kidney tissues without major processing that could interfere with relevant in vivo regulation of metabolites. MALDI-MSI requires a matrix, a small acidic aromatic molecule that absorbs energy at the wavelength of the irradiating laser (Walch et al., 2008). By applying matrix onto the tissue sections using either sprayer or sublimation, the analytes are extracted from the tissue and form co-crystals with matrix. As the size of the co-crystals is one of the important determinants of spatial resolution, especially in the high resolution MSI analysis, particle size of matrix should be as small as possible. In addition, it is crucial to deposit matrix homogeneously across the tissue section without any migration of analytes (Collins et al., 2010). The matrix-coated slide is then submitted to very short laser pulses which allow optimal desorption and ionization of the analytes, and ionized analytes are detected and classified by the difference of mass-to-charge ratio (m/z) (Walch et al., 2008). It has been reported that MALDI-MSI can be an applicable method for the accurate quantification of nucleotides in tissue sections (Hattori et al., 2010), thus we applied Fourier transform ion cyclotron resonance (FTICR)-MALDI-MSI at high spatial resolution to localize ATP, AMP, and ADP in the kidney microstructure of wild-type (WT) and diabetic mice. For the screening of metabolites and lipids that regulate renal nucleotide levels, we performed untargeted MALDI-MSI followed by the identification by the ambient ionization interfaced with a microscope and mass spectrometry (AMM). We demonstrated that one of the sphingomyelin (SM) species may play a key role in the regulation of ATP levels and the AMPK pathway.
2. Material and Methods
2.1. Materials
Cell culture and transfection regents were purchased from Life technologies (Grand Island, NY). p-AMPKT172 and AMPKα antibodies were purchased from Cell Signaling Technology (Danvers, MA). ASM (H-181), N-SMase2 (H-195), SMS1 (H-130) (for immunohistochemistry), SMS2 (N-13), Smad3 (38-Q), TGFβ1 (V) and rabbit anti-goat IgG-HRP antibodies were purchased from Santa Cruz Biotechnology (Santa Cruz, CA). SGMS1 (SMS1) antibody for western blot was purchased from Aviva Systems Biology (San Diego, CA). Anti-PGC1α and anti-Smad3 (phospho S423 + S425) antibodies were purchased from Abcam (San Francisco, CA). Monoclonal anti-actin antibody was purchased from Sigma-Aldrich (St. Louis, MO). Biotin-XX goat anti-rabbit IgG (H + L) were purchased from Life technologies. Donkey anti-rabbit IgG-HRP and sheep anti-mouse IgG-HRP antibodies, and all siRNAs were purchased from GE Healthcare (Chicago, IL, USA). 2-Deoxy-d-glucose (2-DG) was purchased from Sigma-Aldrich.
2.2. Animal Studies
All mice were purchased from Jackson Laboratory (Bar Harbor, ME). Mice were given standard rodent chow and water ad libitum. To study the effect of high fat diet, 7-week-old male C57BL/6J mice were fed a HFD (60% of total calories from fat, 20% protein, 20% carbohydrate) (Research Diets, New Brunswick, NJ) or standard diet (STD) (5% fat, 24.5% protein) for a period of 1 week before harvesting kidneys. For the measurement of plasma SM(d18:1/16:0), six-week-old male C57BL/6J mice were fed a HFD or STD for a period of 14 weeks before being euthanized at 20 weeks of age. To study the effect of type 1 diabetes, male diabetic Akita (C57BL/6J-Ins2Akita) mice and age-matched C57BL/6J WT mice were studied at 23 week-aged. Mice were euthanized by cervical dislocation. All animal studies were approved by the Institutional Animal Care and Use Committee of University of California, San Diego.
2.3. Human Subjects
Normal kidney tissues were obtained from fresh tissues obtained from renal cell cancer nephrectomy specimens and only non-involved portions renal cell cancer were used. The signed informed consent was obtained from human subjects and the study protocol was approved by the institutional review board from the University of Pennsylvania.
2.4. FTICR-MALDI-MSI for Nucleotide Analysis
Kidney tissues were obtained from 23 week-aged male diabetic Akita (C57BL/6J-Ins2Akita) mice and age-matched C57BL/6J control mice (n = 3/group). Snap frozen kidneys were quickly embedded in carboxymethyl cellulose (CMC) and sectioned (10 μm), and then thaw mounted onto an ITO glass slide. 9-AA (9-aminoacridine) (10 mg/mL in MeOH) was used as a MALDI matrix and applied by the SunCollect System (SunChrom, Friedrichsdorf, Germany). Just after matrix application, FTICR-MALDI-MSI was performed in negative ion mode using a SolariX MALDI-FTICR 7.0T Mass Spectrometer (Bruker Daltonics, MA) equipped with a Smartbeam II laser used at a repetition rate of 1 kHz. Mass spectra were acquired in the 100–700 m/z range in negative detection mode. The mass spectrum obtained for each position of the images corresponds to the averaged mass spectra of 300 consecutive laser shots on the same location with a time domain of 1MWord, subsequent single zero filling and sine wave apodization. An ICR noise threshold was fixed at 0.97 for imaging acquisition. Two image raster sizes were selected for whole kidney imaging at 70 μm and for high spatial resolution imaging of glomerular region at 30 μm. FTMSControl 3.0 and FlexImaging 3.2 software packages (Bruker Daltonics, Bremen, Germany) were used to control the mass spectrometer and set imaging parameters. The visualization and statistical analysis of imaging data were performed using MultImaging 1.0 software (ImaBiotech, Lille, France). For the detection of glomeruli, the localization of a phosphatidic acid (PA (36:1)) was used as a contrast ion as described previously by (Grove et al. (2014), and regions of interest (ROIs) for glomeruli were drawn on the MS images. Fifteen glomeruli per animal were used for the analysis. For the determination of cortical tubular and medullary regions, phosphatidylinositol (PI (40:4)) and sulfatide (ST 42:1 (OH)) were used as contrast ions, respectively (Muller et al., 2015). Periodic acid-Schiff (PAS) staining was performed on adjacent section of each fresh kidney tissue used for MALDI imaging acquisition and scanned using a 40 × magnification objective on an Olympus IX18 microscope (Olympus, Germany). Scans were then integrated in the MultImaging software for a co-registration with imaging data to accurately correlate the distribution of molecular species with kidney histological regions.
2.5. Sample Preparation and MALDI-MSI Analysis
Kidney samples for MALDI-MSI were prepared and analyzed as previously described (Rath et al., 2012) with slight modifications. Briefly, frozen mouse kidney (− 80 °C) was cut in half, and a small piece (~ 1 cm) of human kidney cortex was cut out from surface of the frozen human kidney. These tissues were affixed to the chuck in a Leica CM1850 cryostat with a minimal amount of O.C.T. (Sakura Finetek, Torrance, CA). To avoid O.C.T. signals, O.C.T. was used as a glue and did not touch the regions that were being sectioned. Twelve μm thick sections were affixed to cold ITO-coated conductive glass slides (Bruker Daltonics). Sample slides were then placed in a vacuum desiccator above a bed of fresh dry-rite. The desiccator was kept cold in a cooler of dry ice, which was allowed to evaporate over 12 h. The samples were dried for an additional 12 h after the dry ice had evaporated. Sample slides were then coated with 2,5-dihydroxybenzoic acid (DHB) (Sigma-Aldrich, St. Louis, MO). DHB was applied in a sublimation chamber at 50 Torr for 9 min at 110 °C. Samples were rehydrated in a humidity chamber at 45 °C for 3 min. Two mice were examined from each sample condition, and only results common across both animals were reported. MALDI-MSI experiments were performed on a Bruker Autoflex Speed TOF/TOF instrument. Mass calibration and tuning was performed with a Peptide calibration standard (Bruker Daltonics) in the quadratic mode. For general analysis (reflectron positive mode), the following settings were used: raster width 90 μm, laser size large, laser offset 62%, laser range 38%, laser power 63%, laser frequency 500 Hz (tissue sections), laser summed shots 256 total at 32 shots on random walk, mass range m/z 0 to m/z 4000. For high resolution analysis (reflectron positive mode), the following settings were used: raster width 25 μm, laser size large, laser offset 62%, laser range 38%, laser power 70%, laser frequency 125 Hz (tissue sections), laser summed shots 32 total at 16 shots on random walk, mass range m/z 0 to m/z 4000. Data analysis was performed in Bruker Daltonics FlexImaging 3.0. For the detection of glomeruli, the sections used for MALDI-imaging acquisition were stained with hematoxylin and eosin (H&E) and then examined by a BZ-9000 microscope (KEYENCE, Itasca, IL).
2.6. AMM Analysis
Ambient ionization interfaced with a microscope and mass spectrometry (AMM) were used for the identification of lipids as previously described in detail (Hsu et al., 2013). Using this approach, we were able to obtain MS and MS/MS data for in situ molecular identification. Briefly, nanoDESI is set up on the same x–y movable platform that is used to position the microscope. The fused silica capillary tubes of the nanoDESI are mounted on the independent x–y–z linear actuator for accurate alignment. The conjunct terminals of the two capillary tubes are flame-pulled to shrink the size of the capillary to ∼ 60 μm (outer diameter). The sample was placed steady on a z-axis actuator, which is fixed onto the x–y stage of the microscope that is used to adjust the coordinate of the sample (relative to the nanoDESI liquid junction). The instrument was first tuned to m/z 816.3 using 2 μM bovine cytochrome c 0.1% formic acid aqueous solution. Ion spectra were recorded in real-time once the contact was made between samples and liquid junction. High-resolution FTICR-MS detection was performed using a maximum ion accumulation time of 4000 ms, with an average of 100–1000 ms per scan at 50,000 resolution. At a flow rate on a milliliter per minute scale, MS signals from molecules on the tissue sections decay within a few minutes; therefore this relatively lower resolution was selected for faster scan. A 1000 ms maximum ion accumulation time was used for low-resolution linear trap quadrupole (LTQ) detection. The top-down MS/MS analysis was performed using a collision energy of 30% and an activation Q of 0.200 for both LTQ (isolation Δm/z = 3) and FTICR (isolation Δm/z = 8) detections. MS/MS ion intensity of multiple sample points was accumulated to increase the signal-to-noise ratio. Identification of lipids was assisted with metabolomic and lipidomic databases, including METLIN (Smith et al., 2005) and LIPID MAPS (Fahy et al., 2007).
2.7. Quantification of Glomerular Size and Mesangial Matrix
PAS-stained sections were analyzed as described previously with slight modifications (Miyamoto et al., 2012). To evaluate the glomerular size and mesangial matrix area, 15 randomly selected glomeruli were analyzed using i-solution software (Advanced Imaging Concepts, Princeton, NJ). Quantitative analysis was performed in a blinded manner.
2.8. Procedures for Immunohistochemistry
ASM (aSMase), N-SMase2, SMS1, SMS2 immunoperoxidase staining were performed using the method as described previously (Miyamoto et al., 2012). As primary antibodies, polyclonal antibody against ASM (1:500), N-SMase2 (1:500), SMS1 (1:500) and SMS2 (1:500) were applied for 12 h at 4 °C, and biotin-XX goat anti-rabbit IgG (H + L) (1:200) or biotin-XX rabbit anti-goat IgG (H + L) (1:200) secondary antibody were applied for 1 h at room temperature. To evaluate intraglomerular ASM, N-SMase2, SMS1 and SMS2 positive cells, we examined 15 randomly selected glomeruli per mouse (n = 3/group) under high magnification (× 400). Quantitative analysis for all staining was performed in a blinded manner.
2.9. Cell Culture
The present studies were performed with a murine mesangial cell (MMC) line, as previously described (Ziyadeh et al., 1994). Cells were originally isolated from kidneys of SJL/J(H-2s) normal mice and transformed with non-capsid-forming Simian Virus 40 to establish a permanent cell line (Wolf et al., 1992). Cells were cultured at 37 °C with 5% CO2/95% air and maintained in Dulbecco's modified essential medium (DMEM) containing 5.5 mM d-glucose, 10% FBS, 100 units/mL penicillin, 100 mg/mL streptomycin, and 2 mM supplemental glutamine. Cells were passaged every 72 h. For western blot studies, MMCs were plated in 10 cm cell plates, after 50% confluence, the cell culture media were replaced with serum-free DMEM, and then incubated for 24 h before addition of liposome or vehicle solutions. For ATP measurements, MMCs were plated in 96-well cell plates, after 50% confluence, the cell culture media were replaced with serum-free DMEM, and then incubated for 24 h before addition of liposome solutions. Glucose, lactate and l-glutamine levels were measured by the 2900 Biochemistry Analyzer (YSI Inc. Yellow Springs, OH).
2.10. siRNA Transfection of MMCs
Transfection of MMCs with SMS1 and SMS2 siRNA was performed using a Lipofectamine RNAiMAX transfection reagent according to the manufacturer's instructions. Briefly, MMCs were plated in 96-well (for ATP measurement) or 6-well (for immunoblot) cell plates, after 30–40% confluence, MMCs were washed with Dulbecco's Phosphate-Buffered Saline (DPBS) and transfected with different siRNAs in serum-free DMEM. A negative control siRNA pool, which does not interfere with any known cellular mRNA was used simultaneously. After incubation with each siRNA (25 nM) solution for 24 h, MMCs were washed and treated with liposomes or vehicle, then incubated in serum-free DMEM for additional 24 h. At 48 h after transfection of siRNAs, MMCs in 96-well plate were used for ATP measurement and MMCs in 6-well plates were harvested for immunoblot.
2.11. Preparation of Liposomes
1,2-Dioleoyl-sn-glycero-3-phosphoethanolamine (DOPE), 1,2-dioleoyl-3-trimethylammonium-propane, chloride salt (DOTAP), and N-palmitoyl-d-erythro-sphingosylphosphorylcholine (SM(d18:1/16:0)) were purchased from Avanti Polar Lipids, Inc. (Alabaster, AL, USA). 1,1′-Dioctadecyl-3,3,3′,3′-tetramethylindotricarbocyanine iodide (“DiR”; DiIC18(7)) was purchased from Invitrogen (Eugene, OR, USA) and used for the efficient delivery of SM into cells (Kleusch et al., 2012). Liposomes were prepared as previously described with slight modifications (Kleusch et al., 2012). Briefly, DOPE, DOTAP, DiR and SM were mixed in chloroform in a weight ratio of DOPE/DOTAP/DiR/SM of 1/1/0.02/0.08. The mixture without SM was also prepared for control liposome. Lipid mixtures were dried under a gentle stream of nitrogen, and then remaining chloroform was completely evaporated under a vacuum for 12 h. Lipids were then hydrated with 20 mM HEPES buffer (Sigma-Aldrich) and final SM concentration was adjusted to 0.08 mg/mL (final DiR concentration; 0.02 mg/mL). The solution was vortexed for 5 min, and then sonicated in a bath sonicator for 20 min to make liposome stock solutions. For membrane fusion experiments, liposome stock solution was diluted 1:100 with serum-free DMEM medium, and then incubated with MMCs for 15 min at 37 °C. Subsequently, the fusion mixture was replaced by fresh serum-free DMEM medium. At 24 h after incubation with liposome whole cell protein was isolated.
2.12. Immunoblotting
Cell lysates were prepared using RIPA buffer (Cell signaling) according to the manufacturer's instructions. Total protein concentration was determined using BCA Protein Assay Kit (Life technologies). Thirty microgram protein per well were loaded on a 4–12% Bis-Tris Gel (Life technologies) and transferred to a nitrocellulose (Life technologies) or PVDF (EMD Millipore, Billerica, MA) membrane. The blot was blocked with 5% nonfat dry milk (Cell signaling) and incubated with primary antibodies at 4 °C for overnight. Then, secondary antibodies were applied and the signals were developed with SuperSignal™ West Pico Chemiluminescent Substrate (Life technologies). As primary antibodies, anti-pAMPKα, AMPKα, ASM (H-181), TGFβ1 (V) and SMS2 (N-13) were used at 1:500 dilution. Anti-SGMS1 (SMS1), p-Smad3, Smad3 (38-Q) and PGC1α were used at 1:1000 dilution. Anti-β-actin was used at 1:2500 dilution.
2.13. Phenol–chloroform Extraction of Nucleotides From Kidney Cortex
Nucleotide extraction was performed as previously described with minor modifications (Chida and Kido, 2014). In brief, 50 mg of freshly excised kidney cortex (outside one-third of the kidney) was minced into fine pieces with a razor blade and homogenized in 3 mL ice-cold Phenol-TE saturated (Sigma). The homogenate (500 μL) was combined with chloroform (200 μL) and water (150 μL), vortexed and centrifuged at 15,000g for 10 min. The aqueous layer containing nucleotides was separated carefully and frozen at − 80 °C until further use. Samples were diluted with water (1:50) and DNA concentration was determined prior to quantification of adenine nucleotide content.
2.14. ATP and ADP Measurement
ATP and ADP levels were measured by ApoSENSOR™ ADP/ATP Ratio Bioluminescence Assay Kit (BioVision, Inc., Milpitas, CA) according to the manufacturer's instructions.
2.15. SM Analysis for Renal Venous and Arterial Plasma Samples
Male C57BL/6J mice fed a HFD or STD for 14 weeks were used. At time of harvest (20 week-age), blood samples were drawn from the carotid artery under anesthesia and plasma samples were collected. Plasma SM(d18:1/16:0) levels were analyzed on an AB SCIEX QTRAP 5500 triple quadrupole mass spectrometer equipped with a Turbo V electrospray ionization (ESI) source, Shimadzu LC-20A UHPLC system, and a PAL CTC autosampler. The chromatographic peaks were identified using MultiQuant (v2.1.1, AB Sciex), confirmed by manual inspection, and the peak areas integrated. The median of the peak area of stable isotope internal standards was calculated and used for the normalization of metabolite concentrations across the samples and batches. n = 5 per group. Data were log-transformed prior to multivariate and univariate analysis.
2.16. Statistics
Data are expressed as means ± SE. ANOVA or student's t-test were used to analyze data, P < 0.05 considered statistically significant.
3. Results
3.1. FTICR-MALDI-MSI Revealed That ATP/AMP Ratio is Increased in the Glomeruli of Diabetic Mice
Nucleotides from renal cortex samples were initially performed by phenol chloroform extraction and measured ATP and ADP levels in the renal cortical tissues of normal and diabetic mice. The ATP/ADP ratio was significantly increased in the renal cortex of diabetic mice (Fig. S1A–C). However, this method of measuring adenylate nucleotides is not suitable for glomerular measurements as the method to isolate glomeruli from mice is time-consuming and requires multiple steps (Takemoto et al., 2002). To definitively assess the relative ATP/ADP or ATP/AMP ratios in the glomeruli of diabetic mice, we performed high-mass resolution FTICR-MALDI-MSI. To minimize the hydrolysis of renal adenylate nucleotides, kidneys were removed immediately after cervical dislocation and snap frozen in liquid nitrogen followed by mounting on ITO glass slides and matrix (9-AA) application. ATP, AMP and ADP were identified by MS (Fig. 1A) and MS/MS (Fig. 1B–D) and found to be widely distributed throughout the kidney at a spatial resolution of 70 μm (Fig. 1E and F). Relative quantitation and visualization of glomerular ATP, AMP, and ADP were achieved by analysis with high-spatial resolution (30 μm; Fig. 1G). Interestingly, glomerular ATP was significantly increased by 59.3% and AMP was decreased by 61.4% in the glomeruli of diabetic mice as compared to non-diabetic glomeruli (Fig. 1H and I). Thus, the glomerular ATP/AMP and ATP/ADP ratios were increased by 175.1 and 313.1%, respectively, in the glomeruli of diabetic mice (Fig. 1K and L).
Fig. 1.

Targeted FTICR-MALDI-MSI analysis reveals the increased ATP, ATP/AMP and ATP/ADP in the glomeruli of Akita mice.
(A) Representative overall average MS1 spectrum of the kidney and AMP (red rectangle), ADP (yellow rectangle) and ATP (green rectangle)-related peaks. (B–D) Representative MS/MS spectra and chemical structures of AMP (B), ADP (C) and ATP (D). (E and F) Representative FTICR-MALDI-MSI images for AMP, ADP and ATP of WT (E) and Akita (F) mice at a spatial resolution of 70 μm. The distribution of sulfatide (ST 42:1(OH)), phosphatidylinositol (PI (40:4)) and phosphatidic acid (PA (36:1)) were used as contrast ions for medullary, cortical tubular and glomerular regions, respectively. Images on the left side shows representative images of PAS-stained kidney sections and the border between cortex and medulla is shown by dotted lines.(G) Representative FTICR-MALDI-MSI images for PA (36:1), AMP, ADP and ATP at a spatial resolution of 30 μm. Glomerular area was guided by PA (36:1) content and the outlines of glomeruli were shown by red dotted circles. Rainbow color scales was used. The white color represents the highest signal intensity (100%) and the black color represents the lowest signal (0%) of the particular ion. (H–L) Quantitative results for ATP (H), AMP (I), ADP (J), and ATP/AMP (K) and ATP/ADP (L) ratio. Fifteen randomly selected glomeruli per mouse were examined (n = 3/per group). Values are the means ± SE. **P < 0.01 and *P < 0.05.
3.2. Distribution of Analytes in Normal Mouse Kidney
We next performed untargeted MALDI-MSI in the kidney tissues to identify analytes which may potentially regulate ATP production in kidney tissues. We first performed MALDI-MSI analysis (spatial resolution; 90 μm) using kidney sections of normal mice and screened the analytes in kidney tissues. DHB was used as a MALDI matrix. We picked up m/z values which have an obvious peak in the spectrum and a clear distribution in the kidney section. m/z values with high background intensity were excluded as these m/z values may contain the signal from matrix itself. Based on a total of 2 normal mouse kidney sections, we found a total of 270 m/z values distributed in the kidney section. 151 of 270 m/z value were distributed specifically in renal compartments such as cortex and medulla and 72 m/z values were distributed throughout the kidney section. Each blue triangle in Fig. S2C shows selected peak, and Fig. S2D showed MSI images in representative m/z values. One hundred and twenty two out of 270 m/z values were distributed in the renal cortex (red triangles in Fig. S2C). MSI images exhibited several different distribution patterns in renal cortex (Fig. S2E). For example, peaks with m/z of 192.8, 701.6, 744.7, and 772.7 were distributed throughout the renal cortex whereas peaks with m/z of 683.6, 703.6, 725.6, and 741.5 m/z were distributed primarily in the corticomedullary junction. Twenty nine out of 270 m/z values were distributed in renal medulla (green triangles in Fig. S2C). MSI images also exhibited specific distribution patterns in renal medulla (Fig. S2F). Fig. S2G–J shows representative m/z values with specific distribution in the renal compartments and Fig. S2K shows the merged image.
3.3. Distribution of Analytes in Human Kidney
We also examined the cortical sections of normal human kidney to compare the distribution of analytes, which were detected in the renal cortex of mice. We attempted to identify peaks with preferential distribution in the glomeruli as many common kidney diseases initially manifest in glomeruli. Fig. 2A is a representative of human kidney section coated with DHB matrix. After MSI analysis, the same section was re-evaluated histologically by H&E staining to identify glomeruli in kidney section (Fig. 2B and C). We identified peaks with m/z of 703.6, 725.6 and 741.5 to have scattered glomerular type distribution in the human kidney cortex (Fig. 2D–G). We found that these analytes were preferentially distributed in the glomeruli (Fig. 2H–J; white arrows). Interestingly, all of these analytes (m/z of 703.6, 725.6 and 741.5) were distributed not only in the glomeruli but also in the vascular wall of the human kidney (Fig. 2E–G; yellow arrows). Although these analytes were also present in the mouse kidney, the spatial resolution (90 μm) was insufficient to definitively evaluate the distribution in the renal cortex using MALDI-MSI (Fig. S2E).
Fig. 2.

High-spatial-resolution (HSR)-MALDI-MSI and AMM enables to identify SM as a glomerular-localized lipid in mouse and human kidney.
(A) Representative DHB-coated human kidney section. Bar; 1 mm. (B and C) Representative H&E image of human kidney section (B) and magnified H&E image (C). Black arrows indicate glomeruli. Bar; 1 mm. (D) Representative overall average spectrum of human kidney obtained by MALDI-MSI analysis. Red arrows show peaks (analytes) which are mainly distributed in the human glomeruli. (E–G) MALD-MSI images of human kidney at m/z 703.6, 725.6 and 741.5, respectively. (H–J) Overlay images of H&E and MSI images. White arrows indicate glomeruli. Spatial resolution for MALDI-MSI images (E–J); 90 μm. (K and L), Representative overall average spectra of human kidney (K) and mouse kidney (L) obtained by high-spatial-resolution (HSR)-MALDI-MSI analysis. Red arrows indicate the peaks (analytes) which are mainly distributed in the glomeruli of both mouse and human kidney. (M) Representative H&E-stained images and correspondent HSR-MALDI-MSI images (at m/z 703.6, 725.6 and 741.5) of human and mouse kidneys. Scale bars; 200 μm. White arrows indicate glomeruli. Spatial resolution for HSR-MALDI-MSI images; 25 μm. (N) Chemical structure of SM(d18:1/16:0). (O–Q) MS/MS (left) and FT-MS (right) spectra of H+ adduct (O), Na+ adduct (P) and K+ adduct (Q) of SM(d18:1/16:0). Samples were directly collected from the glomeruli in the kidney sections by the AMM instrument equipped with the light microscopy.
3.4. Detection and Identification of Analytes in Glomeruli of Mouse and Human
For the accurate detection of analytes in the mouse glomeruli, we performed untargeted high-spatial-resolution (HSR)-MALDI-MSI analysis (spatial resolution: 25 μm) using human and mouse kidney sections. After MSI analysis, the same section was re-evaluated by H&E staining (Fig. 2M). Fig. 2K and L showed the average spectra obtained from HSR-MALDI-MSI of human kidney (Fig. 2K) and mouse kidney sections (Fig. 2L), respectively, and the red arrows identify the peaks of analytes which are mainly distributed in the glomeruli. At m/z 703.6, 725.6 and 741.5, the analytes were distributed primarily in the human glomeruli (Fig. 2M; white arrows) compared with nearby regions. In mouse glomeruli, a similar distribution pattern was observed at the same m/z values (Fig. 2M; white arrows). Based on the accurate parent masses determined by high resolution FTICR MS and their subsequent MS/MS (AMM analysis), molecules at m/z 703.5775 (H+ adduct; Fig. 2O), 725.5581 (Na+ adduct; Fig. 2P) and 741.5335 (K+ adduct; Fig. 2Q) were annotated as sphingomyelin (SM). Since 18 carbon atoms are typically present in the long chain sphingoid bases (LCB) in mammals (Sullards et al., 2011), we identified that the detected SM is most likely SM(d18:1/16:0) (Fig. 2N). These sets of features were highly expressed in both mouse and human glomeruli.
3.5. Accumulation of SM(d18:1/16:0) in the Glomeruli of Type 1 Diabetic and High-fat-fed Mice
We then applied HSR-MALDI-MSI to determine whether glomerular SM(d18:1/16:0) was differentially regulated between type 1 diabetic mice and control mice. At 23 weeks of age, HbA1c and relative kidney weight (mg/g body weight) were significantly increased and body weight was significantly decreased in diabetic mice (Table 1). Glomerular size, mesangial matrix and urinary albumin to creatinine ratio were significantly increased in Akita mice (Fig. S3A, C, D and G). Fig. 3A and B shows the average spectra obtained from HSR-MALDI-MSI of the kidneys from WT and Akita mice, respectively. Interestingly, HSR-MALDI-MSI showed that SM(d18:1/16:0) was more abundant in the glomeruli of diabetic mice compared with WT mice (Fig. 3C). We further examined HSR-MALDI-MSI to explore the accumulation of SM(d18:1/16:0) in an obesity animal model of CKD. Since we previously showed that one week of HFD feeding is associated with reduced glomerular AMPK activity (Decleves et al., 2011), mice were fed with standard diet (STD) or HFD for one week and euthanized. Fig. 4A and B shows the average spectra obtained from HSR-MALDI-MSI of the kidneys from STD-and HFD-fed mice, respectively. There was no difference in glomerular size, mesangial matrix between STD-fed and HFD-fed mice after just one week of the high fat diet indicating that structural damage had not yet occurred (Fig. S3B, E, F and H). However, as with the diabetic mice, HFD-fed mice showed accumulation of SM(d18:1/16:0) in the glomeruli compared with STD-fed mice (Fig. 4C), suggesting that one week of high-fat feeding is sufficient to accumulate SM in the glomeruli. Independent studies were performed to measure SM(d18:1/16:0) concentration in arterial and renal venous plasma samples obtained from 20-week aged STD-fed and HFD-fed mice (duration of HFD; 14 weeks) to confirm whether SM(d18:1/16:0) was synthesized in the kidney and released into the bloodstream. Fig. S4A–C shows body weight, blood glucose and relative kidney weight at 20-week age. Interestingly, renal venous SM(d18:1/16:0) was increased in HFD-fed mice compared with STD-fed mice (Fig. 4D). In addition, the ΔSM(d18:1/16:0) across the renal vascular bed, which may indicate the amount of SM(d18:1/16:0) secretion from the kidney, was also significantly increased in HFD-fed mice compared with STD-fed mice (Fig. 4D).
Table 1.
Metabolic characteristics of mice.
| Group | n | Age (weeks) | Body weight (g) | Blood glucose (mg/dL) | HbA1c (%) | Kidney weight/body weight (mg/gBW) |
|---|---|---|---|---|---|---|
| Wild type | 11 | 23 | 29.6 ± 0.50 | 129 ± 7.9 | 4.2 ± 0.10 | 11.7 ± 0.43 |
| Akita | 6 | 23 | 23.7 ± 0.31⁎⁎⁎ | 558 ± 19.9⁎⁎⁎ | 12.2 ± 0.48⁎⁎⁎ | 19.4 ± 0.57⁎⁎⁎ |
| Group | n | Age (weeks) | Body weight (g) | Blood glucose (mg/dL) | HbA1c (%) | Kidney weight/tibia (mg/mm) |
| STD | 9 | 8 | 23.6 ± 0.63 | 154 ± 7.3 | 4.2 ± 0.10 | 13.9 ± 0.31 |
| HFD | 11 | 8 | 26.5 ± 0.48⁎⁎ | 181 ± 12.3 | 4.4 ± 0.02 | 14.8 ± 0.59 |
Data are means ± SE.
P < 0.01 vs. STD.
P < 0.001 vs. wild type.
Fig. 3.

Accumulation of SM(d18:1/16:0) in the glomeruli of Akita mice.
(A and B) Representative overall average spectra obtained from the kidney sections of WT (A) and Akita (B) mice by HSR-MALDI-MSI analysis. Black or red triangles indicate the SM(d18:1/16:0) related peaks (m/z 703.6 and 741.5). (C) Representative SM(d18:1/16:0) HSR-MALD-MSI images of the kidney cortex of WT and Akita mice. White arrows indicate glomeruli. Glomerular area was guided by H&E staining and the outlines of glomeruli in the enlarged images were shown by red dotted circles. Spatial resolution for HSR-MALDI-MSI images; 25 μm.
Fig. 4.

Accumulation of SM(d18:1/16:0) in the glomeruli of HFD-fed mice.
(A and B) Representative overall average spectra obtained from the kidney sections of standard diet (STD) (A) and high-fat diet (HFD)-fed (B) mice by HSR-MALDI-MSI analysis. Duration of HFD feeding; one week. Black or orange triangles indicate the SM(d18:1/16:0) related peaks (703.6 and 741.5 m/z).(C) Representative SM(d18:1/16:0) HSR-MALD-MSI images of the kidney cortex of STD- and HFD-fed mice. White arrows indicate glomeruli. Glomerular area was guided by H&E staining and the outlines of glomeruli in the enlarged images were shown by red dotted circles. Spatial resolution for HSR-MALDI-MSI images; 25 μm. (D) Arterial and renal venous plasma SM(d18:1/16:0) ratios in STD and HFD-fed mice. Duration of HFD feeding; 14 weeks. n = 5 per group. ***P < 0.001 and *P < 0.05.
3.6. Dysregulation of SM Synthase and SMase in the Glomeruli of Akita and HFD Mice
To explore the mechanisms for SM(d18:1/16:0) accumulation in the glomeruli, we performed immunohistochemical staining for SM synthase (SMS) and sphingomyelinase (SMase). Both SMS1 and SMS2 expression were significantly increased in the glomeruli of diabetic mice compared with WT mice (Fig. 5A and B), while no change was observed in SMase expression (Fig. 5C and D). SMS1 expression was significantly increased and neutral SMase2 (nSMase2) was significantly reduced in the glomeruli of mice fed for 1 week with the HFD compared with STD-fed mice (Fig. 5E and H). These results suggest that insufficiency of SMase and/or stimulation of SMS may contribute to the accumulation of SM(d18:1/16:0) in glomeruli of diabetic and HFD-fed mice (Fig. 5I and J).
Fig. 5.

Expression of sphingomyelin synthases (SMSs) and sphingomyelinases (SMases) in the glomeruli of Akita and HFD-fed mice.
(A–H) Representative, SMS1 (A and E) and SMS2 (B and F) aSMase (C and G), nSMase2 (D and H)-stained glomerular pictures (400 × magnification). (A–D) WT vs. Akita mice. (E–H) STD vs. HFD-fed mice. Duration of HFD feeding; one week. (I and J) Schematic diagram of accumulation of SM and role of SM-related enzymes in the kidney of Akita (I) and HFD-fed (J) mice. Fifteen randomly selected glomeruli per mouse were examined (n = 3/per group). Values are the means ± SE. ***P < 0.001 and **P < 0.01.
3.7. Inhibition of AMPK Activity by SM in Cultured Mesangial Cells
In the human kidney, the MSI data showed that SM(d18:1/16:0) is clearly distributed in the vascular wall (yellow arrows in Fig. 2E–G; possibly in smooth muscle cells) as well as glomeruli (Fig. 2E–G). As mesangial cells are similar to vascular smooth muscle cells in both morphology and function (Iehara et al., 1996), we speculated that SM(d18:1/16:0) may play a role in the mesangial cells of the glomeruli in regulating key pathways (AMPK/PGC1α) linked to diabetic and obesity related kidney disease (Decleves et al., 2011, Dugan et al., 2013). We therefore investigated the effect of liposomal SM(d18:1/16:0) in murine mesangial cells (MMCs). Treatment of MMCs with liposomal SM(d18:1/16:0) significantly reduced AMPK activity and PGC1α protein expression in MMCs (Fig. 6A–C). It is noteworthy that SM(d18:1/16:0) not only reduced acid SMase (aSMase) expression but also increased SMS2 expression, suggesting the potential for a SM self-amplification loop in MMCs (Fig. 6D–G). TGF-β1 protein levels showed a slight increase by liposomal SM(d18:1/16:0), but this was not significant (Fig. 6H and J). However, liposomal SM(d18:1/16:0) exhibited a significant increase in Smad3 phosphorylation compared with control liposome (Fig. 6H and I), indicating that the fibrosis pathway was engaged by SM.
Fig. 6.

SM(d18:1/16:0) regulates ATP production via glycolysis in murine mesangial cells (MMCs).
(A–C) Representative western blot images (A) and quantitative results of PGC1α (B) and p-AMPKα (C). (D–G) Representative western blot images (D) and quantitative results of aSMase (E), SMS1 (F), and SMS2 (G). (H–J) Representative western blot images (H) and quantitative results of p-Smad3 (I) and TGFβ1 (J). MMCs were treated with different liposomes for 15 min, and then cultured for 24 h before harvest. Whole cell lysates were used for analysis. n = 4/per group. (K) Representative western blot images of SMS1, SMS2 and actin. (L) ATP levels in MMCs. MMCs were transfected with SMS1 and/or SMS2 siRNA and treated with different liposomes. (M and N) Representative western blot images (M) and quantitative results of p-AMPKα (N). (O) Glucose consumption (per 24 h) in MMCs. (P) Lactate secretion (per 24 h) in MMCs. (Q) Glutamine levels in the medium of MMCs. (R) ATP levels in MMCs. MMCs were treated with or without 2-DG (10 mM) for 1 h before ATP measurement. L, O–R; n = 6–12 per group. Representative results from three independent experiments are shown. Values are means ± SE. ***P < 0.001. **P < 0.01 and *P < 0.05.
3.8. SM(d18:1/16:0) Regulates ATP Production in Cultured Mesangial Cells
The depletion of SMS1, accompanied with reduction of SM, has been recently shown to inhibit high glucose-induced ATP production in murine islet cells (Yano et al., 2011). As SM may be linked to regulation of ATP production and SM regulates AMPK and PGC1α, we examined the effect of SM(d18:1/16:0) on ATP levels with or without the silencer siRNAs targeting SMS1 and SMS2 in MMCs. Transfection with siRNAs targeting SMS1 or SMS2 significantly downregulated the expression level of SMS1 and SMS2 (> 70% and > 80% respectively), as measured by western blotting (Fig. 6K). ATP production was slightly reduced by either SMS1 or SMS2 siRNA but not significantly (Fig. 6L). However, co-transfection with both SMS1 and SMS2 siRNA significantly reduced ATP production compared with the control siRNA group (Fig. 6L). Treatment with liposomal SM(d18:1/16:0) significantly increased ATP production and was prevented by SMS2 or SMS1 + 2 siRNA (Fig. 6L). It is noteworthy that the knockdown of either SMS1 or SMS2 markedly increased AMPK activity compared with the control siRNA group (Fig. 6M and N). These results suggest that the increase in ATP production via SMS1 and SMS2 may contribute to the reduction of AMPK activity in liposomal SM(d18:1/16:0)-treated MMCs. Our results therefore indicate that accumulation of SM(d18:1/16:0) may be an important regulator of ATP levels in the glomeruli of the diabetic kidney and thus contribute to the inhibition of AMPK in diabetic glomeruli (Dugan et al., 2013, Sharma et al., 2008).
3.9. SM(d18:1/16:0) Increases Glycolytic Flux in Cultured Mesangial Cells
We then sought the source of ATP production by liposomal SM(d18:1/16:0). Glucose consumption was significantly reduced by SMS2 or SMS1 + 2 siRNA in glomerular mesangial cells (Fig. 6O). Treatment with liposomal SM(d18:1/16:0) significantly increased glucose consumption and was partially prevented by SMS1 or SMS2 siRNA (Fig. 6O) and completely prevented by the co-transfection of both SMS1 and SMS2 siRNAs (Fig. 6O). Lactate secretion was significantly increased by liposomal SM(d18:1/16:0), and was prevented by SMS2 or SMS1 + 2 siRNA (Fig. 6P). Extracellular glutamate was increased by liposomal SM(d18:1/16:0), suggesting a reduction of glutamine utilization in MMCs by liposomal SM(d18:1/16:0) (Fig. 6Q). ATP production was significantly inhibited by the addition of a glycolysis inhibitor 2-Deoxy-d-glucose (2-DG) in untreated (P < 0.001) or control liposome treated MMCs (P < 0.001) (Fig. 6R). However, in the liposomal SM(d18:1/16:0)- and 2-DG-treated group, ATP production was further reduced compared with the 2-DG or control liposome + 2-DG groups (Fig. 6R). These results suggest that exogenous addition of SM(d18:1/16:0) increases glycolysis-related ATP production.
4. Discussion
In the present study, using MALDI-MSI and AMM approaches, we show that 1) the ATP/AMP and ATP/ADP ratio are increased in the glomeruli of diabetic mice compared with WT mice, 2) SM(d18:1/16:0) is preferentially distributed in the glomeruli in normal human kidney, and 3) SM(d18:1/16:0) is increased in the glomeruli of type 1 diabetic and HFD-fed mice compared with controls. We also demonstrate by in vitro studies using mesangial cells that AMPK–PGC1α is reduced and ATP production is increased by the treatment with liposomal SM(d18:1/16:0).
We have previously demonstrated that renal AMPK activity is reduced in mouse models of type 1 diabetes and obesity-related kidney disease (conditions characterized by caloric excess states), and that AMPK activation inhibits the progression of chronic kidney damage (Decleves et al., 2011, Dugan et al., 2013). We have also reported that activation of AMPK has a potent role in blocking profibrotic signaling via inhibition of high-glucose induced Smad4 nuclear translocation in cultured murine mesangial cells (Zhao et al., 2015). In addition, we have recently shown that the reduced mitochondrial function in diabetic kidneys is associated with reduction of AMPK–PGC1α signaling (Dugan et al., 2013). Although AMPK is a key player in regulating energy balance and related to many signaling pathways in the progression of DKD, little is known about the relationship of AMPK with ATP levels in vivo, due to the difficulty in measurements in tissues. In addition, as kidneys are complex organs and consist of many cell types and each cell type may differentially regulate energy balance, the evaluation of ATP/ADP and ATP/AMP ratios is difficult to accurately assess in specific compartments, such as the glomerulus. We show here that with FTICR-MALDI-MSI, there is an increase in the ATP, ATP/AMP and ATP/ADP ratio in diabetic glomeruli compared with WT glomeruli. It has been reported that, in cultured rat mesangial cells, the extracellular ATP levels are increased by high glucose, and in addition, fibrosis-related markers including fibronectin and TGF-β are significantly increased by the addition of ATP (Solini et al., 2005). ATP levels are now considered to be a promoter of inflammation (Cauwels et al., 2014), and ectonucleoside triphosphate diphosphohydrolase 1 (ENTPD1), which is expressed in the glomeruli and hydrolyze ATP and ADP to AMP, is reported to prevent renal inflammation in the kidney of type 1 diabetic mice (Friedman et al., 2007). Based on our results it is likely that enhanced ATP production is a characteristic of diabetic glomerular disease.
We also demonstrate that intraglomerular SM(d18:1/16:0) is significantly increased with diabetes and a high-fat diet and may be a key factor to drive the increased ATP levels. This is a surprising result as an increase in SM(d18:1/16:0) has previously not been postulated to be a direct consequence of hyperglycemia or a high fat diet in glomerular cells. Alongside a direct effect of excess glucose, there may well be an important contribution of SM(d18:1/16:0) to contribute to the enhanced ATP production. Importantly, SM(d18:1/16:0) increases ATP production via activation of glycolytic pathway and thus may drive a Warburg type effect in diabetic tissues. In addition, we also identified that SMS2 expression was significantly increased by the addition of SM(d18:1/16:0) in MMCs, and ATP levels were significantly decreased by the knockdown of SMS2 or both SMS1 and 2, suggesting that SMS2 may play a central role in the regulation of ATP levels in MMCs. One of the limitations of the study is the cell work was performed with one cell line and additional glomerular cell types will need to be evaluated in future studies.
It is notable that one week of HFD exposure is sufficient to increase SM(d18:1/16:0) in the renal glomeruli, suggesting that SM(d18:1/16:0) accumulation could represent an early pathogenic event in obesity-related kidney injury preceding glomerular disease. Moreover, exogenous addition of liposomal SM(d18:1/16:0) reduces AMPK activity, and the addition of SMS1 and/or SMS2 siRNAs enhances AMPK activity in cultured mesangial cells. In fact, we have reported that AMPK activity is reduced in the glomeruli as early as one week of high-fat diet exposure (Decleves et al., 2011). These results suggest that there is a link between accumulation of SM(d18:1/16:0) and reduction of glomerular AMPK activity with diabetes and obesity-related glomerular disease.
It has been previously reported that SM(d18:1/16:0) is distributed in the cortex of mouse kidneys (Jones et al., 2014, Muller et al., 2015) and Grove et al.(Grove et al., 2014) identified SM(d18:1/16:0) as one of the lipids localized to glomeruli. Our study using HSR-MALDI-MSI and AMM demonstrates that SM(d18:1/16:0) is mainly localized in the glomeruli in both mouse and human kidney cortex and that SM(d18:1/16:0) is increased in the glomeruli of both HFD-fed mice and diabetic mice.
Recently, the importance of SM in human diabetic nephropathy has been suggested in a clinical study. Mäkinen VP et al. (Makinen et al., 2012) reported that plasma SM is positively correlated with urinary albumin excretion rate and negatively correlated with glomerular filtration rate in patients with type 1 diabetes. In addition, they concluded that, among lipids tested, SM is the strongest contributor to kidney disease. In terms of the importance of SM(d18:1/16:0), the results from the Ludwigshafen Risk and Cardiovascular Health (LURIC) study are especially noteworthy (Sigruener et al., 2014). They applied electrospray ionization tandem mass spectrometry (ESI MS/MS) to analyze the various lipids including SM and ceramide species in plasma of the subjects from the LURIC study (Sigruener et al., 2014). They found that, among SM species tested, SM(d18:1/16:0) showed the strongest positive association with mortality. In contrast, five other SM species displayed an association with protective effect. Interestingly, ceramide(d18:1/16:0) also shows similar positive association as the SM(d18:1/16:0) (Sigruener et al., 2014). It is reported that intracellular C12:0 (d18:1/12:0) ceramide and C12:0 SM are increased by the stimulation of tumor necrosis factor (TNF) in dopaminergic neuroblastoma cells (Martinez et al., 2012). Additionally, the supplementation of SM in culture medium led to increased secretion of IL-6 in response to treatment with LPS (Chakraborty et al., 2013), suggesting that exogenous SM can stimulate inflammation.
Sphingomyelinase is a major SM-related enzyme, which catalyzes hydrolysis of SM to ceramide by cleaving a phosphocholine residue (Taniguchi and Okazaki, 2014). On the other hand, SM is synthesized by sphingomyelin synthase (SMS), which transfers the phosphorylcholine moiety from phosphatidylcholine (PC) onto ceramide, producing SM and diacylglycerol (DAG) (Hailemariam et al., 2008). Qureshi A et al. (Qureshi et al., 2010) reported that SM(d18:1/16:0) is concentrated in the Cryptococcus neoformans-infected mouse lung by mass spectrometry imaging, and that inhibition of SMS impairs the killing ability of cultured neutrophils. Yano et al. (2011) reported that SMS1 deficient islet cells exhibit reduced SM(d18:1/16:0) levels in isolated islets. SMS1 deficient islet cells also exhibited upregulation of PGC1α expression and increased expression of markers for mitochondrial complex I (ND4 and ND6) and complex IV (Cox1, 2, 3 and 4) suggesting the activation of mitochondrial biogenesis. With the results of our present studies, it is likely that increased SMS1 and SMS2 leads to accumulation of SM(d18:1/16:0) in the diabetic glomeruli and that SM(d18:1/16:0) plays a key role in regulating mitochondrial biogenesis and potentially inflammatory pathways in diabetic glomeruli. We also demonstrate that SM(d18:1/16:0) stimulates a key pro-fibrotic pathway (Smad3) which has been linked to reduced mitochondrial biogenesis in adipose tissue of obesity (Yadav et al., 2011).
It remains controversial how SMase and/or SMS is regulated in the organs of animals fed a HFD. It has been reported that three weeks of HFD feeding induces a pronounced SM (including SM(d18:1/16:0)) accumulation in liver tissues, accompanied by decreased activity of aSMase but increased nSMase activity (Chocian et al., 2010). Similarly, Baranowski et al. (2007) reported the reduction of both aSMase and nSMase activity in the heart of rats fed a HFD. In addition, Boini et al. reported that 13 weeks of HFD feeding reduced aSMase activity in adipose tissues (Boini et al., 2010). However, to our knowledge, there are no reports focused on the regulation of SMase and SMS in the kidney of HFD-fed mice. In our experiment, we found that the accumulation of SM in the glomeruli of HFD-fed mice may be due to reduction of nSMase and increased SMS1 level in the glomeruli.
In conclusion, by utilizing HSR-MALDI-MSI, we have found accumulation of SM(d18:1/16:0) in the glomeruli of two different mouse models for CKD. Increased ATP levels in the diabetic glomeruli and MMCs treated with liposomal SM(d18:1/16:0) may contribute to inhibit AMPK activity and promote fibrosis-related protein expression in the glomeruli. SM(d18:1/16:0) primarily stimulates ATP production via enhanced glucose transport and aerobic glycolysis. Our data demonstrates an important link between SM(d18:1/16:0), and the regulation of glucose metabolism in high fat diets, diabetes and kidney diseases. Further studies are required to establish whether SM is a necessary mediator to increase ATP/AMP in vivo. These findings provide a novel understanding of the regulation of ATP production in the pathogenesis of caloric-induced CKD. The inhibition of SM(d18:1/16:0) synthesis may lead to novel therapeutic targets for the treatment of caloric-induced CKD.
Conflict of Interest
G.H. and J.S. are employees of ImaBiotech, Inc. Other authors report no conflicts of interest relevant to this study.
Author Contributions
S.M., P.C.D. and K.S designed the study. S.M. wrote the manuscript and executed all experiments presented, except the LC–MS/MS-based SM measurement. C.C.H. and P.C.D performed AMM analysis. G.H. and J.S. performed FTICR-MALDI-MSI analysis. M.D. assisted with cell culture, western blots, performed ATP measurements and edited the manuscript. A.E.D. provided a part of the animal data. L.S. performed a part of the animal study. M.D.S contributed to discussion. S.P. edited the manuscript and contributed to discussion. K.S. reviewed and edited the manuscript.
Acknowledgments
We thank Dr. Christopher M. Rath for his guidance on MALDI-MSI analysis. K.S. was supported by grants from the Juvenile Diabetes Research Foundation, VA Merit Award 5101BX000277 and National Institute of Diabetes and Digestive and Kidney Diseases (1DP3DK094352). S.M. was supported in part by grants from JSPS International Training Program (ITP) and the Uehara Memorial Foundation. S.P. was supported by grants from the National Institute of Diabetes and Digestive and Kidney Diseases (DK082841, DK094292).
Footnotes
Supplementary data to this article can be found online at http://dx.doi.org/10.1016/j.ebiom.2016.03.033.
Appendix A. Supplementary Data
Supplementary figures.
References
- Baranowski M., Blachnio A., Zabielski P., Gorski J. PPARalpha agonist induces the accumulation of ceramide in the heart of rats fed high-fat diet. J. Physiol. Pharmacol. 2007;58:57–72. [PubMed] [Google Scholar]
- Boini K.M., Zhang C., Xia M., Poklis J.L., Li P.L. Role of sphingolipid mediator ceramide in obesity and renal injury in mice fed a high-fat diet. J. Pharmacol. Exp. Ther. 2010;334:839–846. doi: 10.1124/jpet.110.168815. [DOI] [PMC free article] [PubMed] [Google Scholar]
- Cauwels A., Rogge E., Vandendriessche B., Shiva S., Brouckaert P. Extracellular ATP drives systemic inflammation, tissue damage and mortality. Cell Death Dis. 2014;5 doi: 10.1038/cddis.2014.70. [DOI] [PMC free article] [PubMed] [Google Scholar]
- Chakraborty M., Lou C., Huan C., Kuo M.S., Park T.S., Cao G., Jiang X.C. Myeloid cell-specific serine palmitoyltransferase subunit 2 haploinsufficiency reduces murine atherosclerosis. J. Clin. Invest. 2013;123:1784–1797. doi: 10.1172/JCI60415. [DOI] [PMC free article] [PubMed] [Google Scholar]
- Chida J., Kido H. Extraction and quantification of adenosine triphosphate in mammalian tissues and cells. Methods Mol. Biol. 2014;1098:21–32. doi: 10.1007/978-1-62703-718-1_2. [DOI] [PubMed] [Google Scholar]
- Chocian G., Chabowski A., Zendzian-Piotrowska M., Harasim E., Lukaszuk B., Gorski J. High fat diet induces ceramide and sphingomyelin formation in rat's liver nuclei. Mol. Cell. Biochem. 2010;340:125–131. doi: 10.1007/s11010-010-0409-6. [DOI] [PubMed] [Google Scholar]
- Collins A.J., Gilbertson D.T., Snyder J.J., Chen S.C., Foley R.N. Chronic kidney disease awareness, screening and prevention: rationale for the design of a public education program. Nephrology (Carlton) 2010;15(Suppl. 2):37–42. doi: 10.1111/j.1440-1797.2010.01312.x. [DOI] [PubMed] [Google Scholar]
- Decleves A.E., Mathew A.V., Cunard R., Sharma K. AMPK mediates the initiation of kidney disease induced by a high-fat diet. J. Am. Soc. Nephrol. 2011;22:1846–1855. doi: 10.1681/ASN.2011010026. [DOI] [PMC free article] [PubMed] [Google Scholar]
- Dugan L.L., You Y.H., Ali S.S., Diamond-Stanic M., Miyamoto S., DeCleves A.E., Andreyev A., Quach T., Ly S., Shekhtman G. AMPK dysregulation promotes diabetes-related reduction of superoxide and mitochondrial function. J. Clin. Invest. 2013;123:4888–4899. doi: 10.1172/JCI66218. [DOI] [PMC free article] [PubMed] [Google Scholar]
- Fahy E., Sud M., Cotter D., Subramaniam S. LIPID MAPS online tools for lipid research. Nucleic Acids Res. 2007;35:W606–W612. doi: 10.1093/nar/gkm324. [DOI] [PMC free article] [PubMed] [Google Scholar]
- Friedman D.J., Rennke H.G., Csizmadia E., Enjyoji K., Robson S.C. The vascular ectonucleotidase ENTPD1 is a novel renoprotective factor in diabetic nephropathy. Diabetes. 2007;56:2371–2379. doi: 10.2337/db06-1593. [DOI] [PubMed] [Google Scholar]
- Grove K.J., Voziyan P.A., Spraggins J.M., Wang S., Paueksakon P., Harris R.C., Hudson B.G., Caprioli R.M. Diabetic nephropathy induces alterations in the glomerular and tubule lipid profiles. J. Lipid Res. 2014;55:1375–1385. doi: 10.1194/jlr.M049189. [DOI] [PMC free article] [PubMed] [Google Scholar]
- Hailemariam T.K., Huan C., Liu J., Li Z., Roman C., Kalbfeisch M., Bui H.H., Peake D.A., Kuo M.S., Cao G. Sphingomyelin synthase 2 deficiency attenuates NFkappaB activation. Arterioscler. Thromb. Vasc. Biol. 2008;28:1519–1526. doi: 10.1161/ATVBAHA.108.168682. [DOI] [PubMed] [Google Scholar]
- Hardie D.G. AMP-activated protein kinase: an energy sensor that regulates all aspects of cell function. Genes Dev. 2011;25:1895–1908. doi: 10.1101/gad.17420111. [DOI] [PMC free article] [PubMed] [Google Scholar]
- Hattori K., Kajimura M., Hishiki T., Nakanishi T., Kubo A., Nagahata Y., Ohmura M., Yachie-Kinoshita A., Matsuura T., Morikawa T. Paradoxical ATP elevation in ischemic penumbra revealed by quantitative imaging mass spectrometry. Antioxid. Redox Signal. 2010;13:1157–1167. doi: 10.1089/ars.2010.3290. [DOI] [PMC free article] [PubMed] [Google Scholar]
- Hsu C.C., White N.M., Hayashi M., Lin E.C., Poon T., Banerjee I., Chen J., Pfaff S.L., Macagno E.R., Dorrestein P.C. Microscopy ambient ionization top-down mass spectrometry reveals developmental patterning. Proc. Natl. Acad. Sci. U. S. A. 2013;110:14855–14860. doi: 10.1073/pnas.1310618110. [DOI] [PMC free article] [PubMed] [Google Scholar]
- Iehara N., Takeoka H., Tsuji H., Imabayashi T., Foster D.N., Strauch A.R., Yamada Y., Kita T., Doi T. Differentiation of smooth muscle phenotypes in mouse mesangial cells. Kidney Int. 1996;49:1330–1341. doi: 10.1038/ki.1996.189. [DOI] [PubMed] [Google Scholar]
- Jones E.E., Dworski S., Canals D., Casas J., Fabrias G., Schoenling D., Levade T., Denlinger C., Hannun Y.A., Medin J.A. On-tissue localization of ceramides and other sphingolipids by MALDI mass spectrometry imaging. Anal. Chem. 2014;86:8303–8311. doi: 10.1021/ac501937d. [DOI] [PMC free article] [PubMed] [Google Scholar]
- Kang H.M., Ahn S.H., Choi P., Ko Y.A., Han S.H., Chinga F., Park A.S., Tao J., Sharma K., Pullman J. Defective fatty acid oxidation in renal tubular epithelial cells has a key role in kidney fibrosis development. Nat. Med. 2015;21:37–46. doi: 10.1038/nm.3762. [DOI] [PMC free article] [PubMed] [Google Scholar]
- Kidokoro K., Satoh M., Channon K.M., Yada T., Sasaki T., Kashihara N. Maintenance of endothelial guanosine triphosphate cyclohydrolase I ameliorates diabetic nephropathy. J. Am. Soc. Nephrol. 2013;24:1139–1150. doi: 10.1681/ASN.2012080783. [DOI] [PMC free article] [PubMed] [Google Scholar]
- Kleusch C., Hersch N., Hoffmann B., Merkel R., Csiszar A. Fluorescent lipids: functional parts of fusogenic liposomes and tools for cell membrane labeling and visualization. Molecules. 2012;17:1055–1073. doi: 10.3390/molecules17011055. [DOI] [PMC free article] [PubMed] [Google Scholar]
- Makinen V.P., Tynkkynen T., Soininen P., Forsblom C., Peltola T., Kangas A.J., Groop P.H., Ala-Korpela M. Sphingomyelin is associated with kidney disease in type 1 diabetes (The FinnDiane Study) Metabolomics. 2012;8:369–375. doi: 10.1007/s11306-011-0343-y. [DOI] [PMC free article] [PubMed] [Google Scholar]
- Martinez T.N., Chen X., Bandyopadhyay S., Merrill A.H., Tansey M.G. Ceramide sphingolipid signaling mediates Tumor Necrosis Factor (TNF)-dependent toxicity via caspase signaling in dopaminergic neurons. Mol. Neurodegener. 2012;7:45. doi: 10.1186/1750-1326-7-45. [DOI] [PMC free article] [PubMed] [Google Scholar]
- Miyamoto S., Sharma K. Adipokines protecting CKD. Nephrol. Dial. Transplant. 2013;28(Suppl. 4):iv15–iv22. doi: 10.1093/ndt/gft261. [DOI] [PMC free article] [PubMed] [Google Scholar]
- Miyamoto S., Shikata K., Miyasaka K., Okada S., Sasaki M., Kodera R., Hirota D., Kajitani N., Takatsuka T., Kataoka H.U. Cholecystokinin plays a novel protective role in diabetic kidney through anti-inflammatory actions on macrophage: anti-inflammatory effect of cholecystokinin. Diabetes. 2012;61:897–907. doi: 10.2337/db11-0402. [DOI] [PMC free article] [PubMed] [Google Scholar]
- Muller L., Kailas A., Jackson S.N., Roux A., Barbacci D.C., Schultz J.A., Balaban C.D., Woods A.S. Lipid imaging within the normal rat kidney using silver nanoparticles by matrix-assisted laser desorption/ionization mass spectrometry. Kidney Int. 2015;88:186–192. doi: 10.1038/ki.2015.3. [DOI] [PMC free article] [PubMed] [Google Scholar]
- Qureshi A., Subathra M., Grey A., Schey K., Del Poeta M., Luberto C. Role of sphingomyelin synthase in controlling the antimicrobial activity of neutrophils against Cryptococcus neoformans. PLoS One. 2010;5 doi: 10.1371/journal.pone.0015587. [DOI] [PMC free article] [PubMed] [Google Scholar]
- Rath C.M., Alexandrov T., Higginbottom S.K., Song J., Milla M.E., Fischbach M.A., Sonnenburg J.L., Dorrestein P.C. Molecular analysis of model gut microbiotas by imaging mass spectrometry and nanodesorption electrospray ionization reveals dietary metabolite transformations. Anal. Chem. 2012;84:9259–9267. doi: 10.1021/ac302039u. [DOI] [PMC free article] [PubMed] [Google Scholar]
- Rosolowsky E.T., Skupien J., Smiles A.M., Niewczas M., Roshan B., Stanton R., Eckfeldt J.H., Warram J.H., Krolewski A.S. Risk for ESRD in type 1 diabetes remains high despite renoprotection. J. Am. Soc. Nephrol. 2011;22:545–553. doi: 10.1681/ASN.2010040354. [DOI] [PMC free article] [PubMed] [Google Scholar]
- Sharma K., Ramachandrarao S., Qiu G., Usui H.K., Zhu Y., Dunn S.R., Ouedraogo R., Hough K., McCue P., Chan L. Adiponectin regulates albuminuria and podocyte function in mice. J. Clin. Invest. 2008;118:1645–1656. doi: 10.1172/JCI32691. [DOI] [PMC free article] [PubMed] [Google Scholar]
- Sharma K., Karl B., Mathew A.V., Gangoiti J.A., Wassel C.L., Saito R., Pu M., Sharma S., You Y.H., Wang L. Metabolomics reveals signature of mitochondrial dysfunction in diabetic kidney disease. J. Am. Soc. Nephrol. 2013;24:1901–1912. doi: 10.1681/ASN.2013020126. [DOI] [PMC free article] [PubMed] [Google Scholar]
- Sigruener A., Kleber M.E., Heimerl S., Liebisch G., Schmitz G., Maerz W. Glycerophospholipid and sphingolipid species and mortality: the Ludwigshafen Risk and Cardiovascular Health (LURIC) study. PLoS One. 2014;9 doi: 10.1371/journal.pone.0085724. [DOI] [PMC free article] [PubMed] [Google Scholar]
- Smith C.A., O'Maille G., Want E.J., Qin C., Trauger S.A., Brandon T.R., Custodio D.E., Abagyan R., Siuzdak G. METLIN: a metabolite mass spectral database. Ther. Drug Monit. 2005;27:747–751. doi: 10.1097/01.ftd.0000179845.53213.39. [DOI] [PubMed] [Google Scholar]
- Solini A., Iacobini C., Ricci C., Chiozzi P., Amadio L., Pricci F., Di Mario U., Di Virgilio F., Pugliese G. Purinergic modulation of mesangial extracellular matrix production: role in diabetic and other glomerular diseases. Kidney Int. 2005;67:875–885. doi: 10.1111/j.1523-1755.2005.00152.x. [DOI] [PubMed] [Google Scholar]
- Sullards M.C., Liu Y., Chen Y., Merrill A.H., Jr. Analysis of mammalian sphingolipids by liquid chromatography tandem mass spectrometry (LC–MS/MS) and tissue imaging mass spectrometry (TIMS) Biochim. Biophys. Acta. 2011;1811:838–853. doi: 10.1016/j.bbalip.2011.06.027. [DOI] [PMC free article] [PubMed] [Google Scholar]
- Takemoto M., Asker N., Gerhardt H., Lundkvist A., Johansson B.R., Saito Y., Betsholtz C. A new method for large scale isolation of kidney glomeruli from mice. Am. J. Pathol. 2002;161:799–805. doi: 10.1016/S0002-9440(10)64239-3. [DOI] [PMC free article] [PubMed] [Google Scholar]
- Taniguchi M., Okazaki T. The role of sphingomyelin and sphingomyelin synthases in cell death, proliferation and migration-from cell and animal models to human disorders. Biochim. Biophys. Acta. 2014;1841:692–703. doi: 10.1016/j.bbalip.2013.12.003. [DOI] [PubMed] [Google Scholar]
- Walch A., Rauser S., Deininger S.O., Hofler H. MALDI imaging mass spectrometry for direct tissue analysis: a new frontier for molecular histology. Histochem. Cell Biol. 2008;130:421–434. doi: 10.1007/s00418-008-0469-9. [DOI] [PMC free article] [PubMed] [Google Scholar]
- Watrous J.D., Phelan V.V., Hsu C.C., Moree W.J., Duggan B.M., Alexandrov T., Dorrestein P.C. Microbial metabolic exchange in 3D. ISME J. 2013;7:770–780. doi: 10.1038/ismej.2012.155. [DOI] [PMC free article] [PubMed] [Google Scholar]
- Wolf G., Haberstroh U., Neilson E.G. Angiotensin II stimulates the proliferation and biosynthesis of type I collagen in cultured murine mesangial cells. Am. J. Pathol. 1992;140:95–107. [PMC free article] [PubMed] [Google Scholar]
- Yadav H., Quijano C., Kamaraju A.K., Gavrilova O., Malek R., Chen W., Zerfas P., Zhigang D., Wright E.C., Stuelten C. Protection from obesity and diabetes by blockade of TGF-beta/Smad3 signaling. Cell Metab. 2011;14:67–79. doi: 10.1016/j.cmet.2011.04.013. [DOI] [PMC free article] [PubMed] [Google Scholar]
- Yano M., Watanabe K., Yamamoto T., Ikeda K., Senokuchi T., Lu M., Kadomatsu T., Tsukano H., Ikawa M., Okabe M. Mitochondrial dysfunction and increased reactive oxygen species impair insulin secretion in sphingomyelin synthase 1-null mice. J. Biol. Chem. 2011;286:3992–4002. doi: 10.1074/jbc.M110.179176. [DOI] [PMC free article] [PubMed] [Google Scholar]
- Zhao J., Miyamoto S., You Y.H., Sharma K. AMP-activated protein kinase (AMPK) activation inhibits nuclear translocation of Smad4 in mesangial cells and diabetic kidneys. Am. J. Physiol. Renal Physiol. 2015;308:F1167–F1177. doi: 10.1152/ajprenal.00234.2014. [DOI] [PMC free article] [PubMed] [Google Scholar]
- Ziyadeh F.N., Sharma K., Ericksen M., Wolf G. Stimulation of collagen gene expression and protein synthesis in murine mesangial cells by high glucose is mediated by autocrine activation of transforming growth factor-beta. J. Clin. Invest. 1994;93:536–542. doi: 10.1172/JCI117004. [DOI] [PMC free article] [PubMed] [Google Scholar]
Associated Data
This section collects any data citations, data availability statements, or supplementary materials included in this article.
Supplementary Materials
Supplementary figures.