

Abstract
Brain extracellular space (ECS) is an interconnected channel that allows diffusion-mediated transport of signaling molecules, metabolites, and drugs. We tested the hypothesis that β-adrenergic receptor (βAR) activation impacts extracellular diffusion-mediated transport of molecules through alterations in the morphology of astrocytes. Two structural parameters of ECS - volume fraction and tortuosity - govern extracellular diffusion. Volume fraction (α) is the volume of ECS relative to the total tissue volume. Tortuosity (λ) is a measure of the hindrance that molecules experience in the ECS, compared to a free medium. The Real-Time Iontophoretic (RTI) method revealed that treatment of acutely prepared visual cortical slices of adult female rats with a βAR agonist, DL-isoproterenol (ISO), decreases α significantly, from 0.22 ± 0.03 (mean ± SD) for controls without agonist to 0.18 ± 0.03 with ISO, without altering λ (control: 1.64 ± 0.04; ISO: 1.63 ± 0.04). Electron microscopy revealed that the ISO treatment significantly increased the cytoplasmic area of astrocytic distal endings per unit area of neuropil by 54%. These findings show that norepinephrine decreases α, in part, through an increase in astrocytic volume following βAR activation. Norepinephrine is recognized to be released within the brain during the awake state and increase neurons’ signal-to-noise ratio through modulation of neurons’ biophysical properties. Our findings uncover a new mechanism for noradrenergic modulation of neuronal signals. Through astrocytic activation leading to a reduction of α, noradrenergic modulation increases extracellular concentration of neurotransmitters and neuromodulators, thereby facilitating neuronal interactions, especially during wakefulness.
Keywords: extracellular space, volume fraction, tortuosity, diffusion, astrocyte, adrenergic system, isoproterenol, Real-Time Iontophoretic method, electron microscopy, sleep-wake cycle
Graphical Abstract
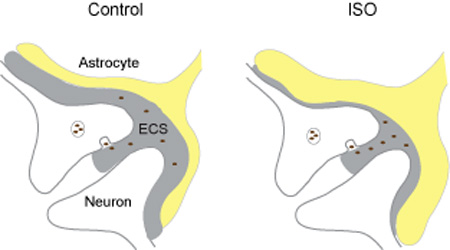
The authors show, for the first time, that isoproterenol (ISO)-mediated reduction of extracellular space (ECS) volume in the visual cortex is through activation of β–adrenergic receptors (βAR). This reduction of ECS volume is in part due to expansion of distal astrocytic processes (ISO). This study implies that βAR-induced shrinkage of ECS increases the concentration of neuroactive substances, thereby impacting neuronal communication, neuron-glia interactions, and processing of sensory information in the visual cortex during global release of norepinephrine.
INTRODUCTION
Astrocytic morphology is remarkably complex. The few major processes that they have branch repeatedly and extend into fine thread-like non-overlapping processes. These fine processes ensheath dendritic shafts and spines, somata, and axon terminals of neurons, constitute glial limitans, and form glial end-feet that contribute to the blood-brain barrier (Kosaka and Hama, 1986; Grosche et al., 1999). These astrocytic processes also contribute to the geometry and diffusion properties of the ECS (Sykova and Nicholson, 2008; Xiao et al., 2015).
Astrocytic morphology changes in response to various stimuli, including an enriched environment, enhanced sensory activation, learning, and reproductive states (Theodosis et al., 2008). Altered astrocytic morphology, in turn, influences extracellular homeostasis, intercellular signaling, and neuronal activity. In the hypothalamus, astrocytic structural plasticity facilitates the release of hormones by adjacent neurons (Hatton, 1997) and enhances diffusion-based extracellular signaling, along with inter-synaptic crosstalk (Piet et al., 2004).
The major noradrenergic input to cortex arises from the locus coeruleus (LC) (Foote et al., 1983). LC-noradrenergic activity plays a causal role in cortical arousal, and is also important for regulating stress and cognitive functions (Berridge and Waterhouse, 2003). Studies in cultures have shown that the morphological alteration of astrocytic processes is often induced by noradrenergic signals (Shain et al., 1987; Bicknell et al., 1989). However, very little is known about plasticity of astrocytic morphology in intact 3-dimentional (3D) cortical tissue, such as the visual cortex, where Aoki (1992) reported a rich expression of astrocytic βAR, exceeding the levels found in neurons (Aoki, 1992; Aoki, 1997). Moreover, no single study has yet combined analysis of astrocyte morphology with the analysis of the geometry and diffusion properties of the ECS to determine whether these components are functionally linked during βAR activation. In this study, we utilized a selective β-adrenergic agonist, ISO, to analyze its effect on ECS structural parameters of acutely prepared slices of adult rat visual cortex and followed this with morphological analysis of astrocytic processes.
Two macroscopic parameters of ECS structure, volume fraction and tortuosity, govern extracellular diffusion and shape the spatiotemporal distribution of substances diffusing in the ECS. Volume fraction is the proportion of tissue volume occupied by ECS (α = VECS/Vtissue). Tortuosity is the hindrance imposed on diffusing molecules by the tissue compared to an obstacle-free medium (λ = (D/D*)1/2 where D is a free diffusion coefficient and D* is an effective diffusion coefficient, cm2s−1). The concentration of a diffusing substance is primarily influenced by volume fraction while tortuosity imposes delays in the movement of molecules. Both parameters of the ECS structure affect chemical signaling among neurons and glia. In a healthy isotropic brain region in anesthetized animals and in brain slices, α is about 0.2 and λ is about 1.6 (Nicholson, 2001; Sykova and Nicholson, 2008). The first study of ECS parameters in vivo during sleep-wake cycle reported that α was only 0.14 in the neocortex of awake mice but that it increased to about 0.23 during sleep and when adrenergic signaling was inhibited by mixture of adrenergic antagonists (Xie et al., 2013).
Using the Real-Time Iontophoretic (RTI) method (Nicholson and Phillips, 1981), we measured diffusion of tetramethylammonium (TMA+, MW 74) to quantify α and λ in acutely prepared slices of visual cortex exposed to ISO. The same preparation was employed to assess the morphology of astrocytic processes with electron microscopy (EM). Our rationale for using EM was to enable us to analyze the most distal portions of astrocytic processes that constitute about 85% of astrocytic volume (Bushong et al., 2002). These distal processes are nearly impossible to visualize systematically or identify as astrocytic by light microscopy alone because fine processes are below the limit of resolution of light microscopy and because the molecular marker, glial fibrillary acidic protein (GFAP), is limited to the proximal portions of astrocytic processes (Grosche et al., 1999). These distal portions of astrocytes are crucial elements, because they surround and interdigitate between the neurotransmitter releasing and sensing regions of neurons – i.e., the synaptic portions of dendritic spines and axons – and also are richly endowed with βARs (Aoki, 1992; Aoki, 1997). We chose to treat tissue with ISO at a concentration of 2 µM and over a period lasting 30 to 90 min, since (1) these parameters were previously shown to evoke morphological changes upon cultured astrocytes (Shain et al., 1987; Vardjan et al., 2014), (2) provided sufficient time for the drug to equilibrate through the thickness of the acutely prepared cortical slice (Hrabetova and Nicholson, 2007) and (3) has been shown to be the range of time during which cortical norepinephrine can become and remain elevated in association with behavioral tasks requiring vigilance (Dalley et al., 2001).
MATERIALS AND METHODS
Preparation of brain slices and adrenergic agonist solution
Experiments were performed at SUNY Downstate Medical Center in accordance with the National Institute of Health Guidelines and local Institutional Animal Care and Use Committee regulations. In this study, we used nine female Sprague-Dawley rats (6–8 weeks, 127–233 g). Control ECS parameters between female (Sherpa et al., 2014) and male (Yao et al., 2008; Dmytrenko et al., 2013; Xie et al., 2013) rodents are similar. Nevertheless, female rats, 6–8 weeks old, were chosen in order to be able to compare ECS parameters obtained in this study with previous data from this lab that also used a similar age-group of female rats (Hrabetova, 2005; Sherpa et al., 2014; Xiao et al., 2015). Moreover, slice preparation in older animals is challenging because the skull hardens considerably. Lehmenkuhler et al. (1993) found that ECS parameters attain adult-like stage by postnatal day 23. This finding led us to expect that data obtained from 6–8 week old rats would be representative of adult-tissue. The animals were anesthetized with sodium pentobarbital (50 mg/kg i.p.) and decapitated. Coronal slices (400 µm) containing the visual cortex were prepared from each brain using a microtome with vibrating blade (Leica VT1200 S; Leica Microsystems GmbH, Wetzlar, Germany) while immersing the brain in artificial cerebrospinal fluid (ACSF), as described previously (Sherpa et al., 2014). ACSF was comprised of (mM): NaCl 124, KCl 5, NaHCO3 26, NaH2PO4 1.25, D-Glucose 10, MgCl2 1.3 and CaCl2 1.5, and gassed continuously with 95% O2 and 5% CO2 mixture to buffer at pH 7.4. The osmolality of the ACSF measured via a freezing point-depression osmometer (Osmette A No.5002; Precision Systems, Natick, MA, USA) was 295–305 mosmol/kg.
The β-adrenergic receptor agonist ISO (DL-isoproterenol, cat #I5627; Sigma-Aldrich, St. Louis, MO) is typically used at concentrations ranging from 0.1 µM to 40 µM (Shain et al., 1987; Kirkwood et al., 1999; Vardjan et al., 2014). We chose the concentration of 2 µM, based on studies reporting its effect of changing the morphology of cultured astrocytes over a period of 30 – 60 min (Shain et al., 1987; Vardjan et al., 2014), and to be sub-threshold for evoking β-adrenergic receptor desensitization (Wagner and Davis, 1979). Ascorbate (200 µM; cat# 11140; Sigma-Aldrich) was added to prevent ISO oxidation (Bicknell et al., 1989; Kirkwood et al., 1999).
Preparation of slices for the Real-Time Iontophoretic method
Altogether 5 rat brains were used for RTI experiments. Coronal slices were allowed to recover in the ACSF at room temperature for at least an hour after dissection. After recovery, a brain slice was placed in a submersion recording chamber (Warner model RC-27L; Harvard Apparatus, Holliston, MA, USA), where it was superfused with ACSF at a flow rate of 2.0 mL/min. The temperature of ACSF in the recording chamber was maintained at 34 ± 1°C with a dual automatic temperature controller (Warner model TC-344B; Harvard Apparatus) and an in-line heater (Warner model SH-27A; Harvard Apparatus). Slices were incubated at this temperature, which is a few degrees below the normal body temperature, in order to prolong slice viability (Kil et al., 1996). Lower temperature has been shown not to impact ECS parameters. Previous studies demonstrated that λ and α in cortical slices incubated at 22–26°C and 33°C are similar to those measured in cortex in vivo at 37°C (Yao et al., 2008; Dmytrenko et al., 2013). The ACSF used for slice incubation and for diffusion measurements contained 0.5 mM TMA+ and 200 µM ascorbate. TMA+ was added for calibration purpose and ascorbate was added to prevent oxidation of ISO, as described above. Previous studies showed that ascorbate did not significantly change the ECS parameters measured with the RTI method in rat neocortical slices (Perez-Pinzon et al., 1995).
Real –Time Iontophoretic method
The RTI method (Nicholson and Phillips, 1981) is a diffusion-based technique that employs an ion-selective microelectrode (ISM) to detect ions, such as TMA+, released iontophoretically from a second microelectrode placed at a fixed distance (typically 100 µm) from the ISM. The microelectrodes were prepared from a double-barreled glass (TG200-4; Harvard Apparatus) as described previously (Sherpa et al., 2014). The iontophoretic microelectrode (both barrels) was backfilled with 150 mM TMA+ chloride. A constant positive bias current (20 nA) was applied to the iontophoretic microelectrode from a constant current, high impedance source (model PS-100 Iontophoresis Generator; Dagan Corporation, Minneapolis, MN, USA) to maintain a stable transport number (nt) at all times during the diffusion experiment (Nicholson and Phillips, 1981). The iontophoretic current was increased to 100–170 nA for 50 s to obtain a diffusion curve. The ion-detecting barrel of TMA+-ISM was backfilled with 150 mM TMA+ chloride and contained a short column of TMA+-detecting tetraphenylborate-based ion-exchanger (Corning exchanger 477317; currently available as IE 190 from WPI, Sarasota, FL, USA) in the tip. The DC potential-detecting reference barrel was backfilled with 150 mM NaCl. Each TMA+-ISM was calibrated in a set of standard solutions (0.5, 1, 2, 4, and 8 mM TMA+ in 150 mM NaCl) before and after each experiment. The calibration voltages were fitted to the Nikolsky equation to obtain the slope and the interference of each TMA+-ISM, which was used for voltage-to-concentration conversion (Nicholson, 1993). To test whether TMA+-ISM had any sensitivity to ISO, we calibrated several microelectrodes in a separate set of calibration solutions containing 2 µM ISO and 200 µM ascorbate. No effect of ISO on TMA+-ISM slope was found.
The recording chamber was mounted on a Burleigh Gibraltar platform with X-Y stage (EXFO Photonic Solution Inc., Mississauga, ON, Canada) and used along with a CCD camera (OLY 150; Olympus America Inc., Melville, NY, USA) attached to a compound microscope (BX51W1; Olympus America Inc.). The TMA+-ISM and iontophoretic microelectrodes were held 120 µm apart with two independent robotic manipulators (MP285; Sutter Instruments Co., Novato, CA, USA). A dual channel microelectrode preamplifier (model IX2-700; Dagan Corp.) was used to amplify the DC signal and TMA+ signal obtained by continuously subtracting the DC signal from that on the ion-detecting barrel. The TMA+ and DC signals were further amplified and low-pass filtered (2 Hz) using a CyberAmp 320 (Axon Instruments Inc., Union City, CA, USA). Amplified signals were digitized with an analog-to-digital converter (model PCI-MIO-16E-4; National Instruments, Austin, TX, USA) and acquired using the MATLAB-based program (MathWorks, Natick, MA, USA) WANDA (Hrabetova and Nicholson, 2007). The acquired diffusion curves were fitted with an appropriate solution of the diffusion equation using a MATLAB-based program WALTER (Hrabetova and Nicholson, 2007). A chart recorder was used to continuously monitor the TMA+ and DC signals.
Acquisition of diffusion records in a visual cortical slice (at a depth of 200 µm from the brain slice’s cut surface) and a dilute agarose gel (0.3% (w/v) in 150 mM NaCl; NuSieve GTG Agarose, cat# 50081, Lonza, Rockland, ME, USA) was performed as described previously (Sherpa et al., 2014). Diffusion measurements in the dilute agarose gel provided D of TMA+ and a transport number (nt) for the iontophoretic microelectrode. Measurements in the brain slice provided D*, α, and a nonspecific clearance k' (s−1) (Hrabetova and Nicholson, 2007). The tortuosity was calculated as λ = (D/D*)1/2. To verify the constancy of nt, additional measurements were taken in the dilute agarose gel after making brain measurements. ECS parameters obtained in acute brain slices incubated in the ACSF for up to eight hours after dissection are in a good agreement with the ECS parameters obtained in in vivo preparation (Yao et al., 2008), indicating stability and reliability of the RTI approach using TMA+ in in vitro and in vivo brain preparations.
The diffusion measurements were obtained from one slice per animal. Repeated diffusion measurements were taken from each slice under control condition, lasting about 30 minutes. Then, the agonist was applied, and repeated diffusion measurements were again taken during superfusion with ISO starting at about 30 min untill about 90 min. The mean values of pre-agonist and post-agonist measurements of α and λ were obtained for each slice and used for statistical analysis.
Preparation of tissue for electron microscopy
Altogether 4 rat brains were allotted for EM experiments. From each brain, multiple coronal slices were prepared. All slices were allowed to recover in the ACSF at room temperature for at least an hour after dissection, then divided across two groups: a control group (with or without 200 µM ascorbate) and an ISO group (2 µM ISO and 200 µM ascorbate). In order to prolong slice viability, slices were maintained at a temperature few degrees below the normal body temperature at 34°C for 70 minutes, with or without ISO, exactly as the slices for RTI measurements were treated. The incubation period was kept at 70 min, since this was shown to be the time range yielding stable recording of ECS by the RTI method in the presence of ISO (Fig. 1C). No significant differences in morphological parameters of astrocytic processes were observed between the ACSF only and ACSF plus 200 µM ascorbate conditions (data not shown). Therefore, data from samples in ACSF with and without ascorbate were pooled for the control group.
Figure 1.

Quantitative analysis of ECS parameters. A, Time line of RTI experiment. B, Representative diffusion curves in the visual cortex under control (green) and ISO (red) conditions. Theoretical curves (dashed black) from the fitting procedure are superimposed. TMA+ was released from an iontophoretic microelectrode (horizontal bar; nt = 0.32) placed 120 µm away from TMA+-ISM. The k' values were 0.007 s−1 (control) and 8.82 × 10⁻¹² s−1 (ISO). C, Time course of α and λ values from one experiment. D–E, Summary of α and λ values from all experiments (mean ± SD). Asterisk, significant; n.s., non-significant.
At the end of the 70 min exposure to ACSF with or without ISO, coronal slices from both groups were fixed by immersing them in 0.1 M phosphate buffer (pH 7.4) solution containing 4% paraformaldehyde and 1% glutaraldehyde and immediately microwave-irradiated (5–8 seconds; Model No. MW4370, Samsung) to reach as close as possible to 39°C, but not higher, to avoid microtubule depolymerization (Kirov et al., 1999). The microwave-fixed coronal slices were stored in the same fixative overnight and further processed for EM at New York University the following day.
Coronal slices from both groups were processed in parallel for plastic embedding, ultimately attaining 75 nm ultrathin sections that spanned layers 1 through 6 of visual cortex and oriented so as to be able to avoid sampling within 150 µm from surfaces of a vibrating blade microtome-sectioned 400 µm thick slice, where damage during the in vitro ‘live’ state would be maximal. The procedures for plastic embedding were as described previously (Aoki, 1992).
Electron microscopy analysis
The experimenter was blind to the experimental group during the digital electron microscopic image acquisition and quantitative analysis of images. We chose ultrathin sections that had adequate ultrastructural preservation, captured all cortical layers, and all depths from the surface of brain slices. The brain slice surface was verified, based on the characteristic zig-zag contour created by the vibratome’s blade. Images were acquired about 150 µm away from the vibrating-blade microtome slice edges. This procedure ensured that we avoided sampling from tissue regions damaged by the vibratome, and it also coincided with the region where RTI diffusion measurements were performed.
The random sampling strategy of electron micrographic images was systemized by analyzing all non-overlapping micrographs in the order that they were encountered. This procedure ensured sampling from an area spanning 2500 µm2 from one ultrathin section per animal, captured at a magnification 20,000×.
Astrocytic profiles in an electron micrograph were identified by the irregular contour of their plasma membrane, an electron-lucent cytoplasm, an absence of microtubules, a scarcity of organelles, an absence of PSDs (post-synaptic densities) and vesicle clusters (Peters et al., 1991). Glial fibrillary acidic protein bundles occurred only in large processes, proximal to the nucleus, so we did not rely on this feature for distal astrocytic profile identification (Peters et al., 1991). These morphological characteristics of astrocytic profiles contrast sharply from those described for microglial processes, the latter of which exhibit electron dense cytoplasm and contain multiple vesicles, vacuoles, and elongated endoplasmic reticulum (Tremblay et al., 2010; Sogn et al., 2013). We relied on the contrasting features of astrocytes versus microglia to discriminate one from the other.
We quantified total cytoplasmic area and total plasma membrane length of all astrocytic profiles encountered in an electron micrograph from layer 2. The neuropil area sampled per micrograph at a magnification 20,000× was 48.43 µm2. We outlined each profile using the software, ImageJ, version 1.46i (http://rsb.info.nih.gov/ij/). To eliminate the effect of over-counting profiles landing on the edge of an electron micrograph, we divided the total number of astrocytic profiles on edges of an electron micrograph by half and added this number to the number of whole astrocytic profiles encountered. The final sum provided the total number of astrocytic profiles in an electron micrograph. We also quantified a ratio of the plasma membrane length and (cytoplasmic area)1/2 for each individual astrocytic profile that was not at the edge of micrograph. Parts of blood vessels were captured in 6 electron micrographs from the control condition versus 10 from the ISO condition.
Statistical analysis
Statistical analysis was performed with SigmaStat 3.5 (Systat Software Inc.). Data obtained with the RTI method are presented as mean ± SD, with number of slices = number of animals. EM data are presented as mean ± SEM, pooled from multiple slices of the same condition and using N = number of electron micrographs for comparing the cytoplasmic area, plasma membrane and number of astrocytic processes per unit neuropil across the treatment conditions and N = number of astrocytic process, for comparisons of the astrocytic plasma membrane length-to-cytoplasmic area ratios. RTI and EM data were tested for normality and equal variance. RTI data were distributed normally while EM data did not pass either normality test or equal variance test. Therefore, a paired t-test and a non-parametric Mann-Whitney Rank Sum test were used to test differences between the two groups of RTI and EM data, respectively. Value of p < 0.05 was considered significant for both data sets.
RESULTS
Structural parameters of ECS measured with the RTI method in the visual cortex treated with ISO
We used the RTI method to measure ECS parameters in each slice during the control condition and during superfusion with ISO (Fig. 1A). Representative TMA+ diffusion curves obtained under the control and the ISO conditions and the time course of one experiment are shown in Figure 1B–C. Larger amplitude of the TMA+ diffusion curve from the ISO condition, compared to the control condition, implies a reduction in α in the ISO condition, which was observed within about 30 minutes of applying the ISO and was maintained at that level up to 90 minutes.
Statistical analysis of all data (5 slices; 5 animals; paired t-test) revealed that α was significantly reduced by ISO (control: 0.22 ± 0.03, ISO: 0.18 ± 0.03; p < 0.05; Fig. 1D). No significant change was found for λ (control: 1.64 ± 0.04, ISO: 1.63 ± 0.04; p = 0.79; Fig. 1E) or k' (control: 0.011 ± 0.005, ISO: 0.010 ± 0.007; p = 0.77). In summary, we found that α was reduced by about 20% during the ISO condition, while λ remained constant.
Quantitative electron microscopic assessment of the morphology of astrocytic profiles of visual cortex treated with ISO
We used EM to assess the morphology of astrocytic processes at the ultrastructural level in two groups of slices incubated in parallel, one with and one without ISO (Fig. 2A). Representative electron micrographs, captured at a magnification of 20,000x, obtained from the control condition and the ISO treated condition are shown in Figure 2B.
Figure 2.

Quantitative analysis of the morphology of astrocytic processes. A, Time line of EM experiment. B, Representative electron microscopic images of neuropil of the visual cortex under control and ISO conditions. Astrocytic profiles are colored in yellow. Scale bar: 500 nm. C–F, Summary of morphometric analyses (mean ± SEM); control: green, ISO: red; asterisk, significant.
Statistical analysis of all data (control: 126 micrographs, 8 slices; ISO: 84 micrographs, 7 slices; 4 animals; Mann-Whitney Rank Sum test) revealed that three quantitative parameters of astrocytic processes were greater under the ISO condition. These were the total cytoplasmic area of astrocytic processes (control: 1.31 ± 0.08 µm2, ISO: 2.02 ± 0.21 µm2, p < 0.05, Fig. 2C), the total plasma membrane length of astrocytic processes (control: 21.47 ± 0.89 µm, ISO: 29.11 ± 1.54 µm, p < 0.001; Fig. 2D), and the total number of astrocytic processes (control: 14.75 ± 0.55, ISO: 19.55 ± 1.07, p < 0.001; Fig. 2E).
To determine whether the shape of astrocytic processes underwent a significant modification during ISO application, we quantified a ratio of the plasma membrane length and (cytoplasmic area)1/2 for each individual profile (control: 1815 profiles, ISO: 1603 profiles). This ratio increased significantly, albeit slightly (control: 5.85 ± 0.03, ISO: 6.03 ± 0.04, Mann-Whitney Rank Sum test, p < 0.05; Fig. 1F).
In summary, we found significant alterations in morphological parameters of astrocytic processes treated with ISO, indicating a 54% increase in the total astrocytic cytoplasmic area per micrograph, a concomitant 36% increase in the total astrocytic plasma membrane per micrograph, a 33% increase in number or astrocytic profiles per micrograph, and a 3% increase in the plasma membrane-to-cytoplasmic area ratio per astrocytic profile.
Changes in ECS and astrocytic morphology compared
Quantitative RTI and EM analyses revealed that the ECS compartment is shrinking while the cytoplasmic compartment of astrocytes is expanding in rat visual cortex when βARs are activated with ISO. To compare a three-dimensional (3D) parameter (α of ECS) and 2D parameter (area of astrocytic processes) directly, we employed the Delesse Principle from quantitative stereology, which states that the volume fraction of a 3D homogenous structure can be estimated from 2D sections, simply by measuring the ratio of areas in the two phases (Underwood, 1970). The Delesse Principle thus allows us to convert the values of astrocytic processes areas measured in the control condition and in the ISO condition into the astrocytic volume estimates, and then to compare these estimates of astrocytic volumes with the values of α measured in the control conditions and in the ISO conditions. This approach was taken, in lieu of EM 3D serial reconstruction, so that we could analyze multiple samples across the ISO versus control conditions more efficiently (Umbriaco et al., 1994).
From EM images, we calculated a ratio of the total cytoplasmic area (µm2) of astrocytic processes and the area of an electron micrograph (48.43 µm2 at 20,000× magnification). In control conditions, the total volume fraction of astrocytic processes was 2.7 % (1.31/48.43) while it was 4.2 % (2.02/48.43) in the ISO condition. This represents a 1.5% increase. The RTI method directly measures the ratio of ECS volume to the tissue volume (i.e., ECS volume fraction, α). The change in α value from the control (21.9%) to the ISO condition (18.3%) represents a 3.6 % decrease. Taken together, we found that the expansion of astrocytic processes can explain, at least in part, the reduction of ECS volume in the ISO condition.
DISCUSSION
To the best of our knowledge, our study is the first to quantify the ECS parameters in cortical tissue during selective activation of βARs, which in vivo would be stimulated by a noradrenergic component of the ascending arousal system projecting from the LC (Berridge and Waterhouse, 2003). We tested the hypothesis that βAR activation impacts extracellular diffusion-mediated transport of molecules through alterations in the morphology of astrocytes. We found that ECS volume decreased significantly in the ISO condition and that increases in the volume of astrocytes can account for part of this.
Methodological considerations
One of the strengths of this study is that both ECS analysis and EM analysis of the cellular components forming the ECS were conducted in the same preparation – acutely excised cortex that was maintained alive through oxygenated ACSF. The similarity of the ECS parameters α and λ with the in vivo values obtained previously (Yao et al., 2008; Dmytrenko et al., 2013) indicates that our acute slice preparation captured the in vivo state well.
We chose not to analyze the ECS volume using EM images because ultrastructural analysis indicates that aldehyde causes >10% loss of ECS (Korogod et al., 2015). The loss of ECS due to aldehyde-fixation agrees with the report by Kinney et al. (2013) – namely an 8% reduction in α during fixation, dehydration, and tissue handling, which contributed to shrinkage of the total tissue volume. Although our preparation of tissue for EM circumvented the artifacts introduced by cardiac perfusion, our approach of rapid (<10 sec) microwave-fixation at the end of the incubation period in the ACSF, together with the dehydration required for plastic-embedding of the tissue, is likely to have reduced the ECS greatly.
Although both the deafferentation of acutely prepared slices and microwave-fixation may have altered the morphology of astrocytes, the experiment was designed to impose these treatments identically upon both the control and ISO groups, by treating the two groups strictly in parallel and identically. Therefore, the measured differences in α and astrocytic morphology can be ascribed to the effect of ISO exposure.
Generality of the ISO-mediated change in astrocytic morphology
It had previously been shown that cultured astrocytes from adult rat neurohypophyses (Hatton, 1997) and astrocyte-only cultures derived from postnatal day 2–3 rat cortex (Vardjan et al., 2014) alter their morphology upon activation of βAR. Our study differed from these previous studies, because astrocytes of our analyses were not cultured but instead kept alive within intact neuropil of acutely prepared cortical slices. Astrocytes of our study also differed by being within neuropil from an adult stage. Despite these differences in the preparation, we agree with previous studies that astrocytes respond to ISO with significant morphological changes, although we also found significant differences that are discussed below.
Activation of βAR activates cAMP-dependent protein kinases, which phosphorylate cytoskeletal proteins, GFAP, and vimentin, to alter astrocytic morphology in culture over a period of 30 – 60 min (Shain et al., 1987; Vardjan et al., 2014) and also induces depolymerization of actin (Goldman and Abramson, 1990). Because GFAP is localized to proximal portions of astrocytic processes, while actin filaments are distributed more distally (Peters et al., 1991), all of these changes to the cytoskeleton of astrocytes can support both global as well as the finest morphological change upon astrocytes. In particular, Vardjan et al. (2014) examined GFAP-immunolabeled portions of astrocytes, i.e. cell soma and the proximal processes, while the great majority of our samples were of the GFAP-lacking, therefore distal, portions. Vardjan et al. (2014) found that ISO reduced cross-sectional area of GFAP-containing portions of cultured astrocytic processes, along with transformation from a flattened polygonal morphology to a mature stellate morphology. Similar transformation in morphology has been reported in cultured pituicytes from adult rat neurohypophysis, albeit without quantitative analysis (Bicknell et al., 1989). By contrast, we found that ISO increases cross-sectional area of the more distal portions of astrocytic profiles within intact cortical neuropil. Taken together, it may be that some of the astrocytic volume in the proximal portion has been pushed out to distal processes. However, since we did not measure the change evoked by ISO upon proximal portions of astrocytes, this idea remains speculative. Our studies differ from and complement Vardjan’s in another way. Since astrocytes of their preparation were grown in culture dishes in the absence of norepinephrine, their treatments evoked the very first noradrenergic response of astrocytes to the agonist. This first response to the agonist is likely to be reflecting the supersensitivity of β-adrenergic receptors, due to the absence of the agonist (Sporn et al., 1977; Mahan et al., 1987). In contrast, astrocytes of our preparation matured within intact cortical neuropil with intact noradrenergic innervation. Therefore, astrocytes of our system were exhibiting responses within the adult neuropil, rather than developmental or supersensitized responses.
Fine distal processes of astrocytes encompass dendritic spines, axons and terminals; they are abundant in actin and are thus potentially most motile and plastic (Goldman and Abramson, 1990). Therefore, our morphological data reflect the β-adrenergic responsivity in the interplay between the morphologically most dynamic extensions of astrocytes and neurons. Additional reasons for our differences could be that the structurally undifferentiated cultured astrocytes and the mature astrocytes respond differently to ISO or that the astrocytes cultured in the absence of neurons and the astrocytes surrounded by an intact extracellular microenvironment and neurons respond differently to ISO. Vardjan’s analysis also necessarily excluded any processes less than 200 nm in diameter, because of the inherent resolution limit of confocal microscopes (~200 nm diameter) and even more severe limitations for quantitating the extent of change.
Similarly to the study of Vardjan et al. (2014), we found that ISO increased the perimeter of astrocytic processes in cortical slices. This increase suggests new membrane synthesis, which may allow for repositioning of neurotransmitter transporters, ionic channels, and aquaporin channels. The significant increase in the ratio of the plasma membrane length to (cytoplasmic area)1/2 for each astrocytic profile caused by ISO suggests that the shape of distal astrocytic processes was altered, which may have led to the formation of additional processes.
Functional significance of the ISO-mediated decrease in α of the ECS
ECS parameters measured in rat visual cortex slices under the control condition (α = 0.22, λ = 1.62) are in a good agreement with the values of α and λ measured previously in mouse neocortex in vitro and in vivo (Yao et al., 2008; Dmytrenko et al., 2013). To the best of our knowledge, our study is the first to quantify the ECS parameters in a neocortical tissue during a selective activation of βARs, which in vivo would be stimulated during arousal (Berridge and Waterhouse, 2003). We found that α significantly decreased in ISO condition while λ did not change. Furthermore, employing ultrastructural analysis in the same brain slice preparation, we identified astrocytes as one cell type that increases its volume in ISO condition and we estimated that this volume change can account, at least in part, for reduced α.
ECS parameters have been quantified in many brain regions of different species (Sykova and Nicholson, 2008) but most studies were either in sleeping animals or in in vitro preparation of brain slices. Recently, Xie et al. (2013) reported that α was only 0.14 in the neocortex of awake mice but increased to 0.23 when animals fell asleep or were anesthetized; λ remained unchanged (λ = 1.3–1.8). Interestingly, α in awake mice increased from 0.14 to 0.23 when noradrenergic system was inhibited by a mixture of noradrenergic antagonists, implying that inhibition of noradrenergic signaling transits α from the awake-like state to the sleep-like state.
Our work complements Xie et al. (2013) study with respect to how adrenergic signaling affects α: we show that activation of βARs mimics the transition of brain slices from a sleep-like state to an awake-like state, based on the change of α. But there are some differences between these two studies. While the inhibition of adrenergic signaling in awake mice increased α from 0.14 to 0.23 (Xie et al., 2013), the activation of βARs decreased the value of α from 0.22 to only 0.18. One explanation is that Xie et al. (2013) completely blocked adrenergic signaling using a mixture of noradrenergic antagonists acting on β, α1, and α2 adrenergic receptors while we engaged adrenergic targets only in part, having employed a selective βAR agonist. Alternatively, since we performed our measurements in brain slices, we worked with a system that lacks an intact LC connection and, possibly, tonic adrenergic levels. This deafferentation may have altered the way in which the tissue responds to βAR agonists.
Reduction of α in ISO conditions alters the spatiotemporal distribution of neuroactive substances diffusing in the ECS, such neuropil in ISO condition simultaneously experiences higher concentrations of released ions, neurotransmitters and neuromodulators. This would lead to spatiotemporal enhancement of their actions on target sites.
Future studies
In this study, we chose not to analyze neuronal profiles, because β-adrenergic receptor immunoreactivity is approximately nine-fold more prevalent in astrocytic processes than in neuronal processes within adult neocortex (Aoki, 1997; Aoki and Erisir, 2012). At present, it remains unknown whether microglia respond to β-receptor agonists with morphological changes, as does astrocytes. Given that microglia have been shown to play an integral role in experience-dependent synaptic plasticity, future studies that specifically examine changes evoked concurrently upon microglia, synapses and astrocytes by β-receptor agonists would be worthwhile.
Significance to sleep-wake transitions
The rise of norepinephrine in the neocortex following LC firing causes the transition of cortical activity from the sleep to the awake state (Aston-Jones and Bloom, 1981; Constantinople and Bruno, 2011) and increases in the signal-to-noise ratio (Hasselmo et al., 1997; Ikeda et al., 2015; however see Sato et al., 1989). Our studies suggest that βAR-induced change in the astrocytic morphology impacts concentration of neuroactive substances via reduction in α, revealing an important functional mechanism for neuronal communication, neuron-glia interactions and processing of sensory information in the visual cortex during the awake state.
Acknowledgments
The authors are grateful to Charles Nicholson and Robert Colbourn for critical reading of the article. The Matlab-based software for diffusion experiments (WANDA and WALTER) used in this study was developed by Prof. L. Tao and Prof. C. Nicholson at NYU School of Medicine.
FUNDING INFORMATION
This work was supported by the NIH NINDS grants R56 NS047557 and R01 NS047557 (to S.H. and C.A.), and by the NIH NEI grant P30 EY013079 (to C.A.).
Footnotes
AUTHOR ROLES
C.A. and S.H. designed research; A.D.S., F.X., C.A. and S.H. performed research; A.D.S., F.X., N.J., C.A. and S.H. analyzed data; A.D.S., C.A. and S.H. wrote paper.
REFERENCES
- Aoki C. Beta-adrenergic receptors: astrocytic localization in the adult visual cortex and their relation to catecholamine axon terminals as revealed by electron microscopic immunocytochemistry. J Neurosci. 1992;12:781–792. doi: 10.1523/JNEUROSCI.12-03-00781.1992. [DOI] [PMC free article] [PubMed] [Google Scholar]
- Aoki C. Differential timing for the appearance of neuronal and astrocytic beta-adrenergic receptors in the developing rat visual cortex as revealed by light and electron-microscopic immunohistochemistry. Vis Neurosci. 1997;14:1129–1142. doi: 10.1017/s0952523800011822. [DOI] [PubMed] [Google Scholar]
- Aoki C, Erisir A. 2012. Experience-dependent developmental plasticity of synapses in the sensory cortex In: Pickel VA Segal M, editors, Johnson J, senior editor. Neuroscience-Net Book 3: The Synapse: Structure and Function; www.neuroscience.com [Google Scholar]
- Aston-Jones G, Bloom FE. Activity of norepinephrine-containing locus coeruleus neurons in behaving rats anticipates fluctuations in the sleep-waking cycle. J Neurosci. 1981;1:876–886. doi: 10.1523/JNEUROSCI.01-08-00876.1981. [DOI] [PMC free article] [PubMed] [Google Scholar]
- Berridge CW, Waterhouse BD. The locus coeruleus-noradrenergic system: modulation of behavioral state and state-dependent cognitive processes. Brain Res Rev. 2003;42:33–84. doi: 10.1016/s0165-0173(03)00143-7. [DOI] [PubMed] [Google Scholar]
- Bicknell RJ, Luckman SM, Inenaga K, Mason WT, Hatton GI. Beta-adrenergic and opioid receptors on pituicytes cultured from adult rat neurohypophysis: regulation of cell morphology. Brain Res Bull. 1989;22:379–388. doi: 10.1016/0361-9230(89)90065-8. [DOI] [PubMed] [Google Scholar]
- Bushong EA, Martone ME, Jones YZ, Ellisman MH. Protoplasmic astrocytes in CA1 stratum radiatum occupy separate anatomical domains. J Neurosci. 2002;22:183–192. doi: 10.1523/JNEUROSCI.22-01-00183.2002. [DOI] [PMC free article] [PubMed] [Google Scholar]
- Constantinople CM, Bruno RM. Effects and mechanisms of wakefulness on local cortical networks. Neuron. 2011;69:1061–1068. doi: 10.1016/j.neuron.2011.02.040. [DOI] [PMC free article] [PubMed] [Google Scholar]
- Dalley JW, McGaughy J, O’Connell MT, Cardinal RN, Levita L, Robbins TW. Distinct changes in cortical acetylcholine and noradrenaline efflux during contingent and noncontingent performance of a visual attentional task. J Neurosci. 2001;21:4908–4914. doi: 10.1523/JNEUROSCI.21-13-04908.2001. [DOI] [PMC free article] [PubMed] [Google Scholar]
- Dmytrenko L, Cicanic M, Anderova M, Vorisek I, Ottersen OP, Sykova E, Vargova L. The impact of alpha-syntrophin deletion on the changes in tissue structure and extracellular diffusion associated with cell swelling under physiological and pathological conditions. PLoS ONE. 2013;8:1–12. doi: 10.1371/journal.pone.0068044. [DOI] [PMC free article] [PubMed] [Google Scholar]
- Foote SL, Bloom FE, Aston-Jones G. Nucleus locus coeruleus: new evidence of anatomical and physiological specificity. Physiol Rev. 1983;63:844–914. doi: 10.1152/physrev.1983.63.3.844. [DOI] [PubMed] [Google Scholar]
- Goldman JE, Abramson B. Cyclic AMP-induced shape changes of astrocytes are accompanied by rapid depolymerization of actin. Brain Res. 1990;528:189–196. doi: 10.1016/0006-8993(90)91657-3. [DOI] [PubMed] [Google Scholar]
- Grosche J, Matyash V, Möller T, Verkhratsky A, Reichenbach A, Kettenmann H. Microdomains for neuron-glia interaction: parallel fiber signaling to Bergmann glial cells. Nat Neurosci. 1999;2:139–143. doi: 10.1038/5692. [DOI] [PubMed] [Google Scholar]
- Hasselmo ME, Linster C, Patil M, Ma D, Cekic M. Noradrenergic suppression of synaptic transmission may influence cortical signal-to-noise ratio. J Neurophysiol. 1997;77:3326–3339. doi: 10.1152/jn.1997.77.6.3326. [DOI] [PubMed] [Google Scholar]
- Hatton GI. Function-related plasticity in hypothalamus. Annu Rev Neurosci. 1997;20:375–397. doi: 10.1146/annurev.neuro.20.1.375. [DOI] [PubMed] [Google Scholar]
- Hrabetova S. Extracellular diffusion is fast and isotropic in the stratum radiatum of hippocampal CA1 region in rat brain slices. Hippocampus. 2005;15:441–450. doi: 10.1002/hipo.20068. [DOI] [PubMed] [Google Scholar]
- Hrabetova S, Nicholson C. Biophysical properties of brain extracellular space explored with ion-selective microelectrodes, integrative optical imaging and related techniques. In: Michael AC, Borland LM, editors. Electrochemical Methods for Neuroscience. Florida: CRC; 2007. pp. 167–204. [PubMed] [Google Scholar]
- Ikeda MZ, Jeon SD, Cowell RA, Remage-Healey L. Norepinephrine modulates coding of complex vocalizations in the songbird auditory cortex independent of local neuroestrogen synthesis. J Neurosci. 2015;35:9356–9368. doi: 10.1523/JNEUROSCI.4445-14.2015. [DOI] [PMC free article] [PubMed] [Google Scholar]
- Kil HY, Zhang J, Piantadosi CA. Brain temperature alters hydroxyl radical production during cerebral ischemia/reperfusion in rats. J Cereb Blood Flow Metab. 1996;16:100–106. doi: 10.1097/00004647-199601000-00012. [DOI] [PubMed] [Google Scholar]
- Kinney JP, Spacek J, Bartol TM, Bajaj CL, Harris KM, Sejnowski TJ. Extracellular sheets and tunnels modulate glutamate diffusion in hippocampal neuropil. J Comp Neurol. 2013;521:448–464. doi: 10.1002/cne.23181. [DOI] [PMC free article] [PubMed] [Google Scholar]
- Kirkwood A, Rozas C, Kirkwood J, Perez F, Bear MF. Modulation of long-term synaptic depression in visual cortex by acetylcholine and norepinephrine. J Neurosci. 1999;19:1599–1609. doi: 10.1523/JNEUROSCI.19-05-01599.1999. [DOI] [PMC free article] [PubMed] [Google Scholar]
- Kirov SA, Sorra KE, Harris KM. Slices have more synapses than perfusion-fixed hippocampus from both young and mature rats. J Neurosci. 1999;19:2876–2886. doi: 10.1523/JNEUROSCI.19-08-02876.1999. [DOI] [PMC free article] [PubMed] [Google Scholar]
- Korogod N, Petersen CCH, Knott GW. Ultrastructural analysis of adult mouse neocortex comparing aldehyde perfusion with cryo fixation. eLife. 2015;4:e05793. doi: 10.7554/eLife.05793. [DOI] [PMC free article] [PubMed] [Google Scholar]
- Kosaka T, Hama K. Three-dimensional structure of astrocytes in the rat dentate gyrus. J Comp Neurol. 1986;249:242–260. doi: 10.1002/cne.902490209. [DOI] [PubMed] [Google Scholar]
- Lehmenkuhler A, Sykova E, Svoboda J, Zilles K, Nicholson C. Extracellular space parameters in the rat neocortex and subcortical white matter during postnatal development determined by diffusion analysis. Neurosciene. 1993;55:339–351. doi: 10.1016/0306-4522(93)90503-8. [DOI] [PubMed] [Google Scholar]
- Mahan LC, McKernan RM, Insel PA. Metabolism of alpha- and beta-adrenergic receptors in vitro and in vivo. Annu Rev Pharmacol Toxicol. 1987;27:215–235. doi: 10.1146/annurev.pa.27.040187.001243. [DOI] [PubMed] [Google Scholar]
- Nicholson C. Ion-selective microelectrodes and diffusion measurements as tools to explore the brain cell microenvironment. J Neurosci Methods. 1993;48:199–213. doi: 10.1016/0165-0270(93)90092-6. [DOI] [PubMed] [Google Scholar]
- Nicholson C. Diffusion and related transport mechanism in brain tissue. Rep Prog Phys. 2001;64:815–884. [Google Scholar]
- Nicholson C, Phillips JM. Ion diffusion modified by tortuosity and volume fraction in the extracellular microenvironment of the rat cerebellum. J Physiol. 1981;321:225–257. doi: 10.1113/jphysiol.1981.sp013981. [DOI] [PMC free article] [PubMed] [Google Scholar]
- Perez-Pinzon MA, Tao L, Nicholson C. Extracellular potassium, volume fraction, and tortuosity in rat hippocampal CA1, CA3, and cortical slices during ischemia. J Neurophysiol. 1995;74:565–573. doi: 10.1152/jn.1995.74.2.565. [DOI] [PubMed] [Google Scholar]
- Peters A, Palay SL, Webster H, de F. The fine structure of the nervous system: neurons and their supporting cells. New York: Oxford UP; 1991. [Google Scholar]
- Piet R, Vargova L, Sykova E, Poulain DA, Oliet SHR. Physiological contribution of the astrocytic environment of neurons to intersynaptic crosstalk. Proc Natl Acad Sci U S A. 2004;101:2151–2155. doi: 10.1073/pnas.0308408100. [DOI] [PMC free article] [PubMed] [Google Scholar]
- Sato H, Fox K, Daw NW. Effect of electrical stimulation of locus coeruleus on the activity of neurons in the cat visual cortex. J Neurophysiol. 1989;62:946–958. doi: 10.1152/jn.1989.62.4.946. [DOI] [PubMed] [Google Scholar]
- Shain W, Forman DS, Madelian V, Turner JN. Morphology of astroglial cells is controlled by beta-adrenergic receptors. J Cell Biol. 1987;105:2307–2314. doi: 10.1083/jcb.105.5.2307. [DOI] [PMC free article] [PubMed] [Google Scholar]
- Sherpa AD, van de Nes P, Xiao F, Weedon J, Hrabetova S. Gliotoxin-induced swelling of astrocytes hinders diffusion in brain extracellular space via formation of dead-space microdomains. Glia. 2014;62:1053–1065. doi: 10.1002/glia.22661. [DOI] [PMC free article] [PubMed] [Google Scholar]
- Sogn CJ, Puchades M, Gundersen V. Rare contacts between synapses and microglial processes containing high levels of Iba1 and actin—a postembedding immunoglod study in the healthy rat brain. Eur J Neurosci. 2013;38:2030–2040. doi: 10.1111/ejn.12213. [DOI] [PubMed] [Google Scholar]
- Sporn JR, Wolfe BB, Harden TK, Molinoff PB. Supersensitivity in rat cerebral cortex: pre- and postsynaptic effects of 6-hydroxydopamine at noradrenergic synapses. Mol Pharmacol. 1977;13:1170–1180. [PubMed] [Google Scholar]
- Sykova E, Nicholson C. Diffusion in brain extracellular space. Physiol Rev. 2008;88:1277–1340. doi: 10.1152/physrev.00027.2007. [DOI] [PMC free article] [PubMed] [Google Scholar]
- Theodosis DT, Poulain DA, Oliet SHR. Activity-dependent structural and functional plasticity of astrocyte-neuron interactions. Physiol Rev. 2008;88:983–1008. doi: 10.1152/physrev.00036.2007. [DOI] [PubMed] [Google Scholar]
- Tremblay M-E, Lowery RL, Majewska AK. Microglial interactions with synapses are modulated by visual experience. PLOS Biol. 2010;8:e1000527. doi: 10.1371/journal.pbio.1000527. [DOI] [PMC free article] [PubMed] [Google Scholar]
- Umbriaco D, Watkins KC, Descarries L, Cozzari C, Hartman BK. Ultrastructural and morphometric features of the acetylcholine innervation in adult rat parietal cortex: an electron microscopic study in serial sections. J Comp Neurol. 1994;348:351–373. doi: 10.1002/cne.903480304. [DOI] [PubMed] [Google Scholar]
- Underwood EE. Quantitative stereology. Reading, MA: Addison-Wesley; 1970. [Google Scholar]
- Vardjan N, Kreft M, Zorec R. Dynamics of β-adrenergic/cAMP signaling and morphological changes in cultured astrocytes. Glia. 2014;62:566–579. doi: 10.1002/glia.22626. [DOI] [PubMed] [Google Scholar]
- Wagner HR, Davis JN. beta-Adrenergic receptor regulation by agonists and membrane depolarization in rat brain slices. Proc Natl Acad Sci U S A. 1979;76:2057–2061. doi: 10.1073/pnas.76.4.2057. [DOI] [PMC free article] [PubMed] [Google Scholar]
- Xiao F, Hrabe J, Hrabetova S. Anomalous diffusion in rat cerebellum. Biophys J. 2015;108:2384–2395. doi: 10.1016/j.bpj.2015.02.034. [DOI] [PMC free article] [PubMed] [Google Scholar]
- Xie L, Kang H, Xu Q, Chen MJ, Liao Y, Thiyagarajan M, O’Donnell J, Christensen DJ, Nicholson C, Iliff JJ, Takano T, Deane R, Nedergaard M. Sleep drives metabolic clearance from the adult brain. Science. 2013;342:373–377. doi: 10.1126/science.1241224. [DOI] [PMC free article] [PubMed] [Google Scholar]
- Yao X, Hrabetova S, Nicholson C, Manley GT. Aquaporin-4-deficient mice have increased extracellular space without tortuosity change. J Neurosci. 2008;28:5460–5464. doi: 10.1523/JNEUROSCI.0257-08.2008. [DOI] [PMC free article] [PubMed] [Google Scholar]