Abstract
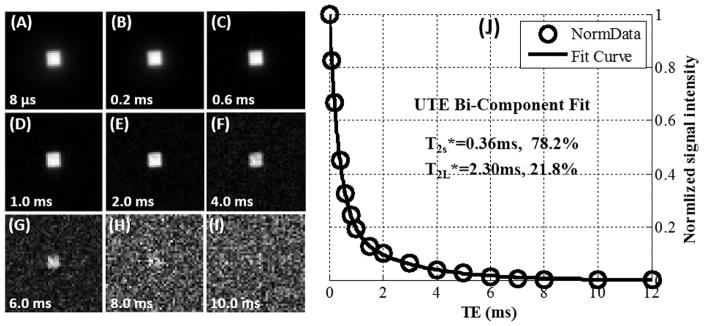
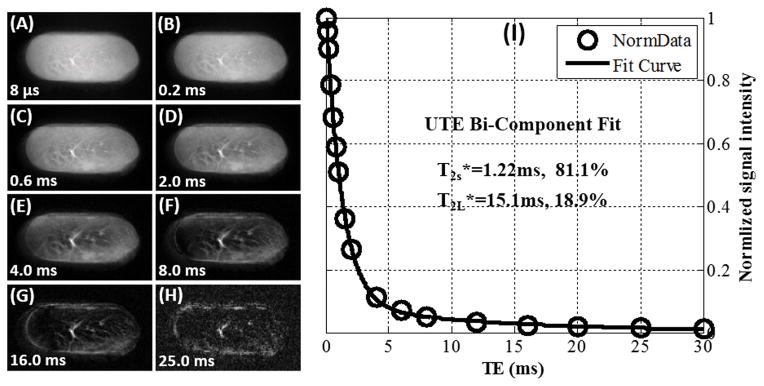
Ultrashort echo time (UTE) sequences can directly obtain signal from short T2, collagen-rich tissues. It is generally accepted that bound and free water can be detected with UTE techniques, but the ability to directly detect protons on the collagen molecule remains controversial. In this study we investigate the potential of UTE sequences on a 3T clinical scanner to detect collagen protons via freeze-drying and D2O-H2O exchange studies. Experiments were performed on bovine cortical bone and human Achilles tendon specimens, which were either subject to freeze-drying for over 66 hours or D2O-H2O exchange for six days. Specimens were imaged using 2D UTE and 3D UTE with Cones trajectory techniques with minimum echo time of 8 μs at 3T. UTE images before treatment showed high signal from all specimens with bi-component T2* behavior. Bovine cortical bone showed a shorter T2* component of 0.36 ms and a longer T2* component of 2.30 ms with respective fractions of 78.2% and 21.8% by volume. Achilles tendon showed a shorter T2* component of 1.22 ms and a longer T2* component of 15.1 ms with respective fractions of 81.1% and 18.9% by volume. Imaging after freeze-drying or D2O-H2O exchange resulted in either absence or near-absence of signal. These results indicate that bound and free water are the sole sources of UTE signal in bovine cortical bone and human Achilles tendon samples on a clinical 3T scanner. Protons on the native collagen molecule are not directly visible when imaged using UTE sequences.
Keywords: UTE, freeze-drying, D2O-H2O exchange, collagen
Graphical Abstract
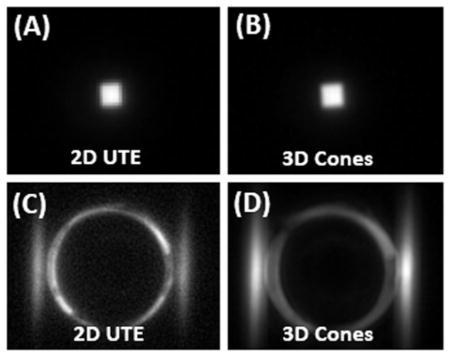
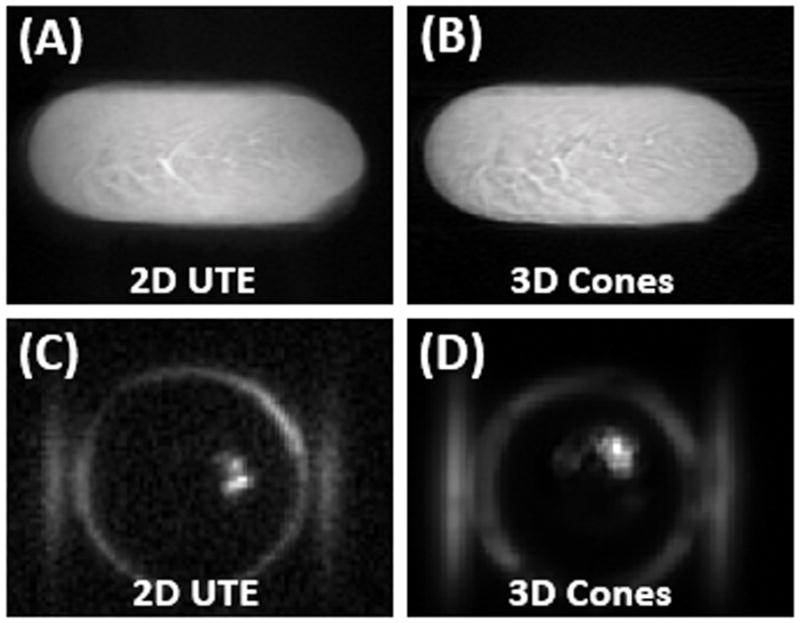
Normal bovine cortical bone sample imaged with 2D UTE (A) and 3D Cones (B) at 3T, as well as 2D UTE(C) and 3D Cones (D) imaging of the same tendon specimen after freeze-drying over 66 hours. Abundant signal is seen before freeze-drying (A and B), but no signal is seen from the specimen after freeze-drying (C and D). The high signal ring in (C) and (D) represent the coil with the “invisible” specimen in the center.
Introduction
Collagen is the most abundant protein in the human body and is the main component of connective tissue [1]. The collagen molecule is composed of a three stranded arrangement of alpha-helices which are stabilized by a ladder of hydrogen bonds, with additional support from stereoelectronic effects and posttranslational modifications, such as hydroxylation and cross-linking [2]. Alterations of collagen structure, amount, and type are of clinical interest in nearly all biologic systems, including musculoskeletal, neurologic, cardiovascular, and respiratory [3–6].
Of the clinically utilized imaging modalities, magnetic resonance (MR) imaging has the potential to provide the most information about collagen. However, the highly anisotropic structure of collagen causes short transverse relaxation times, which result in little, or no signal when imaged using conventional MR sequences. Ultrashort echo time (UTE) sequences, with echo times that range from 0.008 to 0.50 ms, have been increasingly used on clinical MR imaging systems to directly image collagen-rich short T2 tissues or tissue components, such as cortical bone, calcified cartilage, menisci, ligaments and tendons [3, 7, 8].
Although UTE sequences can directly obtain signal from collagen-rich tissues, the precise origin of this signal remains controversial. Potential candidates include (i) protons on the collagen molecule, (ii) collagen-associated water with various amounts of restricted motion (also known as bound water), and (iii) unrestricted water surrounding collagen (also known as free or bulk water). With regard to restricted collagen-associated water, three distinct compartments have been identified, including water bridges (single and double bridges between alpha-helices too distant to allow direct hydrogen bonds), cleft water (residing in the groove-like depressions of the triple helix), and interfacial monolayer (also known as surface or hydration layer) water, in order of increasing mobility and energy [9, 10]. Using nuclear magnetic resonance (NMR) imaging at different levels of hydration, Fullerton and colleagues proposed a mono-exponential decay pattern of all three restricted water compartments due to fast exchange [10]. Using clinical MR scanners, quantitative UTE techniques have been used with bi-component T2* analysis to evaluate collagen-associated bound and free water compartments [11–13].
More recently, a study by Siu et al. suggested that UTE sequences could directly detect signal from protons on the collagen molecule, with a reported mean short T2* of 0.75 ± 0.05 ms and a mean chemical shift of −3.56 ± 0.01 ppm relative to water at 7T [14]. The purpose of our study is to further investigate whether UTE sequences can detect signal from collagen protons via freeze-dry and D2O exchange studies of cortical bone and Achilles tendon specimens at 3T.
Methods and Materials
Sample Preparation
Two bovine cortical bone samples (2×2×6 mm3) and two cadaveric human Achilles tendon samples (1 cm in length) were prepared for this study. The bone samples were sectioned from two fresh femoral midshaft bovine specimens obtained from a local slaughterhouse using a low-speed diamond saw (Isomet 1000, Buehler, Lake Bluff, IL) with constant water irrigation. The two tendon samples were sectioned from two human ankle specimens obtained from our institutional anatomical laboratory using a scalpel. All samples were stored in phosphate buffered saline (PBS) solution for 24 hours prior to use.
Pulse Sequences and Imaging Protocol
All samples were imaged with 2D non-slice selective UTE sequences and 3D UTE with Cones trajectory (3D Cones) sequences on a GE 3T Signa TwinSpeed MR scanner (GE Healthcare Technologies, Milwaukee, MI) which had a maximum gradient strength of 40 mT/m and a maximum slew rate of 150 mT/m/ms. The non-slice selective 2D UTE sequence employed a short rectangular pulse excitation (duration = 32 μs) followed by 2D radial ramp sampling with a minimal nominal TE of 8 μs. The 3D UTE Cones sequence employed a short rectangular pulse (duration = 32 μs) for non-slice selective excitation followed by 3D spiral sampling on the Cones [15]. A home-made 1-inch diameter birdcage T/R coil was used for signal excitation and reception for both 2D and 3D UTE imaging.
For 2D UTE morphological imaging the following parameters were used: a TR of 100 ms, a flip angle of 10°, a bandwidth of 62.5 kHz, a FOV of 4 cm, 403 projections, reconstruction matrix of 128×128 for cortical bone and 256×256 for Achilles tendon. The 3D Cones sequence used similar imaging parameters except a shorter TR of 20 ms, 20 slices, a slice thickness of 4 mm, and reconstruction matrix of 192×192×16 for cortical bone and 256×256×16 for Achilles tendon. Furthermore, T2* was measured with 2D non-selective UTE imaging with seventeen echo times (TEs = 8 μs, 0.1, 0.2, 0.4, 0.6, 0.8, 1, 1.5, 2, 3, 4, 5, 6, 7, 8, 10, 12 ms) for cortical bone and seventeen echo times (TEs = 8 μs, 0.1, 0.2, 0.4, 0.6, 0.8, 1, 1.5, 2, 4, 6, 8, 12, 16, 20, 25, 30 ms) for Achilles tendon. For T2* measurement, image flip angle was low (i.e. 10°) and pulse repetition time (i.e. 100ms) was long enough to eliminate the T1 dependence especially for cortical bone with a short T1 [16, 17]. The total scan time for T2* measurement were 11min25s for both cortical bone and Achilles tendon.
Experimental Procedures
The bovine cortical bone and human Achilles tendon samples were blot-dry and then imaged with the above morphological and quantitative UTE imaging protocols. After the initial 2D and 3D UTE imaging, one bovine bone sample and one human Achilles tendon sample were lyophilized using a Labconco Lyph-Lock 4.5-liter freeze-dry system (model 77510-00, Labconco Corp., Kansas City, MO) for over 66 hours. Weight of each sample was measured before and after freeze-drying using a Mettler-Toledo AL-104 digital balance (Mettler-Toledo, Schwerzenbach, Switzerland) with precision of 0.1 mg. After freeze-drying, each sample was stored in a sealed tube and warmed to room temperature, and then imaged again with the same protocol described above.
The other bovine bone sample and the other human Achilles tendon sample were subject to a D2O-H2O exchange study. Each sample was put in a 20 ml syringe filled with D2O solution for exchange in the refrigerator for six days. Each syringe was flushed with fresh D2O every two days in order to achieve more complete D2O-H2O exchange. Finally, the same UTE MR imaging protocol was applied to the D2O exchanged samples.
Data Analysis
Bi-component model is used for both bound and free water components quantification, which assumes both bound and free water contribute to the UTE signal. The following bi-component analysis model was employed to analyze T2* values of both bound and free water and their relative fractions:
| [1] |
Where a constant term noise was fitted to account for background noise. Sbw and Sfw are the magnetization of the bound and free water components, and T2S* and T2L* are their T2* relaxation times.
The analysis algorithm was written in Matlab (The MathWorks Inc., Natick, MA, USA) and was executed offline on the DICOM images obtained by the protocols described above. The program allowed placement of ROIs on the first UTE image of the series, which was then copied onto each of the subsequent images. The mean intensity within each of the ROIs was used for subsequent curve fitting. The bi-component exponential fitting model shown in Eq.1 was used to fit the UTE T2* images. Noise is estimated automatically using a maximum likelihood estimation algorithm.
Results
Freeze-drying resulted in a significant loss of sample weight. Bone weight reduced from 0.3544 g to 0.1759 g, corresponding to 50% weight loss. The Achilles tendon sample weight was reduced from 1.9640 g to 0.3934 g, corresponding to 80% weight loss. Figure 1 and 2 show UTE images and T2* bi-component analysis of the blot-dry bovine cortical bone sample and human Achilles tendon sample, respectively. High signal intensity and excellent bi-component decay behavior were observed from UTE imaging of both samples before freeze-drying. The image signal-to-noise ratios (SNRs) of cortical bone and Achilles tendon acquired with 2D UTE sequence with TE=8μs were 327 and 193 respectively. The bovine cortical bone sample showed two distinct water components: a shorter T2* of 0.36 ms and a longer T2* of 2.30 ms with respective fractions of 78.2% and 21.8% by volume. The human Achilles tendon sample also showed two distinct water components: a. shorter T2* of 1.22 ms and a longer T2* of 15.1 ms with respective fractions of 81.1% and 18.9% by volume. The fitting quality can be represented by , where Si, Si,fit (i=1,…,N, N is the total number of data points in one multiple-TE datasets) were the experimental and fitted data points. For the bi-component fitting of cortical bone and Achilles tendon, the Residuals were 0.4% and 2.2% respectively. The Residuals of bi-component fitting were very lower, which demonstrated that bi-exponential model describes the observed signal decay well.
Figure 1.
Selected 2D UTE imaging of a bovine cortical bone sample with TEs of 8 μs (A), 0.2 ms (B), 0.6 ms (C), 1.0 ms (D), 2.0 ms (E), 4.0 ms (F), 6.0 ms (G), 8.0 ms (H) and 10.0 ms (I) as well as bi-component (J) fitting of the UTE images which shows a shorter T2* of 0.36 ms and a longer T2* of 2.30 ms with respective fractions of 78.2% and 21.8% by volume. The ROI was located in the cortical bone center with a size of 4×4.
Figure 2.
Selected 2D UTE imaging of a Achilles tendon sample with TEs of 8 μs (A), 0.2 ms (B), 0.6 ms (C), 2.0 ms (D), 4.0 ms (E), 8.0 ms (F), 16.0 ms (G) and 25.0 ms (H) as well as bi-component (I) fitting of the UTE images which shows a shorter T2* of 1.22 ms and a longer T2* of 15.1 ms with respective fractions of 81.1% and 18.9% by volume. The ROI was located in the Achilles tendon center with a size of 8×24.
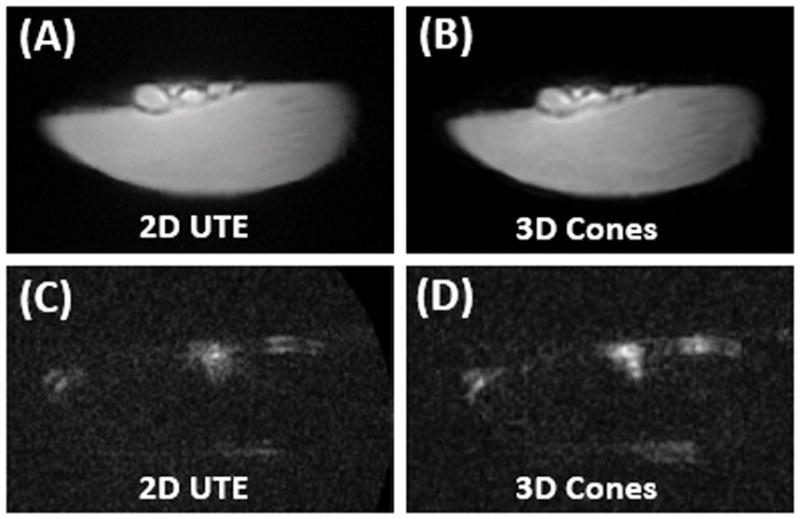
Figures 3 and 4 show 2D UTE and 3D Cones imaging of the bovine cortical bone sample and human Achilles tendon sample before and after freeze-drying, respectively. High signal was observed for both samples before freeze-drying. The fascicular pattern in the blot-dry Achilles tendon was nicely depicted. However, after freeze-drying, near zero signal was observed for bovine cortical bone, and only a few bright spots near the central region of the Achilles tendon sample were observed. The bright spots are likely from residual water surviving the freeze-drying of 66 hours. Longer freeze-drying may be necessary to remove all detectable water in the Achilles tendon sample. These results suggest that freeze-drying removes the source of the MR signal, namely both bound water and free water. Collagen protons are expected to survive the freeze-drying process and, when imaged using 2D and 3D UTE sequences, show zero signal. Therefore, collagen protons in cortical bone and the Achilles tendon are “invisible” with UTE sequences on clinical MR scanners.
Figure 3.
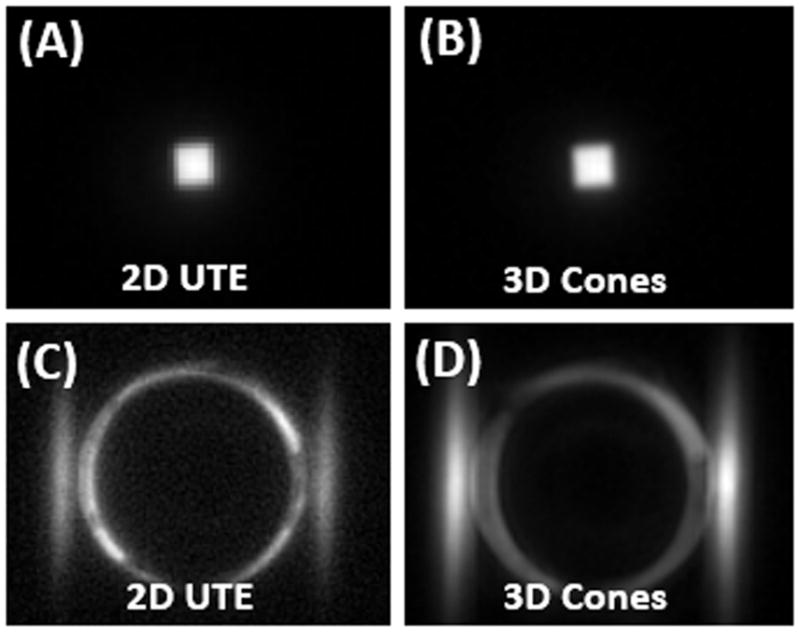
Normal bovine cortical bone sample imaged with 2D UTE (A) and 3D Cones (B) at 3T, as well as 2D UTE(C) and 3D Cones (D) imaging of the same tendon specimen after freeze-drying over 66 hours. Abundant signal is seen before freeze-drying (A and B), but no signal is seen from the specimen after freeze-drying (C and D). The high signal ring in (C) and (D) represent the coil with the “invisible” specimen in the center.
Figure 4.
Normal Achilles tendon imaged with 2D UTE (A) and 3D Cones (B) at 3T, as well as 2D UTE(C) and 3D Cones (D) imaging of the same tendon specimen after freeze-drying over 66 hours. The normal tendon is visible before freeze-drying (A and B), but only a small focus of signal is present after freeze-drying (C and D), consistent with residual water which survived the lyophilization process.
Figure 5 shows 2D UTE and 3D Cones images of the other Achilles tendon sample before and after D2O exchange. High signal was observed before D2O exchange, but the signal dropped to near zero, which also confirm that the focus of signal in the tendon images after freeze-drying were generated from the residual water which survived the lyophilization process. Similar results were observed for cortical bone (not shown)with high signal when imaged with 2D UTE and 3D Cones before D2O exchange, but near zero signal after D2O exchange.
Figure 5.
Normal Achilles tendon imaged with 2D UTE (A) and 3D Cones (B) at 3T, as well as 2D UTE(C) and 3D Cones (D) imaging of the same tendon specimen after D2O exchange for one week. The normal tendon is visible before D2O exchange (A and B), but invisible after D2O exchange (C and D).
From the results, the water protons can be effectively removed from the cortical bone and Achilles tendon by both freeze-drying and D2O-H2O exchange. The cortical bone showed an absence of signal after both freeze-drying and D2O-H2O exchange. Though there existed a small focus of signal intensity in the center region of the Achilles tendon after freeze-drying, the D2O exchange experiment also confirms that this focus of signal in the tendon images were generated from the residual water after freeze-dry.
Discussion
Short T2 structures that were previously invisible when imaged with conventional MR sequences, including bone and tendon, can now be visualized using UTE techniques. However, an understanding of the source of signal is important for image interpretation, particularly in the setting of in vivo translation where MR imaging may be a surrogate for more invasive techniques. In our study, we have shown that bound and free water are the sources of UTE signal in bovine cortical bone and human Achilles tendon samples on a clinical 3T scanner. Specifically, the absence of signal in both bone and tendon samples after freeze-drying indicates that protons on the native collagen molecule are not directly visible using UTE sequences.
Our results contrast with those recently published by Siu et al, who suggested that collagen protons could be detected and quantified using UTE sequences at 7T [14]. However, a number of differences between our studies exist. Siu et al performed their experiments on a hydrolyzed collagen solution, which causes cleavage of the molecule into smaller peptides. This results in an amorphous state of collagen, lacking either partially or completely the tertiary, secondary, and primary structure of native collagen [18]. The destruction of the highly ordered, three-dimensional structure of collagen would be expected to alter the T2* values of the collagen protons. Presumably the collagen proton T2* values would increase and this could result in their detection using UTE sequences, in a similar manner to macromolecular protons on myelin which may be detectable using UTE techniques [19, 20]. The effect of this on the stability and accuracy of bi-component fitting, which requires sufficient separation of the two-modeled pools, is unclear [21, 22]. Additionally, at higher field strengths, such as 7T, oscillations in signal resulting from non-water off-resonance spins further degrade bi-exponential fitting [23].
Direct detection of collagen protons is possible using spectroscopic techniques at high field strengths. This has been shown by Siu et al at [14] and Kaflak-Hachulska et al [23], on collagen solutions at 7T and on powdered collagen at 19.6T, respectively. Although short T2* values broaden the measured spectral linewidths, the liquid solution used by Siu et al [14] and the magic-angle spinning technique used by Kaflak-Hachulska et al [23] allowed for narrower linewidths. However, these spectroscopic techniques are not compatible with in vivo imaging. Fortunately, collagen protons can be indirectly detected via UTE magnetization transfer (UTE-MT) imaging [24, 25]. Modeling of UTE-MT images acquired with a series of MT frequency offsets and power may provide quantitative assessment of protons in free water, bound water and collagen in short T2 tissues such as cortical bone and the Achilles tendon. The precise relationship between these three proton pools in the native in vivo condition and with regards to healthy versus pathologic tissue remains to be elucidated. UTE-MT imaging combined with bi-component analysis would provide information from all three pools and will be the focus of future work. The answer of which proton pool is most sensitive and discriminative of pathologic change would be of great clinical significance. Along the lines of clinical translation, our study utilized the 3D UTE Cones sequence with correction of linear eddy current components rather than the 3D radial UTE sequence. Though the 3D radial UTE sequence may be more immune to hardware imperfections with a shorter readout window with a linear acquisition trajectory, the 3D UTE Cones sequence demonstrates higher scan time efficiency with a spiral acquisition trajectory. The 3D Cones sequence also allows anisotropic spatial coverage and resolution (higher in-plane resolution, thicker slice) to reduce the total scan time, which is more flexible to get higher SNR and less scan time [26].
Our study has several limitations. First, freeze-drying is an elegant way to remove water while largely preserving structure, but does not result in a completely anhydrous state. Previous studies using collagen-rich tissues have shown residual water measuring less than 3% [27]. This is confirmed by the central hyperintensities present in the Achilles tendon sample after lyophilization. However, this may be considered the most economic method achievable while largely maintaining structure. Second, freeze-drying results in some minor degree of protein denaturation. The process of drying removes water bridges which play a role in stabilization [28]. However the expected change in structure is likely small [2] and we would not expect large changes in collagen protons T2* values. Third, D2O exchange for six days, even in the refrigerator, may lead to significant tissue degradation. Fourth, since a large amount of collagen protons are not exchangeable with D2O (e.g., -CH2-, -CH3), the absence of any signal after D2O exchange likely remains a valid indicator that collagen protons are not directly visible with UTE sequences on clinical MR scanners. Fifth, both freeze-dry and D2O exchange may change the mobility of the collagen molecule since it interacts closely with surrounding water, in which case the two treatments themselves may alter the T2* of the proton signal specifically associated with the collagen. Future high field spectroscopic studies are needed to be performed on the samples before and after freeze-drying and D2O flushing to show that whether the collagen signals observable under those conditions are unaffected. Sixth, all samples in this study were maintained in room temperature during scanning. Although it is likely that quantitative relaxation measurements would be affected by differences between room and body temperature, we do not anticipate that the main results of our study which show that protons on the native collagen molecule are invisible with UTE sequences would be significantly affected. Finally, it would be of interest to investigate whether some other imaging techniques such as zero echo-time (ZTE) imaging or sweep imaging with Fourier transformation (SWIFT) imaging could conceivably be able to detect the signals of collagen protons directly (29,30).
In conclusion, we have demonstrated that bound and free water, but not collagen protons, are the sources of signal in cortical bone and Achilles tendon samples when imaged with UTE sequences on a clinical 3T MR scanner.
Acknowledgments
The authors acknowledge grant support from NIH (1R01 AR062581 and 1R01 AR068987) and the VA Clinical Science R&D Service (5IK2CX000749).
Abbreviations used
- MR
magnetic resonance
- UTE
Ultrashort echo time
- NMR
nuclear magnetic resonance
- PBS
phosphate buffered saline
- UTE-MT
UTE magnetization transfer
References
- 1.Di Lullo GA, Sweeney SM, Korkko J, Ala-Kokko L, San Antonio JD. Mapping the ligand-binding sites and disease-associated mutations on the most abundant protein in the human, type I collagen. Journal of Biological Chemistry. 2002;277:4223–4231. doi: 10.1074/jbc.M110709200. [DOI] [PubMed] [Google Scholar]
- 2.Shoulders MD, Raines RT. Collagen structure and stability. Annu Rev Biochem. 2009;78:929–58. doi: 10.1146/annurev.biochem.77.032207.120833. [DOI] [PMC free article] [PubMed] [Google Scholar]
- 3.Robson MD, Gatehouse PD, Bydder M, Bydder GM. Magnetic resonance: an introduction to ultrashort TE (UTE) imaging. J Comput Assist Tomogr. 2003;27:825–46. doi: 10.1097/00004728-200311000-00001. [DOI] [PubMed] [Google Scholar]
- 4.Chang EY, Du J, Chung CB. UTE imaging in the musculoskeletal system. J Magn Reson Imaging. 2015;41:870–83. doi: 10.1002/jmri.24713. [DOI] [PMC free article] [PubMed] [Google Scholar]
- 5.de Jong S, Zwanenburg JJ, Visser F, van der Nagel R, van Rijen HV, Vos MA, de Bakker JM, Luijten PR. Direct detection of myocardial fibrosis by MRI. Journal of Molecular and Cellular Cardiology. 2011;51:974–979. doi: 10.1016/j.yjmcc.2011.08.024. [DOI] [PubMed] [Google Scholar]
- 6.Takahashi M, Togao O, Obara M, van Cauteren M, Ohno Y, Doi S, Kuro-o M, Malloy C, Hsia CC, Dimitrov I. Ultra-short Echo Time (UTE) MR Imaging of the Lung: Comparison Between Normal and Emphysematous Lungs in Mutant Mice. Journal of Magnetic Resonance Imaging. 2010;32:326–333. doi: 10.1002/jmri.22267. [DOI] [PMC free article] [PubMed] [Google Scholar]
- 7.Larson PE, Conolly SM, Pauly JM, Nishimura DG. Using adiabatic inversion pulses for long-T2 suppression in ultrashort echo time (UTE) imaging. Magn Reson Med. 2007;58:952–61. doi: 10.1002/mrm.21341. [DOI] [PMC free article] [PubMed] [Google Scholar]
- 8.Techawiboonwong A, Song HK, Wehrli FW. In vivo MRI of submillisecond T(2) species with two-dimensional and three-dimensional radial sequences and applications to the measurement of cortical bone water. NMR Biomed. 2008;21:59–70. doi: 10.1002/nbm.1179. [DOI] [PubMed] [Google Scholar]
- 9.Fullerton GD, Amurao MR. Evidence that collagen and tendon have monolayer water coverage in the native state. Cell Biology International. 2006;30:56–65. doi: 10.1016/j.cellbi.2005.09.008. [DOI] [PubMed] [Google Scholar]
- 10.Fullerton GD, Nes E, Amurao M, Rahal A, Krasnosselskaia L, Cameron I. An NMR method to characterize multiple water compartments on mammalian collagen. Cell Biology International. 2006;30:66–73. doi: 10.1016/j.cellbi.2005.09.009. [DOI] [PubMed] [Google Scholar]
- 11.Biswas R, Bae W, Diaz E, Masuda K, Chung CB, Bydder GM, Du J. Ultrashort echo time (UTE) imaging with bi-component analysis: bound and free water evaluation of bovine cortical bone subject to sequential drying. Bone. 2012;50:749–55. doi: 10.1016/j.bone.2011.11.029. [DOI] [PMC free article] [PubMed] [Google Scholar]
- 12.Du J, Diaz E, Carl M, Bae W, Chung CB, Bydder GM. Ultrashort echo time imaging with bicomponent analysis. Magn Reson Med. 2012;67:645–9. doi: 10.1002/mrm.23047. [DOI] [PubMed] [Google Scholar]
- 13.Qian Y, Williams AA, Chu CR, Boada FE. Multicomponent T2* mapping of knee cartilage: technical feasibility ex vivo. Magn Reson Med. 2010;64:1426–31. doi: 10.1002/mrm.22450. [DOI] [PMC free article] [PubMed] [Google Scholar]
- 14.Siu AG, Ramadeen A, Hu XD, Morikawa L, Zhang L, Lau JYC, Liu G, Pop M, Connelly KA, Dorian P, Wright GA. Characterization of the ultrashort-TE (UTE) MR collagen signal. Nmr in Biomedicine. 2015;28:1236–1244. doi: 10.1002/nbm.3372. [DOI] [PubMed] [Google Scholar]
- 15.Gurney PT, Hargreaves BA, Nishimura DG. Design and analysis of a practical 3D cones trajectory. Magn Reson Med. 2006;55:575–582. doi: 10.1002/mrm.20796. [DOI] [PubMed] [Google Scholar]
- 16.Horch R, Gochberg D, Nyman J, Does M. Clinically-compatible MRI strategies for discriminating bound and pore water in cortical bone. Magn Reson Med. 2012;68:1774–1784. doi: 10.1002/mrm.24186. [DOI] [PMC free article] [PubMed] [Google Scholar]
- 17.Chen J, Grogan SP, Shao H, D’Lima D, Bydder GM, Wu Z, Du J. Evaluation of bound and pore water in cortical bone using ultrashort-TE MRI. NMR Biomed. 2015;28:1754–1762. doi: 10.1002/nbm.3436. [DOI] [PMC free article] [PubMed] [Google Scholar]
- 18.Aliev AE. Solid-state NMR studies of collagen-based parchments and gelatin. Biopolymers. 2005;77:230–45. doi: 10.1002/bip.20217. [DOI] [PubMed] [Google Scholar]
- 19.Wilhelm MJ, Ong HH, Wehrli SL, Li C, Tsai PH, Hackney DB, Wehrli FW. Direct magnetic resonance detection of myelin and prospects for quantitative imaging of myelin density. Proc Natl Acad Sci U S A. 2012;109:9605–10. doi: 10.1073/pnas.1115107109. [DOI] [PMC free article] [PubMed] [Google Scholar]
- 20.Du J, Ma G, Li S, Carl M, Szeverenyi NM, VandenBerg S, Corey-Bloom J, Bydder GM. Ultrashort echo time (UTE) magnetic resonance imaging of the short T2 components in white matter of the brain using a clinical 3T scanner. Neuroimage. 2014;87:32–41. doi: 10.1016/j.neuroimage.2013.10.053. [DOI] [PMC free article] [PubMed] [Google Scholar]
- 21.Wang N, Xia Y. Anisotropic analysis of multi-component T2 and T1rho relaxations in achilles tendon by NMR spectroscopy and microscopic MRI. J Magn Reson Imaging. 2013;38:625–33. doi: 10.1002/jmri.24012. [DOI] [PMC free article] [PubMed] [Google Scholar]
- 22.Seifert AC, Wehrli SL, Wehrli FW. Bi-component T2 * analysis of bound and pore bone water fractions fails at high field strengths. NMR Biomed. 2015;28:861–72. doi: 10.1002/nbm.3305. [DOI] [PMC free article] [PubMed] [Google Scholar]
- 23.Kaflak-Hachulska A, Samoson A, Kolodziejski W. H-1 MAS and H-1 -> P-31 CP/MAS NMR study of human bone mineral. Calcified Tissue International. 2003;73:476–486. doi: 10.1007/s00223-002-2111-5. [DOI] [PubMed] [Google Scholar]
- 24.Hodgson RJ, Evans R, Wright P, Grainger AJ, O’Connor PJ, Helliwell P, McGonagle D, Emery P, Robson MD. Quantitative magnetization transfer ultrashort echo time imaging of the Achilles tendon. Magn Reson Med. 2011;65:1372–6. doi: 10.1002/mrm.22715. [DOI] [PubMed] [Google Scholar]
- 25.Chang EY, Bae WC, Shao H, Biswas R, Li S, Chen J, Patil S, Healey R, D’Lima DD, Chung CB, Du J. Ultrashort echo time magnetization transfer (UTE-MT) imaging of cortical bone. NMR Biomed. 2015;28:873–80. doi: 10.1002/nbm.3316. [DOI] [PMC free article] [PubMed] [Google Scholar]
- 26.Carl M, Bydder GM, Du J. UTE imaging with simultaneous water and fat signal suppression using a time - efficient multispoke inversion recovery pulse sequence. Magn Reson Med. 2015 doi: 10.1002/mrm.25823. [DOI] [PMC free article] [PubMed] [Google Scholar]
- 27.Flynn J, Rudert MJ, Olson E, Baratz M, Hanley E. The effects of freezing or freeze-drying on the biomechanical properties of the canine intervertebral disc. Spine (Phila Pa 1976) 1990;15:567–70. doi: 10.1097/00007632-199006000-00025. [DOI] [PubMed] [Google Scholar]
- 28.Roy I, Gupta MN. Freeze-drying of proteins: some emerging concerns. Biotechnol Appl Biochem. 2004;39:165–77. doi: 10.1042/BA20030133. [DOI] [PubMed] [Google Scholar]
- 29.Weiger M, Pruessmann KP, Bracher AK, Kohler S, Lehmann V, Wolfram U, Hennel F, Rasche V. High-resolution ZTE imaging of human teeth. NMR Biomed. 2012;25:1144–1151. doi: 10.1002/nbm.2783. [DOI] [PubMed] [Google Scholar]
- 30.Idiyatullin D, Corum C, Park JY, Garwood M. Fast and quiet MRI using a swept radiofrequency. Journal of Magnetic Resonance. 2006;181(2):342–349. doi: 10.1016/j.jmr.2006.05.014. [DOI] [PubMed] [Google Scholar]


