

Abstract
Fast-scan cyclic voltammetry (FSCV) using carbon fiber electrodes is widely used to rapidly monitor changes in dopamine (DA) levels in vitro and in vivo. Current analytical approaches utilize parameters such as peak oxidation current amplitude and decay times to estimate release and uptake processes, respectively. However, peak amplitude changes are often observed with uptake inhibitors, thereby confounding the interpretation of these parameters. To overcome this limitation, we demonstrate that a simple, 5 parameter, two compartment model mathematically describes DA signals as a balance of release (r/ke) and uptake (ku), summed with adsorption (kads and kdes) of DA to the carbon electrode surface. Using non-linear regression, we demonstrate that our model precisely describes measured DA signals obtained in brain slice recordings. The parameters extracted from these curves were then validated using pharmacological manipulations that selectively alter vesicular release or DA transporter (DAT)-mediated uptake. Manipulation of DA release through altered Ca2+/Mg2+ ratio or tetrodotoxin (TTX), reduced the release parameter with no effect on the uptake parameter. The DAT inhibitors methylenedioxypyrovalerone (MDPV), cocaine, and nomifensine significantly reduced uptake and increased vesicular DA release. In contrast, a low concentration of amphetamine reduced uptake but had no effect on DA release. Finally, the kappa-opioid receptor (KOR) agonist U50,488 significantly reduced vesicular DA release but had no effect on uptake. Together, these data demonstrate a novel analytical approach to distinguish the effects of manipulations on DA release or uptake that can be used to interpret FSCV data.
Keywords: voltammetry, kinetics, dopamine transporter, drug abuse, cathinones, brain slice
Introduction
Fast-scan cyclic voltammetry (FSCV) using carbon fiber electrodes has long been used to monitor dopamine (DA) levels, both in vitro and in vivo. Since sampling intervals of < 10 ms are feasible using this technique 1, 2, the dynamics of both DA release and uptake can be quantified. Mathematical solutions incorporating Michaelis-Menten kinetics have been used to quantify DA signals3-6, although this requires untested assumptions regarding mechanisms of drug actions and specialized curve fitting algorithms. A simpler description of currents arising from DA oxidation involves measuring parameters such as peak amplitude and decay time7. The peak amplitude of the oxidation current measured at the carbon fiber electrode has historically been used as an index of the amount of DA released, whereas the decay of this signal is used to assess DA transporter (DAT)-mediated uptake. However, a confounding of these variables is likely because DAT inhibitors, which should alter only DA uptake, also typically increase the peak signal amplitude4, 8, 9. Moreover, the typical estimation of uptake is performed using a single exponential decay time constant (tau, τ), but this is often confounded by the fact that DA currents do not fully decay back to pre-stimulus baselines, an artifact that likely reflects trapping of DA at the electrode surface due to adsorption10-12. For these reasons, a simple model that unequivocally resolves release and uptake components of FSCV signals would aid in measuring the effects of behavioral and pharmacological manipulations on DA dynamics. In the present study, we have adapted and simplified the ‘restricted diffusion’-based model recently proposed by Walters et al.11, 12 and demonstrate its application to the measurement of DA release and uptake in brain slices, where experimental conditions permit resolution of release and uptake components. Our model can be implemented with a variety of software packages that perform non-linear curve fitting analysis, making it accessible to a number of laboratories that perform FSCV.
Results and Discussion
The rapid sampling frequency of FSCV recording should, in principle, allow for resolution of DA release and DA uptake. Most prior studies have relied on measurement of the peak amplitude of the DA signal as an indicator of release, and utilized the time course of the falling phase of the DA signal as a quantitative measure of uptake. These assumptions present problems, however, since uptake clearly influences the peak height of the signal (present study and 4, 13). This likely reflects the fact that uptake is ongoing, and occurs more rapidly than DA is detected at the electrode using FSCV (50-100ms). For this reason, it is preferable to have a parameter that cleanly distinguishes release from uptake processes. Here we describe a model of FSCV signals that unambiguously distinguishes vesicular DA release from uptake. Adapting a restricted diffusion model developed by Walters et al.11, 12, we demonstrate that a simple, 5 parameter scheme (r, ke, ku, kads, and kdes) is sufficient to adequately describe current versus time waveforms obtained in striatal brain slices. Using pharmacological approaches in brain slices, we validate the quantitative application of this model using both known release modulators (Ca2+, TTX) and uptake inhibitors (MDPV, cocaine, nomifensine, and amphetamine). In addition, we utilize this model to demonstrate that KOR activation inhibits DA release but does not affect DA uptake, consistent with previous FSCV studies14, 15.
Model
Our objective was to develop a model that describes the DA oxidation current vs. time profile in a way that (1) distinguishes release from uptake processes; (2) accounts for the failure of the signals to decay back to pre-stimulus baseline (“tails”); and (3) utilizes the fewest number of parameters, so that each can be unambiguously determined by minimizing least squares fits to the datasets. As shown in Figure 1, a simplified, 5 parameter model was chosen, based on simultaneous equations incorporating DA release and uptake and adsorption of DA to the electrode (see Methods). The parameters, which are described further below, are r, ke, ku, kads and kdes. In order to describe the balance between DA release and uptake, we have adopted and modified the restricted diffusion model described by Walters.11, 12 This model, based on previous work by Nicholson and colleagues16, 17 employs two kinetic compartments, an ‘inner compartment’ into which DA is initially released, followed by an ‘outer compartment’ in which DA is detected by the carbon fiber electrode. In this kinetic scheme, Walters et al. utilize the term kr to modify ongoing DA release into the inner compartment, and the term kT to account for the transfer of DA to the outer compartment11. However, in the case of single pulse release the kr term does not apply and can be eliminated. Therefore the kinetic terms used by these investigators (kr and kT of Walters et al.11, 12) were eliminated from the model and replaced with an equivalent kinetic model (see Supplementary Information). The remaining, simplified kinetic scheme can be summarized as follows:
Figure 1. DA release and uptake modeled with 5 parameters.
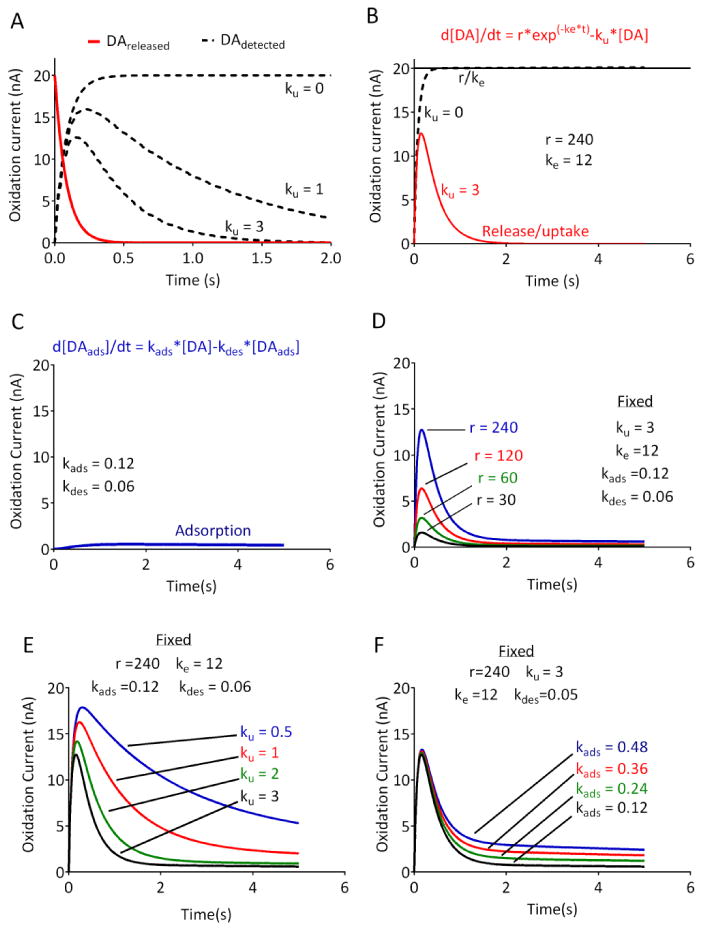
(A) The kinetic scheme underlying the model. Red line indicates the DA released into the tissue, and dashed lines indicate the DA detected at the carbon fiber electrode. As described in the text, the transfer of DA from the inner compartment is mirrored by its appearance in the outer compartment. In the absence of any uptake (ku = 0), the asymptotic portion of the curve for DA detection will reflect the initial DA released at time 0. Increasing uptake will reduce the peak amplitude of the signal, and force the signal away from the asymptote. (B) The mathematical representation of the kinetic model (see Methods). Solid line shows the release term r/ke, which represents the maximal release in the absence of any uptake (e.g., ku = 0, dashed line). Note the difference between r/ke and the peak amplitude of the signal when uptake is present (red trace). (C) The equation modeling DA adsorption to the electrode. (D-F) Simulated DA current vs. time profile, which reflects the sum of the curves using the parameters and equations from (B) and (C). Curves were modeled by using fixed parameters as indicated and varying r, ku, or kads, respectively. Note the distinct changes in the shapes of the curves produced by the changes in each parameter. Parameters were chosen based on typical values obtained in brain slices.
Where ke represents the rate constant for transfer of the DA from the inner compartment to the carbon fiber electrode (replacing both the kr and the KT parameters of Walters et al.11,12), and ku represents a first order uptake rate constant. We choose the term ke in order to make it clear that this governs the overall rate of transfer of DA to the electrode, and thus includes DA diffusion to the carbon fiber. The contribution of diffusion is indicated by the delay in the time following stimulation for the signal to reach its peak amplitude, a process referred to as ‘overshoot’ by Walters et al.12 Indeed, as shown in Figure 2, although DA is initially detected within the first time point sampled following a single, 1 ms electrical pulse, the peak signal detected at the electrode occurs after ∼150-200ms. This kinetic model can be formally described by the following system of coupled differential equations:
Figure 2. Fitting of the model to DA signals obtained in rat brain slices.
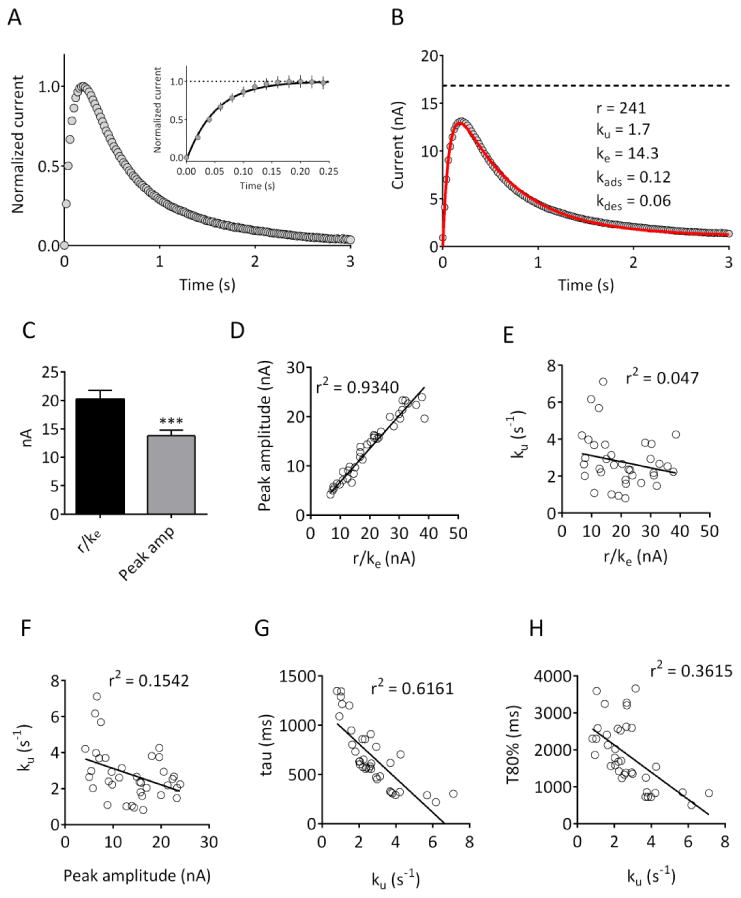
(A) Averaged current responses obtained in 37 brain slices obtained from 10 rats. Peak current was normalized for each slice. In this and subsequent figures, data are aligned so that time 0 corresponds to delivery of a single, 1 ms duration constant current pulse. The inset plot shows the initial rising phase of the current on an expanded time scale. Note that the increase in current was seen in the first data point sampled following stimulation (20 ms), and reached a plateau within 150-200 ms. (B) Raw data, from the same slices, fitted (solid red line) using the model described in the text. The parameters obtained are indicated; the dashed line represents r/ke. (C) Comparison of r/ke with peak amplitude values obtained in the same slices demonstrates that peak amplitude values are significantly lower than r/ke (n = 37; p <0.001, two-tailed paired t-test). (D)-(E) r/ke is strongly correlated with peak amplitude (p<0.0001) but is not correlated with the uptake parameter ku (p =0.1983). (F) Peak amplitude is significantly correlated with ku (p = 0.02). (G)-(H) Correlation of the uptake parameter ku with the decay time constant (tau; p <0.0001) and 80% decay time (T80%; p<0.0001) of the obtained signals.
A plot of these two equations (Figure 1A) demonstrates that, in the absence of any uptake mechanism (e.g. ku = 0), the DA detected at the electrode will eventually reach an asymptotic level that will equal [DA]release at time 0. In terms of the Walters model, following its release, DA is transferred from the inner compartment to the outer compartment, and this reaction proceeds until its completion. As explained by Walters et al.11, 12, it is assumed that the scheme proceeds in the forward direction (e.g. that DA does not transport back to the site of release). In this kinetic scheme, the addition of an uptake term (ku) will cause a removal of DA from the [DA]detected compartment, thereby preventing the detected DA from reaching the asymptotic level. As shown in Figure 1, the degree of uptake will clearly influence the observed peak amplitude of the signal. Notably, as the uptake term is increased, the signal will “bend away” sharply from the asymptotic curve, and the amplitude (peak height) of the signal will vary depending on the uptake parameter. In essence, this means that the peak amplitude of the signal will always underestimate the maximum (released) DA. A mathematical formulation of the restricted diffusion model was then derived (see Methods, Equation 1), and is shown in Figure 1B. Inspection of the current versus time plot clearly demonstrates that the DA detected at the electrode will rise to a maximum value of r/ke in the absence of any uptake (dashed line in Figure 1B). Regardless of the underlying values of r and ke, this projected maximum is mathematically equivalent to the initial DA present in the inner compartment. Since the DA in the inner compartment arises directly from DA released from axon terminals,11, 12 solving for this initial DA condition will also solve for the initial DA release, according to the model described above (also see Methods). In the present study, this term is always expressed in nA, but can readily be converted to μM concentration based on post-electrode calibrations. The clearance of DA by diffusion and transporter-mediated uptake, are approximated as first order processes whose rate constants are summed in the parameter ku (in units of s-1). Although a Michaelis-Menten term for DAT-mediated uptake3, 5 would in principle allow for resolution of uptake and diffusion, we found that the addition of even one more parameter increases the interdependency among the parameters to such an extent that their values can no longer be uniquely determined. In addition, elimination of Michaelis-Menten parameters (Km and Vmax) allows for fitting of the raw current vs. time data, minimizing the need for calibration factors that may vary with recording conditions.18, 19 The Walters model also accounts for the tails in the current-time curves that are due to DA adsorption (termed “hang-up” by these investigators11) using a separate analysis of the tail portion of the curves. Since we also observed these tails, we developed a mathematical solution to account for DA adsorption (Figure 1C) and incorporated this into a model in which all the parameters (r, ke, ku, kads and kdes) are evaluated by a single pass, least-squares fit. Simulations using this model, using parameters similar to those found under control conditions in brain slices, indicated that changes in release or uptake should be reflected in the shape of the curves (Figure 1D-F), making them suitable for fitting to datasets obtained in vitro. It is important to note that changes in the uptake parameter, ku, clearly affect the peak height of the simulated responses (Fig 1E), confirming that peak amplitudes alone do not adequately describe release.
Comparison of modeled parameters with conventional parameters
In order to compare our modeled parameters with typical measures obtained using FSCV, we obtained a large number of signals from slices containing the dorsal striatum under control conditions (n = 37 slices from 10 rats). A different recording electrode was used in each subject; within each slice, 3 responses to a 150uA, 1 ms single pulse stimulation were averaged. The mean signal from all recordings is shown in Figure 2B, along with the best fit parameters. For each response, we compared the parameters obtained from the model with other parameters commonly used to measure release and uptake. As shown in Figure 2C, the r/ke value was significantly greater than the measured peak amplitude value (t=10.56 df=36, p<0.001, paired t-test), consistent with the hypothesis that the amplitude underestimates the initial DA released at time 0. There was a strong correlation between r/ke and peak amplitude (Pearson's r2 = 0.934, p<0.0001; Figure 2D), as would be expected if both parameters are closely related to the release process. In contrast, r/ke and u were not significantly correlated (r2 = 0.047, p = 0.1983; Figure 2E), whereas peak amplitude and ku demonstrated a small but significant correlation (r2 = 0.1542, p = 0.02; Figure 2F). In addition, ku was significantly correlated with both the decay time constant (tau; r2 = 0.6161, p < 0.0001; Figure 2G) and 80% decay time (T80%; r2 = 0.3615, p < 0.0001; Figure 2H) parameters commonly used to evaluate uptake.7 These data suggest that r/ke and ku are independent measures of the release and uptake processes, respectively, whereas peak amplitude reflects a combination of both release and uptake.
Validation of the release parameter, r/ke
If r/ke uniquely reflects DA release, then this parameter should be sensitive to manipulations that selectively affect neurotransmitter release. Therefore, we used physiological and pharmacological manipulations to selectively modify release. First, we examined the relationship between stimulus intensity and r/ke by constructing input-output curves (Figure 3A). Consistent with higher stimulation intensity recruiting more available terminals for release, the r/ke parameter showed a significant, stimulus intensity-dependent increase across all slices tested (n = 12, Figure 3B; one way RM-ANOVA, F(11,4) = 21.17, p <0.001). In contrast, the uptake parameter ku did not significantly differ across the stimulus intensity range (Figure 3C; one way RM-ANOVA, F(11,4) = 0.735, p = 0.574). As a second physiological approach, we varied the number of stimulus pulses delivered at 60Hz, and compared this to release elicited by a single pulse. As shown in Figure 3D, increasing the number of pulses resulted in an enhanced DA signal. Across all slices tested, there was a significant effect of the number of stimulus pulses on r/ke (n = 4; Figure 3E; one way RM-ANOVA, F(3,3) = 15.33, p <0.001), with no effect on the uptake parameter (Figure 3F; one way RM-ANOVA, F(3,3) = 0.381, p =0.770). Together, these results suggest that physiological manipulations designed to increase DA release produce the expected effect on the release parameter, with no effect on uptake.
Figure 3. Effect of varying stimulation intensity and number of stimulus pulses on release and uptake parameters.
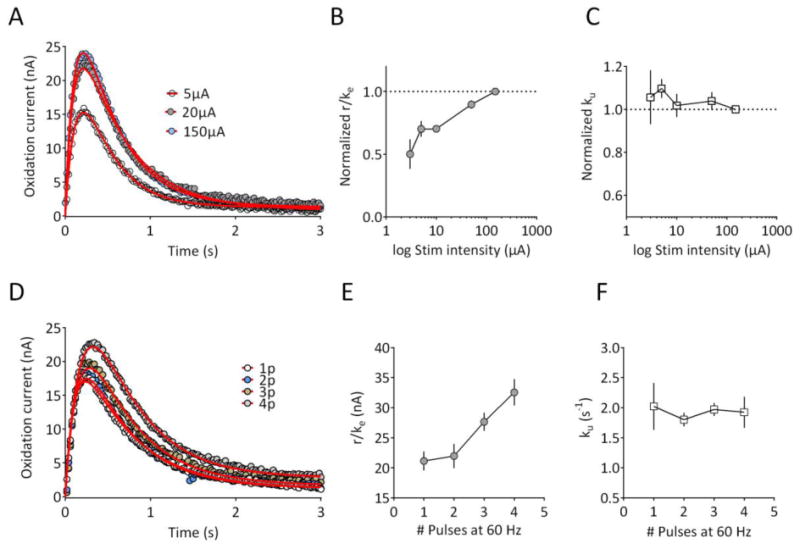
(A) Recording from a striatal slice using single pulse stimulation (1 ms) delivered at 5, 20, and 150μA. Data represent the mean of 3 signals obtained under each condition, and are plotted with circles. The fitted curves from which parameters were extracted are shown with the solid red line. (B) Normalized release parameter (r/ke) as a function of stimulus intensity for all slices (n = 12 from 3 rats). Data are normalized to the response obtained at 150μA. A repeated-measures, one way ANOVA revealed a significant effect of stimulus intensity (F(11,4) = 21.17, p <0.001). (C) Normalized uptake parameter (ku) obtained in the same set of slices. No significant effect of stimulus intensity was observed (F(11,4) = 0.735, p = 0.574). (D) Recording from a striatal slice using either a single, 150μA pulse, 2 pulse, 3 pulse, or 4 pulses delivered at 60 Hz. Data represent the mean of 3 signals obtained under each condition, and are plotted with circles. The fitted curves from which parameters were extracted are shown with the solid red line. (E) Mean release parameter (r/ke) plotted as function of the number of pulses (n = 4 slices, 2 rats). A repeated-measures, one way ANOVA revealed a significant effect of pulse number (F(3,3) = 15.33, p <0.001) on the release parameter. (F) Mean uptake parameter in the same group of slices. No significant effect of pulse number on the uptake parameter was observed (F(3,3) = 0.381, p =0.770). Parameter values for the fitted curves are provided in Supplementary Information.
Through their critical roles in the neurotransmitter release process the effects of altered calcium20-22 and magnesium23 ion concentrations are well-understood. Therefore, we determined the effects of altered Ca2+ /Mg2+ ratios in our model's release parameters. As shown in Figure 4, lowering the Ca2+/Mg2+ ratio significantly reduced the r/ke value (Figure 4A,4B; n = 5; one way RM-ANOVA, F (3, 12) = 83.24, p < 0.0001, but had no significant effect on the uptake parameter, ku (Figure 4C; one way RM-ANOVA, F (3, 12) = 1.903, p = 0.1830). As a final pharmacological approach to validate the release parameter, we evaluated the effects of the voltage-dependent sodium channel blocker tetrodotoxin (TTX). As shown in Figure 4D, low concentrations of TTX (10 nM and 30 nM), reduced the evoked DA responses. Data extracted from the fitted curves indicated that this reduction was due to a significant decrease in the release parameter, r/ke (Figure 4E; RM-ANOVA, F(2,8) = 176; 10 nM TTX, p<0.01 vs. control; 30 nM TTX, p<0.001 vs. control, Dunnett's post-hoc test). In contrast, the uptake parameter, ku was not significantly affected by TTX at either concentration (Figure 4F; RM-ANOVA, F (2, 8) = 0.694, p =0.5276). Together, these experiments indicate that r/ke is a sensitive measure of DA release. Each of these manipulations also reduced the peak amplitude of the DA signals. However, since the amplitude of the signal is also influenced by uptake, we suggest that r/ke represents a less ambiguous measure of DA release, especially when drugs with unknown or complex mechanisms of action are to be tested.
Figure 4. Effect of Ca2+/Mg2+ and tetrodotoxin on DA release and uptake parameters.
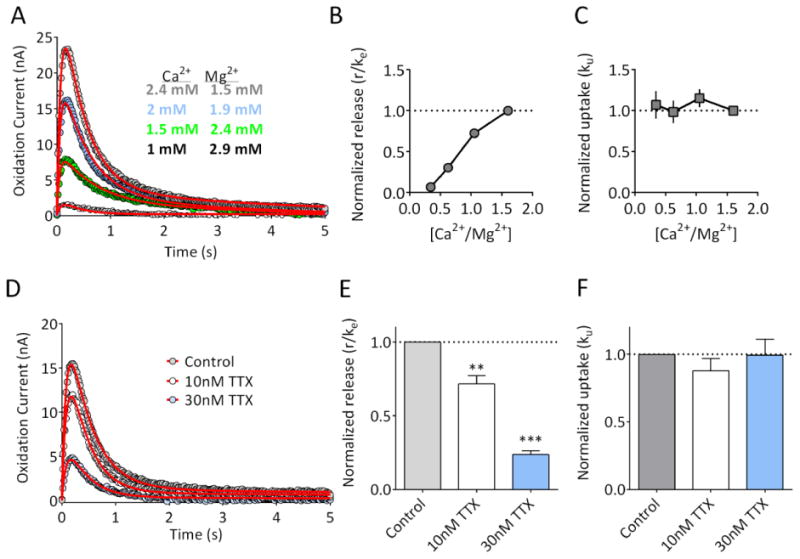
(A) Representative recording from a striatal brain slice, demonstrating the reduction in the response produced by lowering extracellular Ca2+ while raising Mg2+ in order to maintain divalent cation concentrations. Data represent the mean of 3 signals obtained under each condition, and are plotted with circles. The fitted curves from which parameters were extracted are shown with red lines. (B) Release parameter (r/ke) as a function of Ca2+/Mg2+ ratio (n = 5 slices from 2 rats). Release was significantly reduced by lowering Ca2+ and raising Mg2+ (RM-ANOVA, F(3,12) = 83.24, p<0.001). (C) The uptake parameter, ku, was not significantly affected by altering the Ca2+/Mg 2+ ratio (RM-ANOVA, F (3, 12) = 1.903, p =0.1830). (D) Representative recording from a striatal brain slice, demonstrating the reduction in the response produced by 10nM and 30 nM TTX. Data represent the mean of 3 signals obtained under each condition, and are plotted with circles. The fitted curves are shown with the red lines. (E) Summary of the effects of TTX on the release parameter (r/ke; n = 5 slices from 2 rats). Release was significantly reduced by TTX in a concentration-dependent manner (RM-ANOVA, F(2,8) = 176, p<0.001; **p<0.01, **p<0.001 vs. control, Dunnett's post-hoc). (F) The uptake parameter ku was not significantly affected by TTX application (RM-ANOVA, F (2, 8) = 0.6935, p =0.5276). Parameter values for the fitted curves are provided in Supplementary Information.
Modulation of the uptake and release parameters by dopamine transporter inhibitors
In order to verify that our model can also quantitatively account for modulation of uptake, we next evaluated the effects of three known dopamine transporter (DAT) inhibitors: cocaine, nomifensine, and the ‘bath salts’ constituent, methylenedioxypyrovalerone (MDPV). Using FSCV, we previously observed that MDPV is more potent and efficacious than cocaine24, using an area under the curve analysis that did not distinguish between uptake and release. Consistent with this earlier work, we observed that the effects of MDPV on the DA signal were much more robust than those of cocaine (Figure 5A,B). The extracted uptake parameter, ku, was plotted as a function of inhibitor concentration. As shown in Figure 5C, MDPV (n = 7 slices) was more potent than either cocaine (n = 8 slices) or the DAT/norepinephrine transporter (NET) inhibitor nomifensine (n = 7 slices). Surprisingly, we also observed that all of these uptake inhibitors significantly enhanced the release parameter r/ke in a concentration-dependent manner (Figure 5D; MDPV, one way RM-ANOVA, F(3,18) = 13.20; cocaine, one way RM-ANOVA, F(3, 21) = 19.83; nomifensine, F (3, 18) = 4.667). As with the inhibition of uptake, MDPV appeared to be more potent than either cocaine or nomifensine at facilitating release. Although cocaine has been suggested to enhance vesicular DA release in vivo25 as well as in vitro26, our results provide the first evidence that MDPV and nomifensine also increase vesicular DA release. Whether this is due to synapsin-dependent mechanisms, as has been proposed for cocaine26, will require additional study. However, our data support the hypothesis that a combination of uptake inhibition and enhanced vesicular release underlies the effects of these DAT inhibitors in vitro.
Figure 5. Inhibition of uptake and enhancement of vesicular DA release by DAT inhibitors.
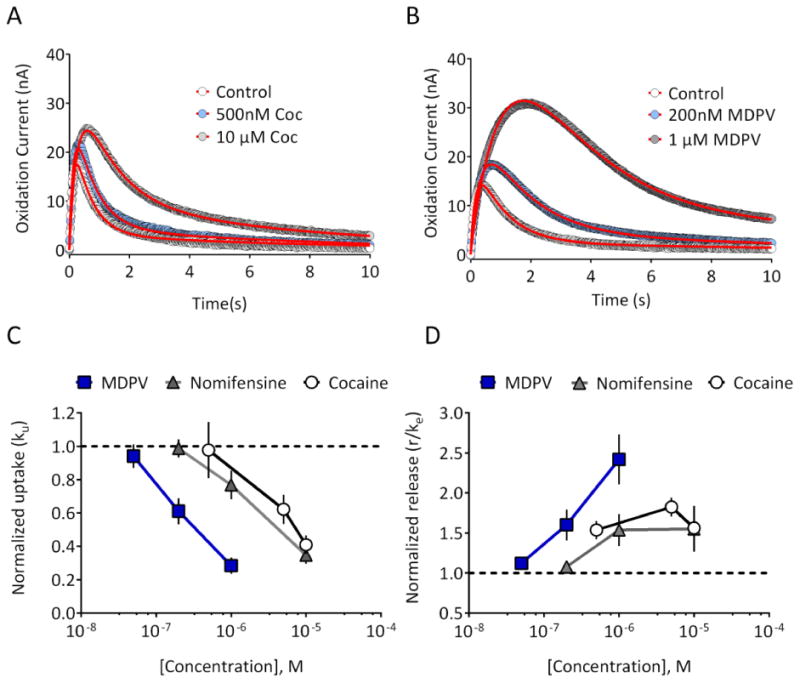
(A) Representative recording from a striatal brain slice, demonstrating the effects of 500nM and 10 μM cocaine. Data represent the mean of 3 signals obtained under each condition, and are plotted with circles. The fitted curves are shown with the red line. (B) Effects of MDPV (200 nM and 1 μM) on signals obtained in a different striatal slice. (C) Normalized uptake parameter, ku, was reduced in a concentration-dependent manner by MDPV (n = 7 slices from 2 rats), cocaine (n = 8 slices from 3 rats), and nomifensine (n = 7 slices from 2 rats). (D) The release parameter was increased in a concentration-dependent manner by MDPV, cocaine, and nomifensine. Parameter values for the fitted curves are provided in Supplementary Information.
Effects of amphetamine on DA release and uptake
A recent in vivo FSCV study proposed that amphetamine enhances exocytotic DA release 8, in apparent contrast with the demonstrated ability of this drug to deplete DA vesicles in vitro27. This paradoxical finding was recently investigated by Siciliano et. al. 9, who concluded that low concentrations (10-200nM) of amphetamine reduce uptake in brain slices without affecting release. However, the study by Siciliano et. al. utilized an analysis of peak amplitude changes in wildtype and DAT knockout mice rather than independent measures of release and uptake9. Given these findings, as well as the mixed effects of the uptake inhibitors noted above, we evaluated the actions of amphetamine (300nM) on release and uptake parameters in our model. As shown in Figure 6, amphetamine significantly reduced the uptake parameter ku (Figure 6B; n = 9, p = 0.02, paired two-tailed t-test), but did not significantly affect the release parameter r/ke (Figure 6A; p = 0.07, paired two-tailed t-test). Thus, our model confirms the findings of Siciliano et al. 9, and is consistent with the known ability of amphetamine to inhibit DAT at low concentrations (Ki = 34 nM28). It is important to note, however, that our measurement of r/ke reflects conventional, vesicular release, as evidenced by its sensitivity to TTX and Ca2+/Mg2+. At higher concentrations than those used in the present study, amphetamine is also known to elicit outward, transporter-mediated efflux of DA29, 30 detected using background-subtracted FSCV31 and other voltammetric approaches.32 Thus, whereas amphetamine's actions as a DAT inhibitor are readily apparent using our model, we found no evidence for this drug's ability to enhance vesicular DA release.
Figure 6. Effect of amphetamine on modeled parameters.
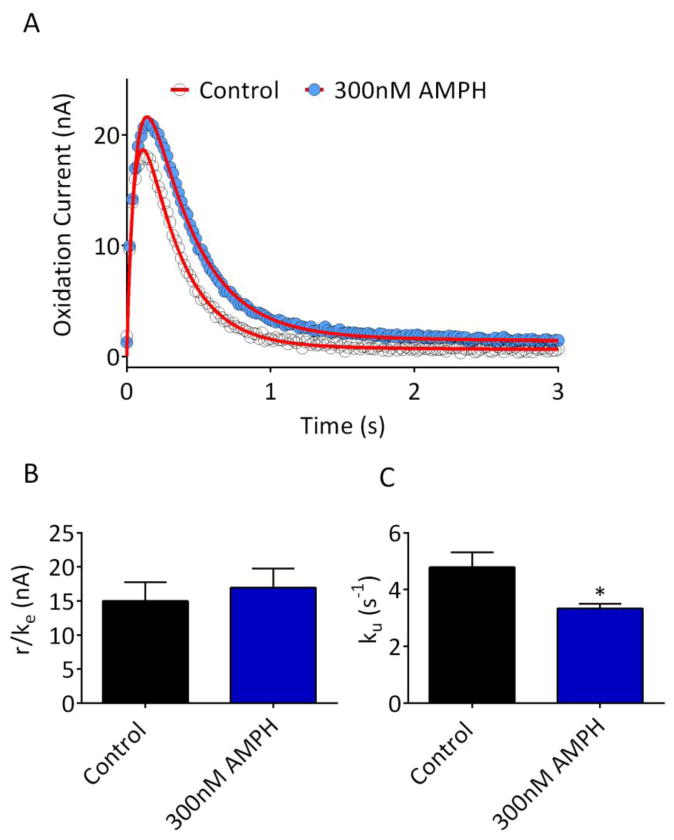
(A) Representative recording from a striatal brain slice, prior to (Control) and following bath application of 300nM amphetamine (AMPH). Data represent the mean of 3 signals obtained under each condition, and are plotted with circles. The fitted curves are shown with the red line. (B) Release parameter, r/ke, for all slices tested with AMPH (n = 9). No significant difference in release was observed (p = 0.07 vs. control, paired two-tailed t-test). (C) The uptake parameter (ku) was significantly reduced by 300nM AMPH (*p = 0.017 vs. control, paired two-tailed t-test). Parameter values for the fitted curves are provided in Supplementary Information.
Modulation of DA release by kappa opioid receptors
The data presented above suggest that r/ke and ku are useful in distinguishing between pharmacological manipulations that affect release and uptake, respectively. Although uptake inhibitors, manipulations in external calcium levels, and TTX represent mechanistically distinct ways to affect these processes, the mechanism(s) through which other drugs affect DA release or uptake is still controversial. The presence of KORs on DA axonal profiles33, 34, coupled with the aversive behavioral effects of KOR activation35 has led to the hypothesis that KORs can directly modulate DA release. However, studies utilizing microdialysis36 or biochemical approaches37 have suggested that kappa opioid receptors (KORs) directly interact with DATs, and enhance DA uptake. In contrast, earlier in vitro FSCV studies strongly suggest that kappa agonists inhibit DA release, without affecting uptake14, 15. We therefore evaluated the effects of the selective KOR agonist U50,48815, 38 on DA signal parameters. As shown in Figure 7, U50,488 inhibited DA release as indicated by a significant reduction in the r/ke parameter (Figure 7B; RM-ANOVA, F(2,10) = 9.42, p=0.005). In contrast, U50,488 did not significantly affect the uptake parameter ku (RM-ANOVA, F (2, 10) = 0.5017, p = 0.62). Although we cannot discount the possibility that systemic or long-term treatment with KOR agonists might alter DA uptake via altered DAT trafficking37, we suggest that the acute inhibitory effects of KOR activation in vitro reflect a direct effect on DA release, as previously suggested14, 15.
Figure 7. Inhibition of striatal DA release by the kappa opioid receptor.
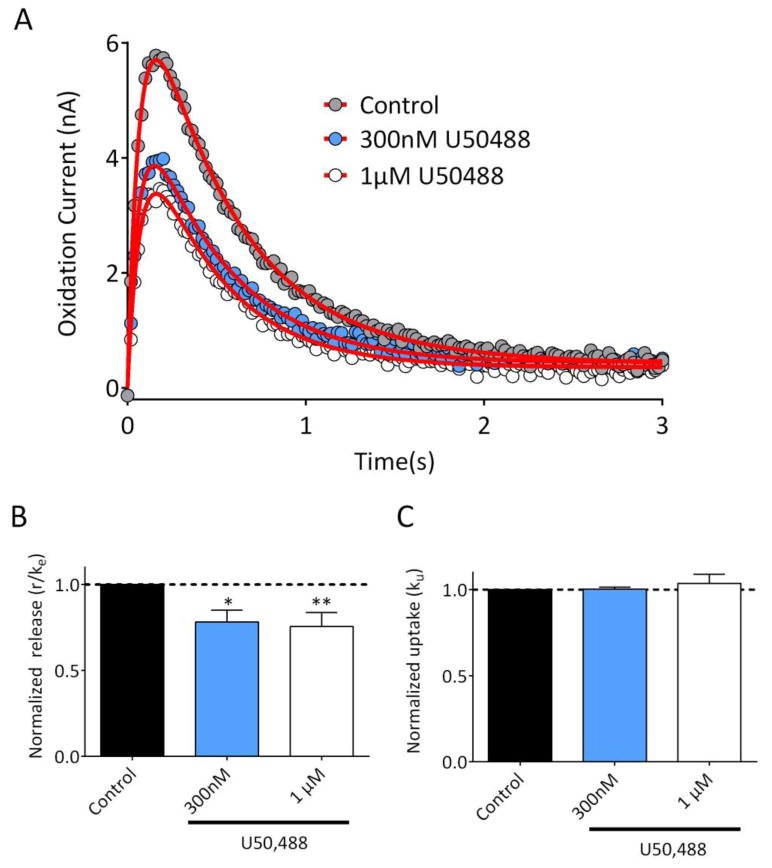
(A) Representative recording from a striatal brain slice, demonstrating the effects of 300nM and 1 μM U50,488. Data represent the mean of 3 signals obtained under each condition, and are plotted with circles. The fitted curves are shown with the red line. (B) Summary of the release parameter, r/ke (n = 6 slices, 2 rats). U50,488 significantly reduced release at both 300nM and 1 μM (RM-ANOVA, F(2,10) = 9.42, p = 0.005; **p <0.05, ***p<0.01 vs. control, Dunnett's post hoc) . (C) The normalized uptake parameter, ku, was not significantly affected by U50,488 (RM-ANOVA, F (2, 10) = 0.5017, p = 0.620). Parameter values for the fitted curves are provided in Supplementary Information.
Advantages of the present model
A major advantage of our model is that it can be applied to non-transformed data, using conventional, commercially available software (GraphPad Prism, Origin, SigmaPlot, etc.). In contrast, modeling using Michaelis-Menten kinetics requires first transforming current measurements into concentration. Both time-dependent changes in electrode sensitivity and the post-recording calibration environment18, 19 may influence these measures, thereby adding uncertainty in the conversion of current to DA concentration. Additionally, Michaelis-Menten models make assumptions about the mechanism of inhibitor effects, which is not justified for poorly characterized or novel drugs5. Our model is based on the kinetic model proposed by Walters et al.11, 12, which proposes that DA release first occurs into an ‘inner compartment,’ followed by transfer into an ‘outer compartment’ where the recording electrode measures the oxidation current (see Supplementary Information). This model fully accounts for the lag and/or overshoot in the electrode response typically observed during in vivo recordings12. In the present study, DA is initially detected within 20 ms following local, single pulse electrical stimulation in the brain slice, and reaches a maximum within 150-200ms. Thus, whereas lag is minimal given the proximity of the stimulating and recording electrodes in the slice, there is still a delay for DA to be fully ‘transferred’ from the release site(s) to the recording electrode. This delay is fully accounted for by the first order rate constant ke in our mathematical model, equivalent to the kT term derived by Walters et al.11,12. Whereas r and ke individually reflect complex underlying processes that are difficult to resolve, we demonstrate that the ratio of these two values will always yield the DA initially present in the inner compartment (DAic). Since DAic is itself directly derived from DA released from the axon terminals11, 12, solving for DAic is fundamentally a measure of DA release. We note that r/ke values are slightly but significantly higher than the peak amplitude of the response, consistent with their relationship to DA release. Importantly, we found that whereas r/ke and peak amplitude were strongly correlated, only peak amplitude maintained a small but significant correlation with the uptake parameter. In essence, r/ke provides a correction for the peak amplitude that would otherwise be confounded by ongoing uptake. For this reason, we believe that solving for r/ke and ku, as described here, will be beneficial for examining the mechanisms through which various agents alter DA release and uptake as measured by FSCV.
Implications for drug abuse
Our results confirm the ability of the psychostimulant cocaine to promote DA release, a process that has been linked to cocaine's interaction with Ca2+-dependent vesicular proteins26 . We also demonstrate that, in addition to their actions as uptake inhibitors, both MDPV and nomifensine are also able to increase vesicular DA release. The release-promoting effects of MDPV have not been described previously, and it remains to be determined whether the mechanisms underlying this effect are similar to those described previously for cocaine25, 26. The robust enhancement of vesicular DA release by MDPV, coupled with its ability to potently inhibit uptake, likely contributes to the rewarding properties of this widely abused synthetic cathinone39, 40. The effects of cocaine, nomifensine, and MDPV on release are also distinct from the actions of amphetamine, which did not promote vesicular release according to our model. Although amphetamine can disrupt vesicular storage9, 41 at higher concentrations (>1 μM) than those used in the present study, we observed no effects on release at the lower concentration tested. Together, these studies help to further discriminate the specific actions of various stimulants on DA release and uptake.
In summary, by applying a simplified model of DA release and uptake with brain slice recordings, we describe a method for cleanly distinguishing DA release from uptake using FSCV. The model can be easily implemented using common non-linear curve-fitting software packages, and it does not requires transformation of the data. Our model was validated in brain slices using a variety of physiological and pharmacological manipulations that alter DA release and/or uptake, and we suggest that it may be similarly useful in investigating the actions of any drug or manipulation thought to affect DA signaling dynamics.
Methods
Subjects
All studies were performed in brain slices obtained from 4-5 week old male Sprague-Dawley rats. Studies were approved by the NIDA IRP Animal Care and Use Committee, in accordance with NIH Guidelines.
Brain slice preparation
Rats were anesthetized with isoflurane and decapitated, and brains were rapidly removed and placed in ice-cold, oxygenated artificial cerebrospinal fluid (aCSF) consisting of, in mM: NaCl 126, KCl 3, MgCl2 1.5, CaCl2 2.4, NaH2PO4 1.2, NaHCO3 26, glucose 11. Coronal hemisections (280 μm) containing the striatum were cut using a vibratome (Leica VT1200S, Buffalo Grove, IL, USA). Slices were incubated in standard oxygenated aCSF at 34-35 °C for ∼20 minutes and allowed to stabilize at room temperature for at least 30 minutes prior to initiating recordings. During recordings, slices were placed in a small volume recording chamber (RC-26, Warner Instruments), continuously superfused with aCSF at a rate of 2 mL/min using a peristaltic pump, and maintained at 28-30°C using an in-line solution heater. A manifold containing stopcock valves was used to switch between control and drug-containing aCSF.
Fast scan cyclic voltammetry
Fast scan cyclic voltammetry using carbon fiber electrodes was performed as described previously13, 42. Carbon fibers (7 μm diameter) were vacuum-aspirated into borosilicate glass pipettes and cut so that ∼25-30 μm exposed surface protruded from the pipette tip. Pipettes were back filled with a 4 M potassium acetate/150 mM KCl solution and connected to the headstage of a holder/headstage assembly (HEKA EVA-8, Heka Instruments, Holliston MA). Voltage scans, stimulation protocols and data acquisition were performed using PCI-based A/D boards and LabView-based software (TarHeel CV, Univ. of North Carolina). Scans consisted of sweeps from -0.4 to 1.3 V and back to -0.4 V, at a rate of 400 V/s, and were obtained at either 10 or 50 Hz. A 5 sec control period preceded each electrically-evoked response, and was used to obtain a background current that was digitally subtracted from the current obtained during the peak of the response. All cyclic voltammograms matched the expected profile of DA. Under stereoscopic magnification, carbon fibers were lowered to a depth of ∼100 μm in the dorsal striatum. A bipolar stimulating electrode, connected to a constant current stimulus isolator (DS-3, Digitimer, Hertfordshire, UK) was positioned ∼75-100 μm from the carbon fiber. Responses were elicited by a single pulse (1 ms, 150-200 μA) every 90s. Pre-drug baselines were obtained by averaging 3 responses prior to drug application. Post-drug responses were taken by averaging the last 3 responses following a 12 minute drug application.
Modeling of measured DA signals
Prior work has demonstrated that the DA measured at carbon fiber electrodes in vivo and in vitro reflects the net balance of release, uptake, and diffusional processes3-5. We therefore began by assuming, as in Walters et al.11 (their equation 2) that the dopamine concentration at the carbon fiber electrode is described by a first-order differential equation (neglecting “hang-up”):
| [Equation 1] |
where r is a release rate parameter, ke a rate constant for transfer of DA to the carbon fiber electrode, and ku an uptake parameter that comprises both diffusion and transporter-mediated uptake. The solution to this equation (initial [DA] = 0) is
If uptake were blocked (ku = 0), then at t→(x0221E) [DA]= r/ke. In other words, the ratio of the parameters r and ke is simply the DA concentration that would appear at the electrode if all uptake (diffusion and transport) were blocked and time were infinite; r/ke is the measure of DA released used in this paper. Since r is a rate parameter, it is given in units of nA/s or μM/s, and ke will be given in s-1. Thus, r/ke will be in units of either nA, or μM if converted to concentration by post-hoc calibration. The parameter ku is also expressed in s-1.
In addition to its release, uptake, and diffusion, DA also undergoes adsorption to the electrode surface10, 11, where it undergoes multiple redox cycles and thereby continues to contribute to the signal. This process, modeled as a first-order adsorption-desorption process, gives rise to the tail or “hang-up”12 component of the signal:
| [Equation 2] |
where kads and kdes are adsorption and desorption rate constants, respectively, that have been scaled to fit the data. These two coupled differential equations can be solved for both free and adsorbed dopamine, which are summed as the measured signal:
This signal function is used to simulate data (Figure 1D-F), or fit to real data by a least-squares algorithm to derive the parameter values. Programs such as MLAB (Civilized Software, Bethesda, MD) can use the system of differential equations above to simulate or fit data. In order to allow the signals to be simulated or fit by other programs (such as GraphPad Prism or Excel) that cannot readily utilize complex systems of differential equations, the integrated form of these equations may be used (Supplementary Information).
Drugs and reagents
Cocaine hydrochloride, d-amphetamine sulfate, and MDPV were obtained through NIDA Drug Supply. Tetrodotoxin (TTX) was obtained from Alamone Labs (Jerusalem, Israel). U50488 hydrochloride and nor-BNI were obtained from Tocris. All other reagents and chemicals were obtained from Sigma-Aldrich. Drugs were prepared as stock solutions in water and dissolved freshly before use in aCSF.
Data analysis
Mean responses were plotted in either MLAB (Civilized Software, Bethesda, MD) or GraphPad Prism (v 6.0, GraphPad Scientific, San Diego CA). Non-linear curve fitting, using a least-squares algorithm, was used to calculate parameters for each curve. In nearly all cases, all of the parameters were unconstrained. In a few cases, in order to improve fitting, kads or kdes was allowed to be a shared parameter within a dataset, since these parameters reflect a property of the recording electrode (e.g., adsorption) and would not be expected to be affected by pharmacological manipulations. Parameters were normalized to the control (pre-drug) condition within each slice. Statistical tests were performed using GraphPad Prism, with a critical level of p <0.05 used to determine statistical significance. Post-hoc comparisons were only performed when an ANOVA yielded a significant main effect. Tau and 80% decay times of signals were measured using the WinWCP software package (WinWCP v 5.0.8, University of Strathclyde, Glasgow, U.K.; http://spider.science.strath.ac.uk/sipbs/software_ses.htm).
Supplementary Material
Acknowledgments
The authors wish to thank Drs. Joseph Cheer and Michael Baumann for their helpful discussions and critical reading of the manuscript, as well as the anonymous reviewers who provided many insightful comments during the preparation of this work.
Funding: Support was provided by the NIDA Intramural Research Program.
Footnotes
Associated content: Supplementary information includes a schematic illustration of the restricted diffusion model described in the present study, the integrated forms of the differential equations for release/uptake and adsorption, as well as an example script of programming syntax for GraphPad Prism. In addition, parameter value tables for all datasets shown in Figures 3-7 are provided.
The authors declare no competing financial interests.
Author contributions: A.F.H. and C.E.S. designed and performed all experiments, with input from C.R.L. C.E.S. and A.F.H. analyzed data. A.F.H., C.E.S., and C.R.L. wrote the manuscript.
Present address: Electrophysiology Research Section, National Institutes of Health, National Institute on Drug Abuse Intramural Research Program, Baltimore, MD USA
References
- 1.Keithley RB, Takmakov P, Bucher ES, Belle AM, Owesson-White CA, Park J, Wightman RM. Higher sensitivity dopamine measurements with faster-scan cyclic voltammetry. Anal Chem. 2011;83:3563–3571. doi: 10.1021/ac200143v. [DOI] [PMC free article] [PubMed] [Google Scholar]
- 2.Kile BM, Walsh PL, McElligott ZA, Bucher ES, Guillot TS, Salahpour A, Caron MG, Wightman RM. Optimizing the Temporal Resolution of Fast-Scan Cyclic Voltammetry. ACS Chem Neurosci. 2012;3:285–292. doi: 10.1021/cn200119u. [DOI] [PMC free article] [PubMed] [Google Scholar]
- 3.Wightman RM, Zimmerman JB. Control of dopamine extracellular concentration in rat striatum by impulse flow and uptake. Brain Res Brain Res Rev. 1990;15:135–144. doi: 10.1016/0165-0173(90)90015-g. [DOI] [PubMed] [Google Scholar]
- 4.Jones SR, Garris PA, Kilts CD, Wightman RM. Comparison of dopamine uptake in the basolateral amygdaloid nucleus, caudate-putamen, and nucleus accumbens of the rat. J Neurochem. 1995;64:2581–2589. doi: 10.1046/j.1471-4159.1995.64062581.x. [DOI] [PubMed] [Google Scholar]
- 5.Wu Q, Reith ME, Wightman RM, Kawagoe KT, Garris PA. Determination of release and uptake parameters from electrically evoked dopamine dynamics measured by real-time voltammetry. J Neurosci Methods. 2001;112:119–133. doi: 10.1016/s0165-0270(01)00459-9. [DOI] [PubMed] [Google Scholar]
- 6.Ferris MJ, Calipari ES, Mateo Y, Melchior JR, Roberts DC, Jones SR. Cocaine self-administration produces pharmacodynamic tolerance: differential effects on the potency of dopamine transporter blockers, releasers, and methylphenidate. Neuropsychopharmacology. 2012;37:1708–1716. doi: 10.1038/npp.2012.17. [DOI] [PMC free article] [PubMed] [Google Scholar]
- 7.Yorgason JT, Espana RA, Jones SR. Demon voltammetry and analysis software: analysis of cocaine-induced alterations in dopamine signaling using multiple kinetic measures. J Neurosci Methods. 2011;202:158–164. doi: 10.1016/j.jneumeth.2011.03.001. [DOI] [PMC free article] [PubMed] [Google Scholar]
- 8.Daberkow DP, Brown HD, Bunner KD, Kraniotis SA, Doellman MA, Ragozzino ME, Garris PA, Roitman MF. Amphetamine paradoxically augments exocytotic dopamine release and phasic dopamine signals. J Neurosci. 2013;33:452–463. doi: 10.1523/JNEUROSCI.2136-12.2013. [DOI] [PMC free article] [PubMed] [Google Scholar]
- 9.Siciliano CA, Calipari ES, Ferris MJ, Jones SR. Biphasic mechanisms of amphetamine action at the dopamine terminal. J Neurosci. 2014;34:5575–5582. doi: 10.1523/JNEUROSCI.4050-13.2014. [DOI] [PMC free article] [PubMed] [Google Scholar]
- 10.Bath BD, Michael DJ, Trafton BJ, Joseph JD, Runnels PL, Wightman RM. Subsecond adsorption and desorption of dopamine at carbon-fiber microelectrodes. Analytical Chemistry. 2000;72:5994–6002. doi: 10.1021/ac000849y. [DOI] [PubMed] [Google Scholar]
- 11.Walters SH, Robbins EM, Michael AC. Modeling the Kinetic Diversity of Dopamine in the Dorsal Striatum. ACS Chem Neurosci. 2015;6:1468–1475. doi: 10.1021/acschemneuro.5b00128. [DOI] [PubMed] [Google Scholar]
- 12.Walters SH, Taylor IM, Shu Z, Michael AC. A novel restricted diffusion model of evoked dopamine. ACS Chem Neurosci. 2014;5:776–783. doi: 10.1021/cn5000666. [DOI] [PMC free article] [PubMed] [Google Scholar]
- 13.Good CH, Hoffman AF, Hoffer BJ, Chefer VI, Shippenberg TS, Backman CM, Larsson NG, Olson L, Gellhaar S, Galter D, Lupica CR. Impaired nigrostriatal function precedes behavioral deficits in a genetic mitochondrial model of Parkinson's disease. FASEB J. 2011;25:1333–1344. doi: 10.1096/fj.10-173625. [DOI] [PMC free article] [PubMed] [Google Scholar]
- 14.Britt JP, McGehee DS. Presynaptic opioid and nicotinic receptor modulation of dopamine overflow in the nucleus accumbens. J Neurosci. 2008;28:1672–1681. doi: 10.1523/JNEUROSCI.4275-07.2008. [DOI] [PMC free article] [PubMed] [Google Scholar]
- 15.Ehrich JM, Messinger DI, Knakal CR, Kuhar JR, Schattauer SS, Bruchas MR, Zweifel LS, Kieffer BL, Phillips PE, Chavkin C. Kappa Opioid Receptor-Induced Aversion Requires p38 MAPK Activation in VTA Dopamine Neurons. J Neurosci. 2015;35:12917–12931. doi: 10.1523/JNEUROSCI.2444-15.2015. [DOI] [PMC free article] [PubMed] [Google Scholar]
- 16.Sykova E, Nicholson C. Diffusion in brain extracellular space. Physiol Rev. 2008;88:1277–1340. doi: 10.1152/physrev.00027.2007. [DOI] [PMC free article] [PubMed] [Google Scholar]
- 17.Hrabetova S, Nicholson C. Contribution of dead-space microdomains to tortuosity of brain extracellular space. Neurochem Int. 2004;45:467–477. doi: 10.1016/j.neuint.2003.11.011. [DOI] [PubMed] [Google Scholar]
- 18.Kume-Kick J, Rice ME. Dependence of dopamine calibration factors on media Ca2+ and Mg2+ at carbon-fiber microelectrodes used with fast-scan cyclic voltammetry. Journal of Neuroscience Methods. 1998;84:55–62. doi: 10.1016/s0165-0270(98)00087-9. [DOI] [PubMed] [Google Scholar]
- 19.Gerhardt G, Hoffman A. Effects of recording media composition on the responses of Nafion-coated carbon fiber microelectrodes measured using high-speed chronoamperometry. Journal of Neuroscience Methods. 2001;109:13–21. doi: 10.1016/s0165-0270(01)00396-x. [DOI] [PubMed] [Google Scholar]
- 20.Dodge FA, Jr, Rahamimoff R. Co-operative action a calcium ions in transmitter release at the neuromuscular junction. J Physiol. 1967;193:419–432. doi: 10.1113/jphysiol.1967.sp008367. [DOI] [PMC free article] [PubMed] [Google Scholar]
- 21.Schneggenburger R, Neher E. Intracellular calcium dependence of transmitter release rates at a fast central synapse. Nature. 2000;406:889–893. doi: 10.1038/35022702. [DOI] [PubMed] [Google Scholar]
- 22.Thanawala MS, Regehr WG. Presynaptic calcium influx controls neurotransmitter release in part by regulating the effective size of the readily releasable pool. J Neurosci. 2013;33:4625–4633. doi: 10.1523/JNEUROSCI.4031-12.2013. [DOI] [PMC free article] [PubMed] [Google Scholar]
- 23.Del Castillo J, Engbaek L. The nature of the neuromuscular block produced by magnesium. J Physiol. 1954;124:370–384. doi: 10.1113/jphysiol.1954.sp005114. [DOI] [PMC free article] [PubMed] [Google Scholar]
- 24.Baumann MH, Partilla JS, Lehner KR, Thorndike EB, Hoffman AF, Holy M, Rothman RB, Goldberg SR, Lupica CR, Sitte HH, Brandt SD, Tella SR, Cozzi NV, Schindler CW. Powerful cocaine-like actions of 3,4-methylenedioxypyrovalerone (MDPV), a principal constituent of psychoactive ‘bath salts’ products. Neuropsychopharmacology. 2013;38:552–562. doi: 10.1038/npp.2012.204. [DOI] [PMC free article] [PubMed] [Google Scholar]
- 25.Venton BJ, Seipel AT, Phillips PE, Wetsel WC, Gitler D, Greengard P, Augustine GJ, Wightman RM. Cocaine increases dopamine release by mobilization of a synapsin-dependent reserve pool. J Neurosci. 2006;26:3206–3209. doi: 10.1523/JNEUROSCI.4901-04.2006. [DOI] [PMC free article] [PubMed] [Google Scholar]
- 26.Kile BM, Guillot TS, Venton BJ, Wetsel WC, Augustine GJ, Wightman RM. Synapsins differentially control dopamine and serotonin release. J Neurosci. 2010;30:9762–9770. doi: 10.1523/JNEUROSCI.2071-09.2010. [DOI] [PMC free article] [PubMed] [Google Scholar]
- 27.Jones SR, Joseph JD, Barak LS, Caron MG, Wightman RM. Dopamine neuronal transport kinetics and effects of amphetamine. J Neurochem. 1999;73:2406–2414. doi: 10.1046/j.1471-4159.1999.0732406.x. [DOI] [PubMed] [Google Scholar]
- 28.Rothman RB, Baumann MH, Dersch CM, Romero DV, Rice KC, Carroll FI, Partilla JS. Amphetamine-type central nervous system stimulants release norepinephrine more potently than they release dopamine and serotonin. Synapse. 2001;39:32–41. doi: 10.1002/1098-2396(20010101)39:1<32::AID-SYN5>3.0.CO;2-3. [DOI] [PubMed] [Google Scholar]
- 29.Sitte HH, Freissmuth M. Amphetamines, new psychoactive drugs and the monoamine transporter cycle. Trends Pharmacol Sci. 2015;36:41–50. doi: 10.1016/j.tips.2014.11.006. [DOI] [PMC free article] [PubMed] [Google Scholar]
- 30.Rothman RB, Baumann MH. Monoamine transporters and psychostimulant drugs. European Journal of Pharmacology. 2003;479:23–40. doi: 10.1016/j.ejphar.2003.08.054. [DOI] [PubMed] [Google Scholar]
- 31.Jones SR, Gainetdinov RR, Wightman RM, Caron MG. Mechanisms of amphetamine action revealed in mice lacking the dopamine transporter. J Neurosci. 1998;18:1979–1986. doi: 10.1523/JNEUROSCI.18-06-01979.1998. [DOI] [PMC free article] [PubMed] [Google Scholar]
- 32.Burrell MH, Atcherley CW, Heien ML, Lipski J. A Novel Electrochemical Approach for Prolonged Measurement of Absolute Levels of Extracellular Dopamine in Brain Slices. ACS Chem Neurosci. 2015 doi: 10.1021/acschemneuro.5b00120. [DOI] [PubMed] [Google Scholar]
- 33.Svingos AL, Chavkin C, Colago EE, Pickel VM. Major coexpression of kappa-opioid receptors and the dopamine transporter in nucleus accumbens axonal profiles. Synapse. 2001;42:185–192. doi: 10.1002/syn.10005. [DOI] [PubMed] [Google Scholar]
- 34.Svingos AL, Colago EE, Pickel VM. Cellular sites for dynorphin activation of kappa-opioid receptors in the rat nucleus accumbens shell. J Neurosci. 1999;19:1804–1813. doi: 10.1523/JNEUROSCI.19-05-01804.1999. [DOI] [PMC free article] [PubMed] [Google Scholar]
- 35.Bals-Kubik R, Ableitner A, Herz A, Shippenberg TS. Neuroanatomical sites mediating the motivational effects of opioids as mapped by the conditioned place preference paradigm in rats. J Pharmacol Exp Ther. 1993;264:489–495. [PubMed] [Google Scholar]
- 36.Chefer VI, Czyzyk T, Bolan EA, Moron J, Pintar JE, Shippenberg TS. Endogenous kappa-opioid receptor systems regulate mesoaccumbal dopamine dynamics and vulnerability to cocaine. J Neurosci. 2005;25:5029–5037. doi: 10.1523/JNEUROSCI.0854-05.2005. [DOI] [PMC free article] [PubMed] [Google Scholar]
- 37.Kivell B, Uzelac Z, Sundaramurthy S, Rajamanickam J, Ewald A, Chefer V, Jaligam V, Bolan E, Simonson B, Annamalai B, Mannangatti P, Prisinzano TE, Gomes I, Devi LA, Jayanthi LD, Sitte HH, Ramamoorthy S, Shippenberg TS. Salvinorin A regulates dopamine transporter function via a kappa opioid receptor and ERK1/2-dependent mechanism. Neuropharmacology. 2014;86:228–240. doi: 10.1016/j.neuropharm.2014.07.016. [DOI] [PMC free article] [PubMed] [Google Scholar]
- 38.Rothman RB, France CP, Bykov V, De Costa BR, Jacobson AE, Woods JH, Rice KC. Pharmacological activities of optically pure enantiomers of the kappa opioid agonist, U50,488, and its cis diastereomer: evidence for three kappa receptor subtypes. Eur J Pharmacol. 1989;167:345–353. doi: 10.1016/0014-2999(89)90443-3. [DOI] [PubMed] [Google Scholar]
- 39.Schindler CW, Thorndike EB, Goldberg SR, Lehner KR, Cozzi NV, Brandt SD, Baumann MH. Reinforcing and neurochemical effects of the “bath salts” constituents 3,4-methylenedioxypyrovalerone (MDPV) and 3,4-methylenedioxy-N-methylcathinone (methylone) in male rats. Psychopharmacology (Berl) 2015 doi: 10.1007/s00213-015-4057-0. [DOI] [PMC free article] [PubMed] [Google Scholar]
- 40.Bonano JS, Glennon RA, De Felice LJ, Banks ML, Negus SS. Abuse-related and abuse-limiting effects of methcathinone and the synthetic “bath salts” cathinone analogs methylenedioxypyrovalerone (MDPV), methylone and mephedrone on intracranial self-stimulation in rats. Psychopharmacology (Berl) 2014;231:199–207. doi: 10.1007/s00213-013-3223-5. [DOI] [PMC free article] [PubMed] [Google Scholar]
- 41.Sulzer D, Chen TK, Lau YY, Kristensen H, Rayport S, Ewing A. Amphetamine redistributes dopamine from synaptic vesicles to the cytosol and promotes reverse transport. J Neurosci. 1995;15:4102–4108. doi: 10.1523/JNEUROSCI.15-05-04102.1995. [DOI] [PMC free article] [PubMed] [Google Scholar]
- 42.Chen YH, Harvey BK, Hoffman AF, Wang Y, Chiang YH, Lupica CR. MPTP-induced deficits in striatal synaptic plasticity are prevented by glial cell line-derived neurotrophic factor expressed via an adeno-associated viral vector. FASEB J. 2008;22:261–275. doi: 10.1096/fj.07-8797com. [DOI] [PMC free article] [PubMed] [Google Scholar]
Associated Data
This section collects any data citations, data availability statements, or supplementary materials included in this article.