

Abstract
Objective
In many cancers, varying regions within the tumor are often phenotypically heterogeneous, including their metabolic phenotype. Further, tumor regions can be metabolically compartmentalized, with metabolites transferred between compartments. When present, this metabolic coupling can promote aggressive behavior. Tumor metabolism in papillary thyroid cancer (PTC) is poorly characterized.
Study Design
Immunohistochemical staining of tissue samples.
Level of Evidence
N/A
Methods
PTC specimens from 46 patients with (n=19) and without advanced disease (n=27) were compared to non-cancerous thyroid tissue (NCT) and benign thyroid specimens (n=6 follicular adenoma (FA) and n=5 nodular goiter (NG)). Advanced disease was defined as presence of lateral neck lymphadenopathy. Immunohistochemistry was performed for Translocase of Outer Mitochondrial membrane 20 (TOMM20), a marker of oxidative phosphorylation, and monocarboxylate transporter 4 (MCT4), a marker of glycolysis.
Results
PTC and FA thyrocytes had high staining for TOMM20 compared to NCT and nodular goiter (NG) (p<0.01). High MCT4 staining in fibroblasts was more common in PTC with advanced disease than in any other tissue type studied (p<0.01). High MCT4 staining was found in all 19 cases of PTC with advanced disease, in 11 out of 19 samples with low stage disease, in 1 out of 5 samples of FA, in 1 of 34 NCT and in 0 out of 6 NG samples. Low fibroblast MCT4 staining in PTC correlated with absence of clinical adenopathy (p=0.028), absence of extrathyroidal extension (p=0.004), low ATA risk (p=0.001), low AGES score (p=0.004) and low AMES risk (p=0.002).
Conclusion
This study suggests that multiple metabolic compartments exist in PTC, and low fibroblast MCT4 may be a biomarker of indolent disease.
Keywords: Papillary, Thyroid, Cancer, Reverse-Warburg, Metabolism, Coupling
Introduction
Many human cancers display significant tumor heterogeneity, and different regions or compartments within the tumor display varying metabolic phenotypes. Coupling between these metabolic compartments may allow for transfer of high energy metabolites from one compartment to another to meet the high bioenergetic demands of tumorigenesis. This intratumoral metabolic heterogeneity has been demonstrated in many cancer types, such as breast and head and neck squamous cell carcinoma and is associated with poor outcomes1-4. Cancer cells at the leading edge of growth exploit adjacent glycolytic cancer associated fibroblasts (CAFs) utilizing their metabolic byproducts such as lactate and pyruvate to perform oxidative phosphorylation (OXPHOS)5. Accordingly, a two compartment model of tumor metabolism was proposed where carcinoma cells generate oxidative stress in adjacent fibroblasts and leads to increased production of catabolites such as lactate, glutamine, and ketone bodies5,1. These catabolites are taken up by carcinoma cells and serve as substrates for OXPHOS and promote tumorigenesis6-8. Specifically, metabolic coupling between glycolytic fibroblasts and cancer cells with high OXPHOS metabolism promotes tumor growth by increasing proliferation and inducing resistance to apoptosis in cancer cells9.
There has been little research on the metabolism of papillary thyroid cancer (PTC) but studies suggest that metabolic dysregulation does occur in this disease. PTC thyrocytes have more abundant mitochondria than normal thyrocytes 10. Furthermore, a genome wide expression analysis in PTC identified pathways involved in mitochondrial OXPHOS and fatty acid synthesis as being associated with more aggressive disease11. Of the differentially enriched gene sets, three of the eleven that were associated with mortality were related to OXPHOS and mitochondrial metabolism11. Furthermore, tumorigenesis in PTC is thought to be caused in over 70% of cases by abnormalities in the mitogen-activated protein kinase (MAPK) signaling pathway which includes mutations in RAS, RET/PTC and BRAF12,13,14. While links between MAPK signaling and altered cell metabolism have not been studied specifically in PTC, RAS-related alterations in MAPK signaling result in altered cellular metabolism. Cancer cells with active RAS have increased glucose uptake and catabolism, increased reactive oxygen species (ROS), and require OXPHOS for proliferation and tumorigenesis15. Conversely, RAS activation in fibroblasts drives glycolysis16. These glycolytic fibroblasts generated by oncogenic transformation with RAS activation promote tumor growth17.
The current study sought to identify groups of PTC patients with and without advanced disease to assess for differences in their metabolic phenotypes. Translocase of the outer mitochondrial membrane 20 (TOMM20) was used as a marker of OXPHOS and monocarboxylate transporter 4 (MCT4) was used as a marker of glycolytic metabolism. TOMM20 is a central component of the receptor complex responsible for the recognition and translocation of cytosolically-synthesized mitochondrial proteins and has been shown to be an indicator of functional mitochondrial mass and of OXPHOS2,18,19. Monocarboxylate transporters (MCTs) are a class of membrane bound proteins involved in the influx and efflux of small metabolites such as lactate, pyruvate and ketone bodies4. MCT4 is the main transporter involved in lactate efflux, is a marker of glycolytic metabolism and oxidative stress, and its expression has been shown to be associated with poor outcomes in other cancers20. To our knowledge, this is the first study to investigate if multiple metabolic compartments exist in PTC.
Materials and Methods
Subjects
The study protocol was approved by our Institutional Review Board. Records from our institution from 2011 to 2014 were reviewed by surgical codes to identify patients that presented with PTC. We identified advanced PTC in 19 consecutive patients. Advanced PTC was defined as presence of lateral neck lymphadenopathy. Additionally, a cohort of 27 consecutive PTC patients without advanced disease that had undergone thyroid lobectomy or thyroidectomy was identified. Eleven patient samples with benign thyroid pathology were also studied. Patients were excluded if they had evidence of poor differentiation or anaplastic features. Patient data collected included age, sex, stage, tumor morphology, pathologic features, surgical and clinical records. Also, MACIS, AMES and AGES scores were calculated, and the American Thyroid Association recurrence risk level was assessed21.
Tissue Samples
For all cases, the surgical resection specimens were reviewed to confirm the diagnosis of PTC by two thyroid pathologists. Non-cancerous thyroid (NCT) adjacent to the tumor was used as an internal control when present (n=34 of 38 PTC specimens). Benign tissue specimens were also used as controls from six patients with a final diagnosis of nodular goiter (NG) and five with a diagnosis of follicular adenoma (FA). Samples were stained by immunohistochemistry for TOMM20, which was from Santa Cruz Biotechnology (F-10), and MCT4 was a kind gift of Nancy J. Philp, PhD and has been described in detail22. Briefly, tissues for analysis were fixed in neutral buffered formalin and then embedded in paraffin. Sections (4 μm) were dewaxed, rehydrated through graded ethanols, and antigen retrieval was performed in 10 mM citrate buffer, pH 6.0, for 10 min using a pressure cooker. The sections were cooled, blocked with 3% hydrogen peroxide and then for endogenous biotin using the DakoCytomation Biotin Blocking Sytem (Dako). Sections were next incubated with 10% goat serum for 30 min, followed by primary antibodies overnight at 4°C (Santa Cruz Biotechnology). Primary antibody binding was detected with a biotinylated species-specific secondary antibody (Vector Labs) followed by a streptavidin-horseradish peroxidase conjugate (Dako). Immunoreactivity was revealed with 3, 3′ diaminobenzidine (Dako). Sections were counterstained with hematoxylin.
Immunohistochemical staining was assessed via an empirically-derived staining score for TOMM20 and MCT4. Each case was reviewed independently by two pathologists. The pathologists were blinded to clinical outcome and prior pathology report. TOMM20 was considered “High” when at least 70% of cells demonstrated strong, diffuse cytoplasmic staining. The remaining cases were considered “Low.” Cancer and fibroblast staining patterns were studied and quantified independently. The fibroblasts in close proximity to the carcinoma cells were defined in this study as cancer-associated fibroblasts (CAFs). All tumor present on a slide and its dominant staining pattern were considered when determining the percent of immune-positive cancer and CAF cells in a sample. MCT4 fibroblast staining was scored as “high” if greater than 30% of stromal fibroblasts stained strongly for MCT4.
Statistical Analysis
Statistical analysis was carried out for Immunohistochemical staining patterns of TOMM20 and MCT4, between specimens using logistic regression and Fischer's exact methods. The exact logistic regression model was used to evaluate the relationship between MCT4 and various endpoints at significance level of alpha = 5%, with the help of R package elrm 23,24.
Results
Patient Characteristics
The clinical characteristics are outlined in Table 1. In the advanced stage PTC group, defined as having clinical adenopathy in the lateral neck, the mean age at diagnosis was 46 years. Pathologic characteristics of these patients are listed in Table 1. Fourteen patients had classic PTC, while two had tall cell and three had mixed classic and follicular variants. Extrathyroidal extension was evident in thirteen subjects, and five had extensive tumor extension extending to the esophagus, carotid sheath, or prevertebral muscles. Four subjects had evidence of perineural invasion (PNI). Thirteen subjects had extracapsular lymph node spread. Three patients had evidence of distant metastatic disease on presentation. All subjects except one had complete primary surgical resection. One patient had thyroid bed recurrence and subsequently underwent additional surgical resection to negative margins. All subjects in this advanced disease group received radioactive iodine with doses ranging from 50-200 mCI.
Table 1.
Patient Characteristics.
| Patient Characteristics | PTC | |
|---|---|---|
| Advanced | Not Advanced | |
| Male | 6 | 8 |
| Female | 13 | 19 |
| Age | 48 (21-67) | 48 (23-70) |
| Age >45 | 14 | 14 |
| T Stage 1a | 4 | 8 |
| 1b | 1 | 10 |
| 2 | 0 | 4 |
| 3 | 9 | 5 |
| 4a | 5 | 0 |
| N Stage 0 | 0 | 26 |
| 1a | 0 | 1 |
| 1b | 19 | 0 |
| M Stage 0 | 16 | 27 |
| 1 | 3 | 0 |
| RAI | 19 | 4 |
| Recurrence | 3 | 0 |
| Pathologic Features | ||
| Nodular Goiter | 0 | 0 |
| Follicular Adenoma | 0 | 0 |
| Classical PTC | 14 | 15 |
| Follicular Variant | 0 | 11 |
| Classic / Follicular Variant | 3 | 1 |
| Tall Cell | 2 | 0 |
| Extrathyroidal Extension | 13 | 1 |
| Gross Invasion | 5 | 0 |
| Lymphovasular Invasion | 9 | 1 |
| Perineural Invasion | 4 | 0 |
| Extracapsular Nodal Spread | 13 | 0 |
| Clinical Predictors | ||
| MACIS Score: <6 | 9 | 26 |
| 6-6.99 | 6 | 1 |
| ≥7 | 4 | 0 |
| AGES Score: ≤4 | 11 | 25 |
| >4 | 8 | 2 |
| AMES Level: Low | 7 | 25 |
| High | 12 | 2 |
| ATA Level: Low | 1 | 24 |
| Intermediate | 11 | 3 |
| High | 7 | 0 |
In the PTC group without advanced disease, the age ranged from 23-70 (mean 48). Eleven patients had follicular variant of PTC, while fifteen had classic and one had mixed classic and follicular variant. One patient demonstrated minimal lymphovascular invasion (LVI), and one had microscopic extrathyroidal extension (ETE). No patients had clinically or ultrasonographically identified pathologic lymph nodes. Four patients received radioactive iodine treatment. All patients were free of disease after treatment. In the non-cancerous thyroid (NCT) control group, ages ranged from 31-80 years (mean 54). Five patients demonstrated follicular adenomas (FA) and six had nodular goiter (NG). Examples of hematoxylin and eosin staining of normal thyroid tissue, nodular goiter, follicular adenoma and papillary thyroid cancer are shown in Figure 1.
Figure 1.
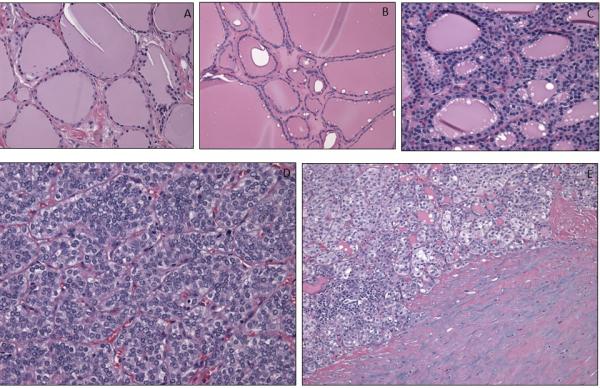
Hematoxylin and eosin staining in non-cancerous thyroid tissue (A), nodular goiter (B), follicular adenoma (C), and papillary thyroid cancer (D) and cancer associated fibroblasts (E).
TOMM20 Protein Expression in Thyrocytes and Fibroblasts
Mitochondrial OXPHOS was assessed within the populations of noncancerous thyrocytes, PTC thyrocytes, and fibroblasts independently by TOMM20 immunohistochemistry. Two staining patterns for TOMM20 were found, which were: a strong diffuse staining pattern scored as high, or a weak diffuse or a weak patchy staining pattern scored as low. In all non-neoplastic samples including both the adjacent non-tumor thyrocytes from the PTC specimens and NG thyrocytes, TOMM20 expression was low (Fig. 2A). In contrast to this, all PTC thyrocytes from patients with and without advanced disease showed high expression of TOMM20 homogenously throughout the tumor (Fig. 2B). In the non-advanced group, 4 patients did not have strong staining while all of the advanced group did; however this difference was not statistically significant (p=0.36). In the FA specimens, all of the adenomatous thyrocytes showed high expression of TOMM20 compared to adjacent non-tumor thyrocytes and nodular goiter samples. Low expression of TOMM20 was seen in all the fibroblast populations which includes the cancer associated fibrolasts and non-tumor adjacent fibroblasts (Fig. 2A, 2B). High TOMM20 expression in PTC cells and FA is consistent with a highly functional mitochondrial mass and this finding contrasts with low TOMM20 expression in thyrocytes in NG, NCT, CAFs and normal fibroblasts or non-tumor adjacent fibroblast populations.
Figure 2.
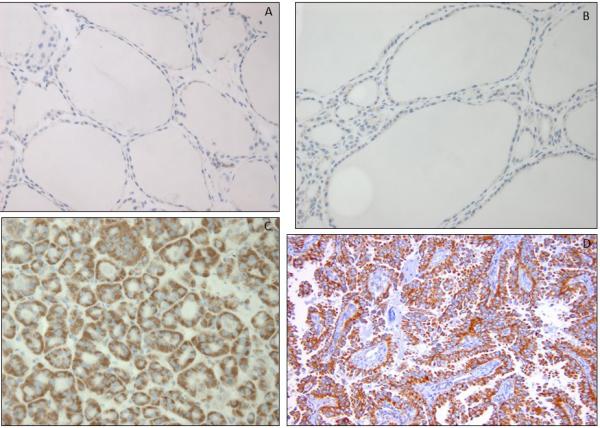
TOMM20 immunohistochemistry in non-cancerous thyroid tissue (A), nodular goiter (B), follicular adenoma (C) and papillary thyroid cancer (D).
MCT4 Protein Expression in Thyrocytes and Fibroblasts
Fibroblasts in NCT tissue demonstrated low MCT4 staining in 43 of 44 cases (Fig. 3A). In the NG specimens, all samples demonstrated low MCT4 expression in fibroblasts. In the FA group, the fibroblasts around the adenoma and throughout the rest of the gland demonstrated low MCT4 staining in 4 of 5 cases. In a single FA case, MCT4 was elevated around the adenoma yet negative throughout the rest of the gland. In the PTC group with advanced disease, all 19 cases demonstrated high MCT4 staining in the cancer associated fibroblasts (CAFs). In the PTC group without advanced disease, elevated MCT4 expression in CAFs was evident in the CAFs in 17 out of 27 specimens (Table 2, Figure 4). Hence, the pattern of CAF MCT4 expression is statistically different in the advanced group compared to the group without advanced PTC (p<0.01). When only classic variant of PTC was analyzed (FV PTC excluded), only 10 of 17 showed high MCT4 staining, which was also statistically significantly different from the advanced PTC group (p<0.01).
Figure 3.
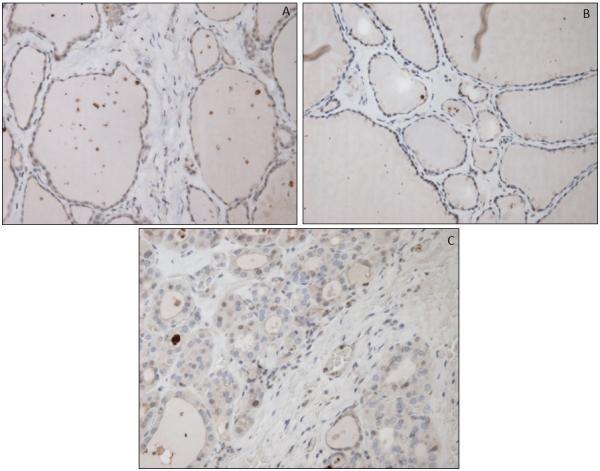
MCT4 staining in non-cancerous thyroid tissue (A), nodular goiter (B), and follicular adenoma (C).
Table 2.
Relationship between fibroblast MCT4 and prognostic biomarkers.
| Papillary Thyroid Carcinoma (n=46) | |||
|---|---|---|---|
| Low stromal MCT4 | High stromal MCT4 | p-value | |
| No adenopathy | 100% (10/10) | 37% (17/36) | 0.001 |
| No ETE | 100% (10/10) | 61% (22/36) | 0.020 |
| Low ATA risk | 100% (10/10) | 58% (21/36) | 0.0009 |
| Low AMES risk | 100% (10/10) | 39% (14/36) | 0.020 |
Figure 4.
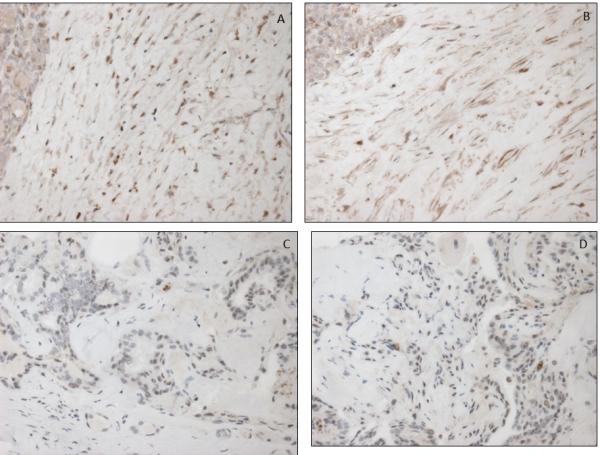
Low MCT4 staining in cancer associated fibroblasts of papillary thyroid cancer (A,B) and high MCT4 cancer associated fibroblasts of papillary thyroid cancer (C,D).
None of the specimens with low MCT4 in the CAFs demonstrated evidence of any negative prognostic or aggressive features, such as ETE, LVI, PNI, clinical adenopathy, elevated MACIS, AMES or AGES score, or intermediate or high ATA risk of recurrence (Table 2). Moreover, low MCT4 staining in CAFs correlated with a low AMES score (p=0.002) and AGES score (p=0.004), and thus a better prognosis. Low MCT4 staining in CAFs also correlated with low ATA risk of recurrence (p=0.001), and with the absence of ETE (p=0.004). Stromal staining also correlated with comparison of T1-2 vs T3-4 tumors for the overall group (p=0.047). CAF MCT4 staining did not correlate with the presence of Hashimoto's thyroiditis (p=0.74) (Table 3).
Table 3.
TOMM20 and MCT4 staining and clinicopathologic characteristics.
| Stroma MCT4 IHC | high | low | OR | CI | p-value |
|---|---|---|---|---|---|
| Tumor Associated Stroma Non Tumor Associated Stroma |
36 1 |
10 41 |
N/A* | N/A* | 0.0001 |
| High-risk PTC Low-risk PTC |
19 17 |
0 10 |
0.47 | (0.14,1.02) | 0.028 |
| Hashimoto's No Hashimoto's |
9 27 |
3 8 |
0.75 | (0.13,4.20) | 0.744 |
| Clinical Adenopathy No Clinical Adenopathy |
19 17 |
0 10 |
0.47 | (0.14,1.02) | 0.028 |
| MACIS Score <6 MACIS Score ≥6 |
25 11 |
10 0 |
0.45 | (0.00,0.79) | 0.003 |
| AGES ≤4 AGES >4 |
26 10 |
10 0 |
0.49 | (0.00,0.75) | 0.004 |
| AMES Low AMES High |
22 14 |
10 0 |
0.37 | (0.00,0.69) | 0.002 |
| ATA Low ATA Intermed / Hig |
15 21 |
10 0 |
0.49 | (0.00,0.81) | 0.001 |
| Age <40 Age ≥40 |
9 27 |
2 8 |
0.75 | (0.13,4.20) | 0.744 |
| (+) PNI (−)PNI |
5 31 |
0 10 |
0.66 | (0.00,0.83) | 0.004 |
| T1 >T1 |
15 21 |
8 2 |
5.6 | (1.04,30.2) | 0.045 |
| C PTC Other PTC |
23 13 |
6 4 |
0.85 | (0.20,3.57) | 0.822 |
| (+) ETE (−) ETE |
14 22 |
0 10 |
0.36 | (0.00,0.69) | 0.004 |
| (+) LVI (−) LVI |
11 25 |
0 10 |
0.5 | (0.00,0.76) | 0.004 |
| T1, T2 T3, T4 |
18 18 |
9 1 |
9 | (1.03,78.6) | 0.047 |
Discussion
This study suggests that different metabolic compartments exist within the PTC tumor and that metabolic changes in CAFs are associated with tumor behavior. CAFs with high MCT4 staining which is a marker of glycolysis were found in all cases of advanced PTC. No tumors with low fibroblast MCT4 staining demonstrated advanced disease or aggressive features. Low fibroblast MCT4 staining was associated with lower MACIS, AMES, AGES and ATA risk levels and the absence of ETE.
TOMM20 is a membrane transporter in mitochondria which regulates mitochondrial metabolism and its expression correlates with mitochondrial OXPHOS2,18,19. PTC specimens demonstrated high TOMM20 staining while non-cancerous thyrocytes stained low, suggesting that there is increased OXPHOS in cancer cells. Our results are consistent with studies in other tumors such as in breast cancer where higher mitochondrial metabolism is found in carcinoma cells compared to non-cancerous ductal cells which are their normal counterparts25. It is likely that oncogene metabolic rewiring leads to increased mitochondrial metabolism in the carcinoma cells of PTC with high TOMM20 staining. The mechanisms by which genetic abnormalities in PTC drive metabolic reprogramming will need to be determined.
In this study, cancer cells in PTC expressed TOMM20 highly and diffusely throughout the tumor. Interestingly, this staining pattern contrasts with staining in head and neck squamous carcinoma (HNSCC) where TOMM20 is more highly expressed in the cancer cells in the periphery of the tumor. HNSCC tumors typically have very hypoxic regions26. Hypoxia would not only limit OXPHOS in the tumor cells, but may also create an additional glycolytic compartment in the tumor. It has been proposed that hypoxia drives multicompartment metabolism and metabolic coupling27. HNSCC appears to have the ability to couple this glycolytic compartment to the oxidative compartment at the leading edge of the tumor, and this correlates with worse prognosis. The absence of this compartment in PTC specimens, may suggest a lower ability to couple tumor compartments in PTC and may provide an explanation for the general lack of aggressive behavior in most PTC specimens compared to HNSCC. Future work will be required to assess hypoxia as a driver of tumor metabolism in PTC.
Furthermore, FA specimens also demonstrated increased TOMM20 staining which may suggest that accumulation of metabolic abnormalities is a stepwise process in thyroid neoplasia. Further study would be required to investigate this process. High mitochondrial metabolism may not be sufficient to drive aggressive behavior in PTC given the fact that the OXPHOS marker TOMM20 is upregulated in both aggressive PTCs such as advanced stage disease and in more indolent diseases such as low stage PTC and even FAs. We suspect that metabolic rewiring may occur prior to metabolic coupling, and the degree to which metabolic coupling is achieved may determine the level of aggressive behavior in a given tumor. It may be that the cancer cells have little supply of glycolytic metabolites either due to the lack of abundant transformed fibroblasts compartment that releases catabolites as is seen in other tumors such as breast cancer or due to a lack of cancer cell heterogeneity with a highly catabolic subtype of cancer cells that release catabolites as seen in HNSCC28. Alternatively, the cancerous thyrocytes cells may lack the ability to effectively create or utilize these compartments for growth and invasion. Future studies should be conducted to test such hypotheses since PTC may offer a unique model to identify critical early steps in the transformation to aggressive cancer.
The current study adds to a body of literature supporting the role of mitochondrial metabolism in human cancers5,29. It had been thought that human cancer cells used glycolysis universally to generate ATP based on cell culture experiments30. Interestingly, detailed metabolic characterization of cancer cells cultured homotypically with high glucose reveals high rates of glycolysis whereas experiments that include lower glucose levels with alternative metabolic substrates such as lactate, pyruvate or fatty acids or the presence of stromal cells show a shift towards mitochondrial metabolism or OXPHOS and more aggressive features5,29,31. It is now recognized that cancer cells frequently up-regulate many metabolic pathways compared to their non-cancerous counterparts and don't rely exclusively on glycolysis to generate ATP 32. Future studies will need to determine if certain metabolic features contribute to PTC aggressiveness. In accordance with Paget's “seed and soil” hypothesis that the interactions between cancer cells and their microenvironment are critical in cancer progression33, the role of metabolic interactions between carcinoma and stromal cells in PTC progression needs to be further explored. CAFs in PTC demonstrated higher MCT4 expression, compared to normal fibroblasts and compared to normal and cancerous thyrocytes. This suggests that fibroblasts adjacent to cancerous thyrocytes display a glycolytic metabolic phenotype distinct from normal fibroblasts. MCT4 is a marker of oxidative stress and glycolytic metabolism, and it induces efflux of lactate out of the cells20. Studies have shown in other cancers that stromal cells have high catabolism which supplies cancer cells with high energy metabolites8,29. Cancer cells in turn use these metabolites for OXPHOS. This mechanism of metabolic coupling has been demonstrated in breast, ovarian, prostate cancer and lymphomas5,31,34,35. The current study adds to a body of literature describing metabolic compartmentalization in tumors of the head and neck region.
The relationship between tumor glycolysis as measured by MCT4 staining and tumor uptake on positron emission tomography (PET) scans has not previously been studied. Our study demonstrates that low MCT4 staining correlates with markers of low risk PTC, including less extrathryoidal extension and clinical lymphadenopathy. A study by Kim et al. has shown that low-PET-avidity PTC specimens also have low risk features including lower lymphovascular invasion and smaller tumor size36. Data on PET avidity were not available for our patients, but future studies may be able to compare PET findings in PTC to MCT4 staining and other metabolic markers.
Targeting the metabolism of cancer cells or their adjacent fibroblasts may offer a novel therapeutic strategy in PTC. OXPHOS inhibitors may be effective anticancer drugs in PTC since there is homogenously high expression of the OXPHOS marker TOMM20. No potent OXPHOS inhibitors are FDA approved. However, there is some data to suggest that the weak OXPHOS inhibitor metformin has activity in PTC. Metformin was associated with a higher remission rate in a retrospective cohort of subjects with differentiated thyroid cancer and where PTC was the most common histology37. Metformin induced apoptosis of cancer cells and reduced tumor growth in a xenograft model of PTC38. Metformin's beneficial effects in thyroid cancer however may be due to non-mitochondrial effects since it improves insulin resistance and reduces insulin levels which drives thyroid proliferation or cancer39. Metformin may also reduce TSH level which could suppress the growth of thyroid carcinoma cells, and therefore have protective properties against the development and progression of PTC39. Use of metformin in patients at risk for PTC may prove to be protective against the development or progression of this disease39.
In conclusion, metabolic markers suggest that in advanced stage PTC, thyrocytes have high mitochondrial metabolism and adjacent fibroblasts have high glycolysis. Metabolic coupling and catabolite transfer may occur in PTC between these two tumor compartments (Figure 5). The intensity of TOMM20 and MCT4 staining in PTC cancer cells and fibroblasts respectively will need to be studied as a prognostic and predictive biomarker. A cancer cell mitochondrial compartment and a fibroblast glycolytic compartment in PTC may help us understand how PTC cells obtain energy to survive, proliferate and metastasize. The answer may be that multiple tumor compartments with glycolysis in fibroblasts and OXPHOS in cancer cells allows more efficient tumor metabolism.
Figure 5.
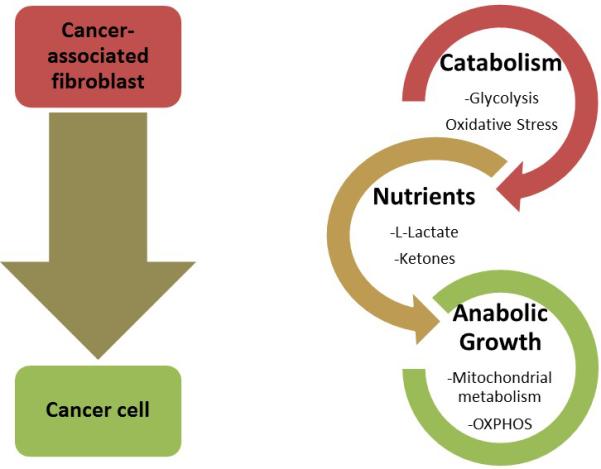
Model of metabolic coupling. As the cancer cell influences the fibroblast to become more metabolically reliant on glycolysis, the fibroblasts export more high energy nutrients via MCT4 such as lactate, pyruvate and ketones. These, in turn, can be taken up by the cancer cells and utilized for mitochondrial respiration to produce greater quantities of ATP and fuel anabolic growth.
Acknowledgments
Funding:
Research reported in this publication was supported by the National Cancer Institute of the National Institutes of Health under Award Number K08 CA175193-01A1 and P30CA056036 and the American Head and Neck Society / American Academy of Otolaryngology Head and Neck Surgery Young Investigator Combined Grant; Award ID: 314313. Funding was used to provide material support for laboratory testing.
Footnotes
Conflict of Interest Disclosures: None
Data Integrity:
Drs. Curry and Martinez-Outschoorn had full access to all the data in the study and take responsibility for the integrity of the data and the accuracy of the data analysis.
Author Contributions:
Study concept and design: Curry, Cotzia, Luginbuhl, Cognetti, Pribitkin, Keane, Birbe, Tuluc, Martinez-Outschoorn
Data acquisition: Curry, Cotzia, Luginbuhl, Cognetti, Mollaee, Tassone
Data Analysis and Interpretation: Curry, Cotzia, Sprandio, Mollaee, Pribitkin, Keane, Zhan, Tuluc, Martinez-Outschoorn, Tassone
Drafting of manuscript: Curry, Cotzia, Sprandio, Martinez-Outschoorn, Tassone
Critical revision of manuscript: Curry, Luginbuhl, Cognetti, Mollaee, Goldman, Pribitkin, Keane, Zhan, Birbe, Tuluc, Martinez-Outschoorn, Tassone
Disclosures:
The authors have no conflicts of interest to report.
References
- 1.Martinez-Outschoorn UE, Lin Z, Trimmer C, et al. Cancer cells metabolically “fertilize” the tumor microenvironment with hydrogen peroxide, driving the Warburg effect: implications for PET imaging of human tumors. Cell Cycle. 2011;10:2504–2520. doi: 10.4161/cc.10.15.16585. [DOI] [PMC free article] [PubMed] [Google Scholar]
- 2.Curry JM, Tuluc M, Whitaker-Menezes D, et al. Cancer metabolism, stemness and tumor recurrence: MCT1 and MCT4 are functional biomarkers of metabolic symbiosis in head and neck cancer. Cell Cycle. 2013;12:1371–1384. doi: 10.4161/cc.24092. [DOI] [PMC free article] [PubMed] [Google Scholar]
- 3.Martinez-Outschoorn UE, Curry JM, Ko YH, et al. Oncogenes and inflammation rewire host energy metabolism in the tumor microenvironment: RAS and NFkappaB target stromal MCT4. Cell Cycle. 2013;12:2580–2597. doi: 10.4161/cc.25510. [DOI] [PMC free article] [PubMed] [Google Scholar]
- 4.Feron O. Pyruvate into lactate and back: from the Warburg effect to symbiotic energy fuel exchange in cancer cells. Radiother Oncol. 2009;92:329–333. doi: 10.1016/j.radonc.2009.06.025. [DOI] [PubMed] [Google Scholar]
- 5.Martinez-Outschoorn UE, Sotgia F, Lisanti MP. Power surge: supporting cells “fuel” cancer cell mitochondria. Cell Metab. 2012;15:4–5. doi: 10.1016/j.cmet.2011.12.011. [DOI] [PubMed] [Google Scholar]
- 6.Bonuccelli G, Tsirigos A, Whitaker-Menezes D, et al. Ketones and lactate “fuel” tumor growth and metastasis: Evidence that epithelial cancer cells use oxidative mitochondrial metabolism. Cell Cycle. 2010;9:3506–3514. doi: 10.4161/cc.9.17.12731. [DOI] [PMC free article] [PubMed] [Google Scholar]
- 7.Martinez-Outschoorn UE, Goldberg A, Lin Z, et al. Anti-estrogen resistance in breast cancer is induced by the tumor microenvironment and can be overcome by inhibiting mitochondrial function in epithelial cancer cells. Cancer Biol Ther. 2011;12:924–938. doi: 10.4161/cbt.12.10.17780. [DOI] [PMC free article] [PubMed] [Google Scholar]
- 8.Martinez-Outschoorn UE, Lisanti MP, Sotgia F. Catabolic cancer-associated fibroblasts transfer energy and biomass to anabolic cancer cells, fueling tumor growth. Semin Cancer Biol. 2014;25C:47–60. doi: 10.1016/j.semcancer.2014.01.005. [DOI] [PubMed] [Google Scholar]
- 9.Witkiewicz AK, Whitaker-Menezes D, Dasgupta A, et al. Using the “reverse Warburg effect” to identify high-risk breast cancer patients: stromal MCT4 predicts poor clinical outcome in triple-negative breast cancers. Cell Cycle. 2012;11:1108–1117. doi: 10.4161/cc.11.6.19530. [DOI] [PMC free article] [PubMed] [Google Scholar]
- 10.Yeh JJ, Lunetta KL, van Orsouw NJ, et al. Somatic mitochondrial DNA (mtDNA) mutations in papillary thyroid carcinomas and differential mtDNA sequence variants in cases with thyroid tumours. Oncogene. 2000;19:2060–2066. doi: 10.1038/sj.onc.1203537. [DOI] [PubMed] [Google Scholar]
- 11.Nilubol N, Sukchotrat C, Zhang L, He M, Kebebew E. Molecular pathways associated with mortality in papillary thyroid cancer. Surgery. 2011;150:1023–1031. doi: 10.1016/j.surg.2011.09.021. [DOI] [PMC free article] [PubMed] [Google Scholar]
- 12.Fagin JA. How thyroid tumors start and why it matters: kinase mutants as targets for solid cancer pharmacotherapy. J Endocrinol. 2004;183:249–256. doi: 10.1677/joe.1.05895. [DOI] [PubMed] [Google Scholar]
- 13.Kondo T, Ezzat S, Asa SL. Pathogenetic mechanisms in thyroid follicular-cell neoplasia. Nat Rev Cancer. 2006;6:292–306. doi: 10.1038/nrc1836. [DOI] [PubMed] [Google Scholar]
- 14.Fagin JA, Mitsiades N. Molecular pathology of thyroid cancer: diagnostic and clinical implications. Best Pract Res Clin Endocrinol Metab. 2008;22:955–969. doi: 10.1016/j.beem.2008.09.017. [DOI] [PMC free article] [PubMed] [Google Scholar]
- 15.Weinberg F, Hamanaka R, Wheaton WW, et al. Mitochondrial metabolism and ROS generation are essential for Kras-mediated tumorigenicity. Proc Natl Acad Sci U S A. 2010;107:8788–8793. doi: 10.1073/pnas.1003428107. [DOI] [PMC free article] [PubMed] [Google Scholar]
- 16.Ramanathan A, Wang C, Schreiber SL. Perturbational profiling of a cell-line model of tumorigenesis by using metabolic measurements. Proc Natl Acad Sci U S A. 2005;102:5992–5997. doi: 10.1073/pnas.0502267102. [DOI] [PMC free article] [PubMed] [Google Scholar]
- 17.Migneco G, Whitaker-Menezes D, Chiavarina B, et al. Glycolytic cancer associated fibroblasts promote breast cancer tumor growth, without a measurable increase in angiogenesis: evidence for stromal-epithelial metabolic coupling. Cell Cycle. 2010;9:2412–2422. doi: 10.4161/cc.9.12.11989. [DOI] [PubMed] [Google Scholar]
- 18.Wurm CA, Neumann D, Lauterbach MA, et al. Nanoscale distribution of mitochondrial import receptor Tom20 is adjusted to cellular conditions and exhibits an inner-cellular gradient. Proc Natl Acad Sci U S A. 2011;108:13546–13551. doi: 10.1073/pnas.1107553108. [DOI] [PMC free article] [PubMed] [Google Scholar]
- 19.Gehrke S, Wu Z, Klinkenberg M, et al. PINK1 and Parkin Control Localized Translation of Respiratory Chain Component mRNAs on Mitochondria Outer Membrane. Cell Metab. 2015;21:95–108. doi: 10.1016/j.cmet.2014.12.007. [DOI] [PMC free article] [PubMed] [Google Scholar]
- 20.Ullah MS, Davies AJ, Halestrap AP. The plasma membrane lactate transporter MCT4, but not MCT1, is up-regulated by hypoxia through a HIF-1alpha-dependent mechanism. J Biol Chem. 2006;281:9030–9037. doi: 10.1074/jbc.M511397200. [DOI] [PubMed] [Google Scholar]
- 21.Cooper DS, Doherty GM, Haugen BR, et al. Revised American Thyroid Association management guidelines for patients with thyroid nodules and differentiated thyroid cancer. Thyroid. 2009;19:1167–1214. doi: 10.1089/thy.2009.0110. [DOI] [PubMed] [Google Scholar]
- 22.Gallagher SM, Castorino JJ, Wang D, Philp NJ. Monocarboxylate transporter 4 regulates maturation and trafficking of CD147 to the plasma membrane in the metastatic breast cancer cell line MDA-MB-231. Cancer Res. 2007;67:4182–4189. doi: 10.1158/0008-5472.CAN-06-3184. [DOI] [PubMed] [Google Scholar]
- 23.R Core Team . R Foundation for Statistical Computing. Vienna, Austria: 2015. A language and environment for statistical computing. http://www.R-project.org/ [Google Scholar]
- 24.Zamar D MBaGJ. elrm: Software Implementing Exact-like Inference for Logistic Regression Models. Journal of Statistical Software. 2007:21. [Google Scholar]
- 25.Martinez-Outschoorn U, Sotgia F, Lisanti MP. Tumor microenvironment and metabolic synergy in breast cancers: critical importance of mitochondrial fuels and function. Semin Oncol. 2014;41:195–216. doi: 10.1053/j.seminoncol.2014.03.002. [DOI] [PubMed] [Google Scholar]
- 26.Rademakers SE, Lok J, van der Kogel AJ, Bussink J, Kaanders JH. Metabolic markers in relation to hypoxia; staining patterns and colocalization of pimonidazole, HIF-1alpha, CAIX, LDH-5, GLUT-1, MCT1 and MCT4. BMC Cancer. 2011;11:167. doi: 10.1186/1471-2407-11-167. [DOI] [PMC free article] [PubMed] [Google Scholar]
- 27.Semenza GL. Tumor metabolism: cancer cells give and take lactate. J Clin Invest. 2008;118:3835–3837. doi: 10.1172/JCI37373. [DOI] [PMC free article] [PubMed] [Google Scholar]
- 28.Curry JM, Sprandio J, Cognetti D, et al. Tumor microenvironment in head and neck squamous cell carcinoma. Semin Oncol. 2014;41:217–234. doi: 10.1053/j.seminoncol.2014.03.003. [DOI] [PubMed] [Google Scholar]
- 29.Wallace DC. Mitochondria and cancer. Nat Rev Cancer. 2012;12:685–698. doi: 10.1038/nrc3365. [DOI] [PMC free article] [PubMed] [Google Scholar]
- 30.Vander Heiden MG, Cantley LC, Thompson CB. Understanding the Warburg effect: the metabolic requirements of cell proliferation. Science. 2009;324:1029–1033. doi: 10.1126/science.1160809. [DOI] [PMC free article] [PubMed] [Google Scholar]
- 31.Nieman KM, Kenny HA, Penicka CV, et al. Adipocytes promote ovarian cancer metastasis and provide energy for rapid tumor growth. Nat Med. 2011;17:1498–1503. doi: 10.1038/nm.2492. [DOI] [PMC free article] [PubMed] [Google Scholar]
- 32.Obre E, Rossignol R. Emerging concepts in bioenergetics and cancer research: Metabolic flexibility, coupling, symbiosis, switch, oxidative tumors, metabolic remodeling, signaling and bioenergetic therapy. Int J Biochem Cell Biol. 2015;59C:167–181. doi: 10.1016/j.biocel.2014.12.008. [DOI] [PubMed] [Google Scholar]
- 33.Fidler IJ, Poste G. The “seed and soil” hypothesis revisited. Lancet Oncol. 2008;9:808. doi: 10.1016/S1470-2045(08)70201-8. [DOI] [PubMed] [Google Scholar]
- 34.Fiaschi T, Marini A, Giannoni E, et al. Reciprocal metabolic reprogramming through lactate shuttle coordinately influences tumor-stroma interplay. Cancer Res. 2012;72:5130–5140. doi: 10.1158/0008-5472.CAN-12-1949. [DOI] [PubMed] [Google Scholar]
- 35.Martinez-Outschoorn UE, Whitaker-Menezes D, Valsecchi M, et al. Reverse Warburg effect in a patient with aggressive B-cell lymphoma: is lactic acidosis a paraneoplastic syndrome? Semin Oncol. 2013;40:403–418. doi: 10.1053/j.seminoncol.2013.04.016. [DOI] [PubMed] [Google Scholar]
- 36.Kim MH, Ko SH, Bae JS, et al. Non-FDG-avid primary thyroid carcinoma may not differ from FDG-avid papillary thyroid carcinoma. Thyroid. 2013;23:1452–60. doi: 10.1089/thy.2013.0051. [DOI] [PubMed] [Google Scholar]
- 37.Klubo-Gwiezdzinska J, Costello J, Jr., Patel A, et al. Treatment with metformin is associated with higher remission rate in diabetic patients with thyroid cancer. J Clin Endocrinol Metab. 2013;98:3269–3279. doi: 10.1210/jc.2012-3799. [DOI] [PubMed] [Google Scholar]
- 38.Cho SW, Yi KH, Han SK, et al. Therapeutic potential of metformin in papillary thyroid cancer in vitro and in vivo. Mol Cell Endocrinol. 2014;393:24–29. doi: 10.1016/j.mce.2014.05.021. [DOI] [PubMed] [Google Scholar]
- 39.Shih SR, Chiu WY, Chang TC, Tseng CH. Diabetes and thyroid cancer risk: literature review. Exp Diabetes Res. 2012;2012:578285. doi: 10.1155/2012/578285. [DOI] [PMC free article] [PubMed] [Google Scholar]