Abstract
N2O emission in the anaerobic ammonium oxidation (anammox) process is of growing concern. In this study, effects of substrate concentrations on N2O emissions were investigated in an anammox reactor. Extremely high N2O emissions of 1.67 % were led by high NH4-N concentrations. Results showed that N2O emissions have a positive correlation with NH4-N concentrations in the anammox reactor. Reducing NH4-N concentrations by recycling pump resulted in decreasing N2O emissions. In addition, further studies were performed to identify a key biological process that is contributed to N2O emissions from the anammox reactor. Based on the results obtained, Nitrosomonas, which can oxidize ammonia to nitrite, was deemed as the main sources of N2O emissions.
Keywords: Substrate concentrations, NH4-N, Anammox, N2O
Background
Nitrogen removal (NR) is an important component of wastewater treatment. Biological nitrogen removal (BNR) is often preferred to other non-biologic processes due to its high efficiency and energy conservation characteristics. Even so, the traditional BNR process has several disadvantages, such as excessive oxygen being consumed during the nitration period and the requirement of additional organic carbon for denitrification. In 1995, the biological anaerobic ammonium oxidation (anammox) reaction was first reported in an up-flow reactor (Mulder et al. 1995). The anammox process operates under anaerobic conditions where nitrite is used as an electron acceptor by anammox bacteria for oxidation of ammonia to nitrogen gas (N2) (Kuenen 2008). By using this new technology, only 50 % of the source ammonium needs to be oxidized to nitrite. This means that the oxygen requirement is reduced to about 75 % of the traditional BNR process. Anammox bacteria are autotrophic microorganisms, therefore, additional carbon input is also eliminated. The anammox process has demonstrated potential over the traditional BNR process, thus considerable research has been carried out from bench-scale to pilot-scale as the technology has proceeded to full-scale applications (Kartal et al. 2010).
N2O is a potent greenhouse gas, whose warming effect is 200–300 times that of CO2 and 4–12 times greater than CH4. Many studies have shown that standard sewage denitrification processes are a critical source of atmospheric N2O (Kampschreur et al. 2009a; Wunderlin et al. 2013; Shaw and Koh 2012). In addition, research has generally shown that N2 is the end product of the anammox process (Jetten et al. 2005); however, high N2O emission from Anammox processes have also been reported (Kampschreur et al. 2009b). Thus, there is an urgent need to investigate the production of N2O in the anammox process and develop methods of controlling and decreasing the greenhouse emissions from the anammox process.
In this study, an anammox reactor was used to study the effects of substrate concentrations on the emission of N2O in an anammox process. The relationship between substrate concentrations and N2O emissions was studied by changing the influent NH4-N concentration. Furthermore, genetic analysis using the 16S rRNA gene was employed to characterize the microbial population of the anammox granules.
Results and discussion
Reactor performance
The removal performance of ammonia and nitrite is shown in Fig. 1a, b. Whenever the effluent NO2-N concentration fell below 10 mg L−1, the nitrogen loading rate (NLR) was increased by adjusting the influent nitrogen concentration while maintaining a constant HRT of 8 h. During start-up period, with the influent NH4-N and NO2-N concentrations set at 73.2 and 88.3 mg L−1, respectively, effluent NH4-N and NO2-N concentrations below 7 and 2 mg L−1 were obtained, with the TN removal rate >80 %. Subsequently, at a constant HRT, the influent NH4-N and NO2-N concentrations were further increased to 100.4 and 124.8 mg L−1, respectively, and effluent NH4-N and NO2-N concentrations initially were a little higher, but both soon decreased to below 8 mg L−1 over a 3-day period. These results indicated that the seed anammox sludge could adapt quickly to changes in NLR. On day 24, the influent NH4-N and NO2-N concentrations were increased to 145.0 and 176.4 mg L−1, respectively, which were the highest levels used in this study. Under these conditions, the effluent NH4-N and NO2-N concentrations were 27.0 and 14.8 mg L−1, respectively. Accordingly, influent NH4-N and NO2-N concentrations were decreased to 120 and 150 mg L−1, respectively, and effluent NH4-N and NO2-N concentrations were then maintained below 18.6 and 9.9 mg L−1. Overall, the reactor could operate with a stable nitrogen removal rate of over 81 %.
Fig. 1.
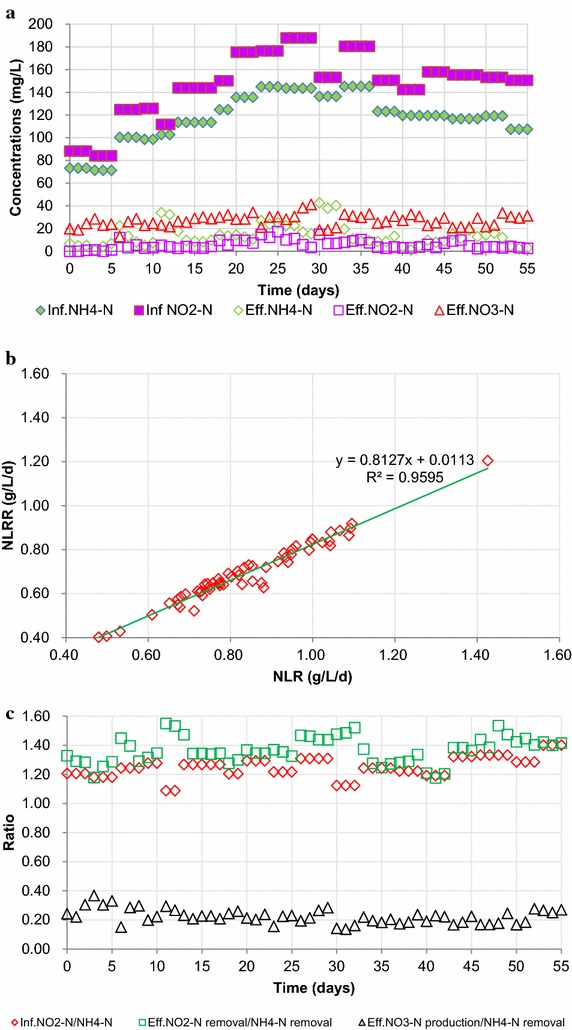
Reactor performance during the study. a Changes in nitrogen concentrations; b changes in NLR and NLRR; c ratios of inf. NO2-N/NH4-N, eff. NO2-N removal/NH4-N removal, and eff. NO3-N production/NH4-N removal. Inf. influent, Eff. effluent
Figure 1c shows the ratios of influent NO2-N/NH4-N, effluent NO2-N removal/NH4-N removal, and effluent NO3-N production/NH4-N removal. At the start-up period, influent NO2-N/NH4-N was set 1.2. Accordingly, effluent NO2-N removal/NH4-N removal, and Effluent NO3-N production/NH4-N removal were 1.3 and 0.3, respectively, which were close to values reported by others (Strous et al. 1998). In order to investigate the effect of influent NH4-N on N2O emission, on day 12 influent NO2-N/NH4-N was changed to 1.09. As a result, effluent NO2-N removal/NH4-N removal increased to 1.55. Conversely, effluent NO3-N production/NH4-N removal decreased to 0.2. The same results were once more affirmed on day 31. Denitrification was considered to be the main reason for the additional NO2-N or NO3-N removal.
N2O emission
N2O emissions over the course of the study are shown in Fig. 2. The conversion ratio of N2O was calculated from the removed nitrogen. On the first day, about 0.6–0.64 % N2O content was detected in the emission gas. On day 2, the influent pipe became blocked, thus only 0.34 % N2O was detected in the emission gas. However, this value increased to 0.54 % over the following 3 days and by day 6 the N2O concentration had reached 0.93 %, accompanied with a high effluent NH4-N residual. On days 11–13 and 30–32, the effluent NH4-N remained at 32–34 and 37–42 mg L−1, respectively. Under these conditions, the N2O emissions were found to be significantly higher than the values associated with low effluent NH4-N concentrations. Over the course of the study, N2O levels were determined to be 0.6–1.0 % in the off-gas.
Fig. 2.
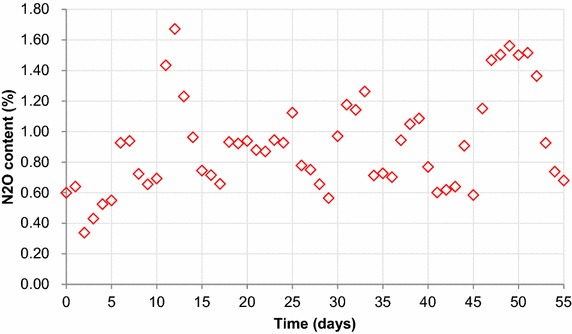
N2O emission during the study
Effects of influent NH4-N, NO2-N, NO3-N and nitrogen removal rate on N2O emission
Effects of inlet NH4-N, NO2-N, NO3-N and nitrogen removal rate on N2O production are shown in Fig. 3. The EGSB reactor used in this study was operated with a high recycle rate. Thus, influent NH4-N, NO2-N and NO3-N were calculated by using the following equation.
Fig. 3.
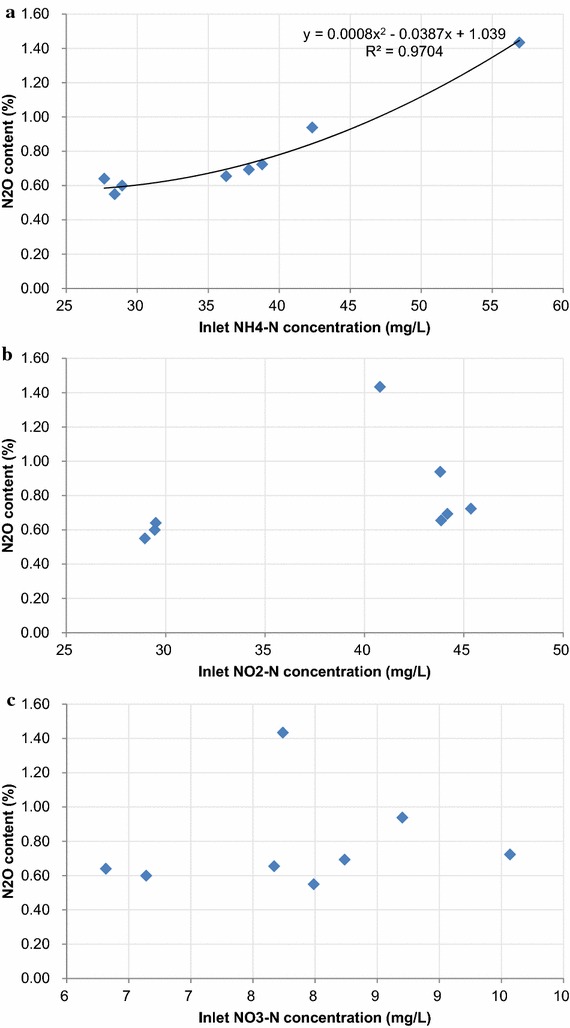
Effect of substrate on N2O emission. a Relation of N2O emission and inlet NH4-N concentration; b relation of N2O emission and inlet NO2-N concentration; c relation of N2O emission and inlet NO3-N concentration
| 1 |
where x is the concentration of inlet NH4-N, NO2-N, NO3-N, a is the influent concentration of NH4-N, NO2-N, NO3-N, n is the ratio of recycle rate to influent flow rate, b is the effluent concentration of NH4-N, NO2-N, NO3-N. According to the equation, inlet NH4-N, NO2-N and NO3-N were determined by two factors: changing influent concentrations or different recycle rate. In order to observe the effects of inlet NH4-N, NO2-N and NO3-N, only the recycle rate was changed while the nitrogen loading rate was set with the same value 0.5 kg m−3 day−1 (Fig. 3a–c). Also, the effects of nitrogen removal rate were evaluated with the same influent nitrogen concentrations.
As shown in Fig. 3a, average N2O content was 0.6 % with an inlet NH4-N concentration of 27–28 mg L−1. Increasing the inlet NH4-N concentration from 36 to 57 mg L−1, N2O increased from 0.65 to 1.4 %. Inlet NH4-N concentration and N2O emission were simulated according to the current data by the following equation with P < 0.03.
| 2 |
where y is the N2O emission, x is the inlet NH4-N concentration. In a word, increasing inlet NH4-N concentration tended to yield a higher N2O concentration.
The influences of inlet NO2-N and NO3-N concentrations were also investigated during the study, though no obvious relationship was found with N2O emissions (Fig. 3b, c).
Bacteria community analysis
Hierarchical cluster analysis was used to identify the differences of three bacterial community structures (Fig. 4). The three samples were sampled from the same reactor, showing obvious similarity of community structure. Nitrosomonas, which oxidizes ammonia to nitrite, was detected in all the three samples. In the anammox reactor, it is difficult to keep dissolved oxygen at zero. Thus, the anammox reactor provides the conditions for the growth of Nitrosomonas. However, Nitrosomonas is known to produce N2O under low oxygen conditions (7). This was supported by the relationship between Nitrosomonas abundance and N2O emission (Fig. 5).
Fig. 4.
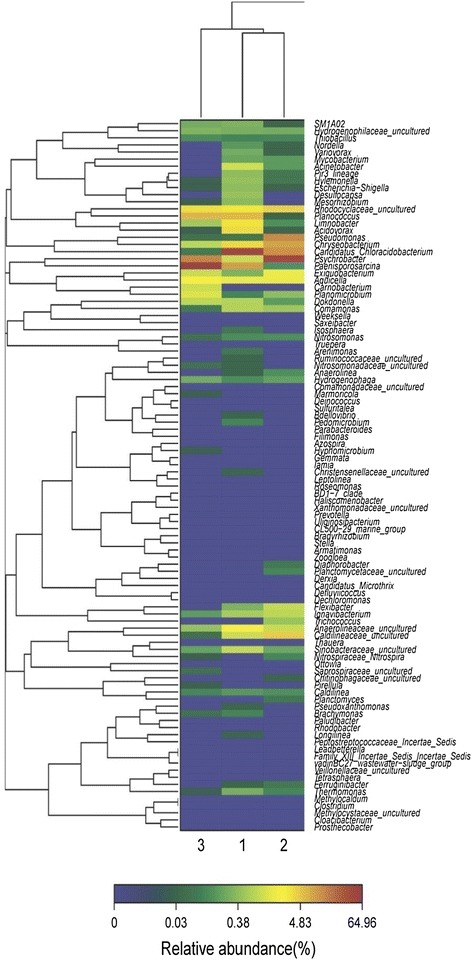
Hierarchical cluster analysis of 1, 2 and 3 bacterial communities. 1, N2O emission 0.6 %, nitrogen removal rate 0.4 kg-N m-3 day−1; 2, day 36, N2O emission 0.7 %, nitrogen removal rate 0.73 kg-N m−3 day−1; 3 day 50, N2O emission 0.18 %, nitrogen removal rate 3 kg-N m-3 day−1. The y-axis is the clustering of the 100 most abundant OTUs (3 % distance) in reads. The OTUs were ordered by genus. Sample communities were clustered based on complete linkage method. The color intensity of scale indicates relative abundance of each OUT read. Relative abundance was defined as the number of sequences affiliated with that OTU divided by the total number of sequences per sample
Fig. 5.
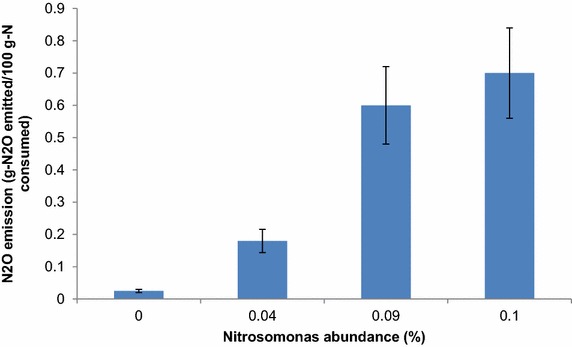
Relationship between Nitrosomonas abundance and N2O emission
In this study, N2O emissions were found to be higher than the reported values. Okabe et al. reported that a N2O emission of only 0.05–0.23 % was detected with a nitrogen removal rate of 7.5–15 kg N m−3 day−1. However, the highest N2O concentration of 1.67 % was quantified in this study, which is compared with other the results in Table 1. From Table 1, increasing nitrogen loading rates showed positive effect on decreasing N2O concentrations. Longfei et al. (2015) also reported that the increase of nitrogen loading rate could reduce N2O emission and they found it is more seasonable if compare the value of N2O production per gram N removal (N2O emission/nitrogen removal rate). Although higher nitrogen removal rate helps to reduce the footprint of the anammox system, it was difficult to maintain the stable running under high nitrogen removal rate due to floatation of anammox granules and pipe clogging. On the other hand, Kampschreur et al. also found high N2O concentrations with 0.6 % in one full-scale anammox reactor. Thus, increasing NLR is effective in reducing N2O emission, but N2O emissions are inevitable in an anammox reactor. Reducing N2O emission is still a concern for anammox applications.
Table 1.
Comparison of N2O emission for different nitrogen loading rate in wastewater treatment
| Reactor type | Reactor volume (L) | Removal rate (kg m−3 day−1) | N2O emission (%) | References |
|---|---|---|---|---|
| Granules-based | 70,000 | 7.14 | 0.6 | Kampschreur et al. |
| Granules-based | 0.15 | 7.5–15 | 0.05–0.23 | Okabe et al. |
| GAC-Granules-based | 10 | 0.8 | 0.6–1.5 | Present work |
NO2-N and NO3-N are the substrates for denitrifiers. It is supposed that N2O is produced as an intermediate of incomplete heterotrophic denitrification due to low COD/N ratio (Okabe et al. 2011). However, no relationship was found between NO2-N, NO3-N and N2O emission in this study. Thus, it is difficult to explain the increasing N2O emission during this study.
Okabe et al. indicated that denitrification by putative heterotrophic denitrifiers present in the inner part of the granule was considered the most probable cause of N2O emission from the anammox reactor. In this study, inlet NH4-N showed clear relation to N2O emission (Fig. 3). Also, Nitrosomonas abundance increased with N2O emission (Fig. 5). As shown in Fig. 5, only 0.025 g-N2O emitted/100 g-N consumed was observed without Nitrosomonas. And the denitrifires were presumed to contribute the above N2O emission. After that, Nitrosomonas abundance increased with N2O emission. At last, 0.7 g-N2O emitted/100 g-N consumed was observed, which was almost 30 times of the value without Nitrosomonas. The results got in this study showed that Nitrosomonas was the main cause of N2O emission. Nitrosomonas competed with anammox bacteria for NH4-N. Because anammox bacteria could not oxidize NH4-N without NO2-N, therefore, supplying enough NH4-N is favorable for Nitrosomonas. While oxygen was always insufficient for NH4-N oxidation in one anammox reactor, thus, N2O produced due to NH2OH oxidation (Wunderlin et al. 2013). The results of this study is partly consistent with the literature showing that NH2OH oxidation by AOB was considered the most probable cause of N2O production (0.6 % of the nitrogen load) in a full-scale Anammox reactor treating sludge reject water (Kampschreur et al. 2009b). Beyond that, this study could not exclude the possibility of N2O emission by denitrifiers. Further study was needed to quantify N2O emission contributed by denitrifiers and Nitrosomonas using real wastewater.
Conclusions
One anammox reactor was used to investigate the effect of substrate concentrations on N2O emissions. The monitoring N2O concentrations were determined as 0.6–1.0 % in the emission gas during this study. Increasing inlet NH4-N concentration from 36 to 57 mg L−1, N2O increased from 0.65 to 1.4 %. Reduced inlet NH4-N concentrations induced N2O emission. The results got in this study suggested that in addition to denitrifiers, Nitrosomonas was also a significant cause of N2O emissions.
Methods
Anammox reactor and substrate
The reactor had an inner diameter of 14 cm with a total liquid volume of 10 L including a reaction zone of 8 L and a settling zone of 2 L. The reactor was made of acrylic resin and had a water jacket for temperature control. Sampling ports were located at heights of 3, 17, 20 and 25 cm above the reactor bottom. Part of the effluent was collected in a 5-L container (with mixer and heater) for use as recycle (Fig. 6). The pH was adjusted by an online pH controller (TPH/T-10, Tengine, China) using 0.5 mol L−1 H2SO4 (Yue et al. 2015). The reactor was enclosed in a black-vinyl sheet to prevent growth of photosynthetic bacteria and algae.
Fig. 6.
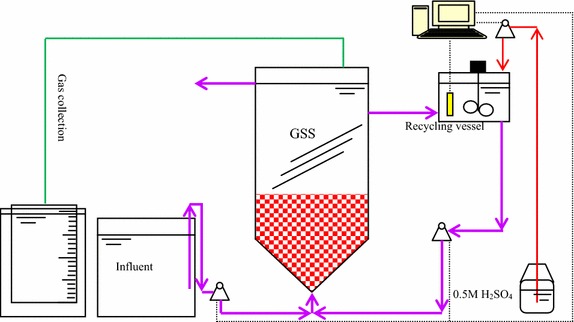
Schematic view of the Anammox reactor system. GSS gas solid separator
The reactor was operated in up-flow mode, with influent introduced at the bottom using a peristaltic pump (BT100-2J, LongerPump, China). A recirculation pump (BT600-2J, LongerPump, China) was used to dilute the influent (Fig. 6) with the treated wastewater in the 5-L recycle container.
The anammox seed sludge used in the reactor was taken from a pilot-scale anammox reactor (unpublished). The seed sludge was granule activated carbon (GAC)-based granules with settling velocity over 150 m h−1 (Wenjie et al. 2015). The initial seeding concentration (mass of mixed liquor suspended solids (MLSS) per liter) was set at 4 g MLSS L−1.
The reactor was fed with synthetic wastewater with a nitrite to ammonium molar ratio of 1.0–1.2. The detailed composition of the influent is shown in Table 2. The influent storage tank was flushed with nitrogen gas to maintain DO under 0.5 mg L−1, and Na2SO3 was added to a concentration of 40 mg L−1 (shown to be harmless to Anammox bacteria, Wenjie et al. 2014) to keep the DO level close to zero.
Table 2.
Composition of synthetic wastewater
| Composition | Concentration (mg L−1) |
|---|---|
| (NH4)2SO4, NaNO2 (as mg N L−1) | 200–1000 |
| KHCO3 | 1000 |
| KH2PO4 | 20–1300 |
| CaCl2·2H2O | 100 |
| MgSO4·7H2O | 200 |
| Na2S2O3 | 24.81 |
| Trace element solution 1 (g L−1): FeSO4·7H2O 10, C10H14N2Na2O3 5.6 | 1 mL L−1 |
| Trace element solution 2 (g L−1): MnCl2·4H2O 0.352, CoCl2·6H2O 0.096, NiCl2·6H2O 0.08, CuSO4·5H2O 0.1, ZnSO4·7H2O 0.172, NaSeO4·10H2O 0.105, NaMoO4·2H2O 0.11, C10H14N2Na2O3 5.0 | 1 mL L−1 |
Analytical methods
NO2-N and NH4-N were measured by the colorimetric method according to Standard Methods (APHA 1995). Total nitrogen (TN) was determined by the persulfate method using the UV spectrophotometric screening method (APHA 1995) for quantification of TN as NO3-N (the oxidization product of the persulfate digestion). NO3-N (of the original sample) was determined by calculation of the difference of TN and the sum of NO2-N and NH4-N. The pH was measured by using a pH meter (9010, Jenco, USA), and dissolved oxygen (DO) was measured by using a DO meter (6010, Jenco, USA).
Gas collection and analysis
Gas was collected through the GSS (Fig. 1) and the volume was measured using an inverted cylinder containing tap water with the pH lowered to 3 using 1-N H2SO4. Gas analyses were performed by using a GC-112A gas chromatograph (INESA INSTRUMENT, China).
DNA extraction and high-throughput 16 s rRNA gene pyrosequencing
After 139 days of operation, the particle based granules were taken out from the Anammox reactor. A granular sludge sample was first ground with a pestle under liquid nitrogen. Meta-genomic DNA was extracted using the E.Z.N.A. Soil DNA Kit (OMEGA Biotec. D5625-01, USA) according to the manufacturer’s instructions. Amplification of the 16S rRNA gene was performed using primers 27F (forward primer: 5′-AGAGTTTGATCCTGGCTCAG-3′) and 533R (reverse primer: 5′-TTACCGCGGCTGCTGGCAC-3′). PCR was carried out according to the following thermocycling parameters: 120 s initial denaturation at 95 °C, 25 cycles of 30 s at 95 °C, 30 s at 55 °C, 30 s at 72 °C, 5 min final elongation at 72 °C, 10 °C until halted by user. Duplicate PCR products were pooled and purified using the AXYGEN gel extraction kit (Axygen, USA) (Feng et al. 2012).
Pyrosequencing was carried out by a 454 Life Sciences Genome Sequencer FLX Titanium instrument (Roche). Sequences were clustered into operational taxonomic units (OTUs) by setting a 0.03 distance limit (equivalent to 97 % similarity) using the MOTHUR program.
Authors’ contributions
Yue Jin carried out the molecular genetic studies, participated in the sequence alignment and drafted the manuscript. Dunqiu Wang participated in the design of the study and performed the statistical analysis. Wenjie Zhang conceived of the study, and participated in its design and coordination and helped to draft the manuscript. All authors read and approved the final manuscript.
Acknowledgements
This research was supported by the National Natural Science Foundation of China (No. 51108108), Guangxi Natural Science Foundation (2013GXNSFCA019018; 2014 GXNSFBA118265), the project of high level innovation team and outstanding scholar in Guangxi colleges and universities.
Competing interests
The author(s) declare that they have no competing interests.
Contributor Information
Yue Jin, Email: 2010053@glut.edu.cn.
Dunqiu Wang, Email: 103375916@qq.com.
Wenjie Zhang, Phone: +86 773 2217626, Email: zhangwj_zhangwj@hotmail.com.
References
- APHA . Standard method for the examination of water and wastewater. 19. Washington, D.C.: American Public Health Association; 1995. [Google Scholar]
- Feng Q, Wang Y, Wang T, Zheng H, Chu L, Zhang C, Chen H, Kong X, Xing X. Effects of packing rates of cubic-shaped polyurethane foam carriers on the microbial community and the removal of organics and nitrogen in moving bed biofilm reactors. Bioresour Technol. 2012;117:201–207. doi: 10.1016/j.biortech.2012.04.076. [DOI] [PubMed] [Google Scholar]
- Jetten MSM, Cirpus I, Kartal B, van Niftrik LAMP, van de Pas-Schoonen KT, Sliekers O, Haaijer S, van der Star W, Schmid M, van de Vossenberg J, Schmidt I, Harhangi H, van Loosdrecht M, Gijs Kuenen J, Op den Camp H, Strous M. 1994–2004: 10 years of research on the anaerobic oxidation of ammonium. Biochem Soc Trans. 2005;33:119–123. doi: 10.1042/BST0330119. [DOI] [PubMed] [Google Scholar]
- Kampschreur MJ, Temmink H, Kleerebezem R, Jetten MS, van Loosdrecht M. Nitrous oxide emission during wastewater treatment. Water Res. 2009;43:4093–4103. doi: 10.1016/j.watres.2009.03.001. [DOI] [PubMed] [Google Scholar]
- Kampschreur MJ, Poldermans R, Kleerebezem R, van der Star WRL, Haarhuis R, Abma WR, Jetten MSM, van Loosdrecht MCM. Emission of nitrous oxide and nitric oxide from a full-scale single-stage nitritation–anammox reactor. Water Sci Technol. 2009;60:3211–3217. doi: 10.2166/wst.2009.608. [DOI] [PubMed] [Google Scholar]
- Kartal B, Kuenen JG, Van Loosdrecht MCM. Sewage treatment with anammox. Science. 2010;328:702–703. doi: 10.1126/science.1185941. [DOI] [PubMed] [Google Scholar]
- Kuenen JG. Anammox bacteria: from discovery to application. Nat Rev Microbiol. 2008;6:320–326. doi: 10.1038/nrmicro1857. [DOI] [PubMed] [Google Scholar]
- Longfei R, Shuang L, Huu HN, Wenshan G, Shouqing N, Cui L, Yuankun Z, Daisuke H. Enhancement of anammox performance in a novel non-woven fabric membrane bioreactor (nMBR) RSC Adv. 2015;5:86875–86884. doi: 10.1039/C5RA16802C. [DOI] [Google Scholar]
- Mulder A, Van de Graaf AA, Robertson LA, Kuenen JG. Anaerobic ammonium oxidation discovered in a denitrifying fluidized bed reactor. FEMS Microbiol Ecol. 1995;16:177–184. doi: 10.1111/j.1574-6941.1995.tb00281.x. [DOI] [Google Scholar]
- Okabe S, Oshiki M, Takahashi Y, Satoh H. N2O emission from a partial nitrification–anammox process and identification of a key biological process of N2O emission from anammox granules. Water Res. 2011;45:6461–6470. doi: 10.1016/j.watres.2011.09.040. [DOI] [PubMed] [Google Scholar]
- Shaw AR, Koh SH. Gaseous emissions from wastewater facilities. Water Environ Res. 2012;84:1325–1331. doi: 10.2175/106143007X1340727513. [DOI] [PubMed] [Google Scholar]
- Strous M, Heijnen JJ, Kuenen JG, Jetten MSM. The sequencing batch reactor as a powerful tool for the study of slowly growing anaerobic ammonium-oxidizing microorganisms. Microbiol Biotechnol. 1998;50:589–596. doi: 10.1007/s002530051340. [DOI] [Google Scholar]
- Wenjie Z, Yuanyuan Z, Liang L, Xuehong Z, Yue J. Fast start-up of expanded granular sludge bed (EGSB) reactor using stored Anammox sludge. Water Sci Technol. 2014;69:1469–1474. doi: 10.2166/wst.2014.030. [DOI] [PubMed] [Google Scholar]
- Wenjie Z, Huaqin W, Joseph DR, Yue J. Granular activated carbon as nucleus for formation of Anammox granules in an expanded granular-sludge-bed reactor. Global NEST J. 2015;17:508–514. [Google Scholar]
- Wunderlin P, Siegrist H, Joss A. Online N2O measurement: the next standard for controlling biological ammonia oxidation? Environ Sci Technol. 2013;47:9567–9568. doi: 10.1021/es402971p. [DOI] [PubMed] [Google Scholar]
- Yue J, Dunqiu W, Wenjie Z. Use of bamboo charcoal reduced the cultivated anammox seed sludge dosage during the start-up period. Desalin Water Treat. 2015 [Google Scholar]


