Abstract
Background:
Waist circumference (WC) is an accurate and simple measure of abdominal obesity as compared to waist–hip ratio (WHR). The aim of this study was to determine the correlation between body mass index (BMI) with WC and WHR and suggest cutoff points for WC among Rural Malaysian adults.
Methods:
A cross-sectional study was conducted among 669 respondents from three villages in Tanjung Karang, located in the district of Kuala Selangor. Data collection was carried out by guided questionnaires and anthropometric measures.
Results:
The prevalence of abdominal obesity for BMI was almost similar for both gender across Caucasian and Asian BMI cutoff points. Based on Caucasian cutoff points, the prevalence of abdominal obesity for WC was 23.8% (male) and 66.4% (female) while for WHR was 6.2% (male) and 54.2% (female). Asian cutoff points gave higher prevalence of abdominal obesity compared to that of WC among male respondents and WHR for both genders. WC showed strong and positive correlation with BMI compared to WHR (in male WC r = 0.78, WHR r = 0.24 and in female WC r = 0.72, WHR r = 0.19; P < 0.001). Receiver operating characteristic curve analysis suggested WC cutoff points of 92.5 cm in men and 85.5 cm in women is the optimal number for detection of abdominal obesity.
Conclusions:
WC is the best indicator as compared with WHR for abdominal obesity for Malaysian adults.
Keywords: Abdominal obesity, adults, body mass index, waist circumference, waist-to-hip ratio
INTRODUCTION
There are various terms of obesity loosely used such as abdominal obesity, abdominal adiposity, body fat percentage, and predictors for obesity. Body mass index (BMI) is the most commonly used parameter to measure abdominal obesity for determining whether someone may be defined as obese, overweight, or normal weight. BMI is the person's weight in kilograms divided by the square of the height in meters. Many epidemiological studies have demonstrated that different anthropometric measures for abdominal obesity such as BMI, waist circumference (WC), and waist-hip ratio (WHR) are strong and consistent predictors for noncommunicable diseases such as type 2 diabetes mellitus[1] and cardiovascular disease (CVD).[2]
World Health Organization (WHO) guidelines state that alternative measures that reflect abdominal obesity such as WC, WHR, and waist-to-height ratio (WHtR) have been found to be superior to BMI.[3] A study among Chinese population demonstrated that while BMI and WC were found to be the important indices of obesity, WC was found to be the best measurement of obesity whereas WHR could be used as an alternative indicator for obesity.[4] Similarly, WC was also found to be a simple and more accurate predictor of type 2 diabetes mellitus than other indices such as BMI and WHR.[5]
WHR was suggested as better anthropometric measure for estimating the risk of type 2 diabetes mellitus, and the optimal cutoff values of 0.89 for men and 0.82 for women was set for Asian population such as in the Taiwanese population.[6] Furthermore, another study done in Iran by Hajian-Tilaki and Heidari[7] concluded that WC and WHtR exhibited are slightly better performance than BMI for diabetes in both sexes, particularly among women. In addition, hypertensive patients had a significantly higher WHR (>0.9) as well as a significantly higher BMI (>25 kg/m²) compared to the normotensive one.[8]
WC is an important measure of abdominal obesity compared to WHR, which can be low in some obese people because of high hip circumference (in denominator). Sometimes it is difficult in clinical setting to obtain an accurate measurement of hip circumference as compared to WC. In another study, WHR managed to identify more women in the underweight and normal groups as abdominally obese than did WC. A high WHR in a nonobese woman would also suggest that the hip circumference was low.[9] Although many research works have been done worldwide on various aspects of anthropometric measurement to predict the risk of obesity-related diseases, the correlation of BMI with WC and WHR has seldom been addressed among Rural Malaysian population.
The aim of this study was to determine the correlation between BMI with WC and WHR and suggest cutoff points for WC among respondents from three villages in Tanjung Karang, Selangor, Malaysia.
METHODS
Study design and participants
A cross-sectional study was conducted among Malaysian population in three villages in Tanjung Karang, located in the district of Kuala Selangor about 15 km away from the town of Kuala Selangor, Malaysia. Malaysian citizens aged 18 years and above were recruited to participate in the study, which was carried out from June to September 2011. The simple random sampling procedure was used to choose the respondents from the name list of villagers. Those who refuse to participate and pregnant women were excluded. The total sample size of 669 was calculated[10] with mean difference and combine the standard deviation (SD) of WC (n = 360, mean: 89.90 [10.78] for male and WC (n = 412, mean: 88.02 [12.23] for female.
Study tools
Data collection was carried out by guided questionnaires consist of two sections; section A for baseline characteristic and B for anthropometric measurements.
Weight was measured to the nearest 0.1 kg using electronic weight scale (model 770: Seca, Germany) with the respondents lightly clothed height was measured to the nearest 0.5 cm with measuring tape while the respondent stood still without shoes. BMI was calculating by the formula, BMI = weight (kg)/height (m²). The respondents were divided into four categories based on their BMI according to the BMI cutoffs points (Caucasian) as follows, underweight (BMI <18.5), normal (18.5–24.9), preobese or overweight (25–29.9), and obese class (BMI ≥30) (WHO 2008) and BMI cutoff points (Asian) as follows; BMI <18.5 kg/m² (lean or underweight), between 18.5 and 22.9 kg/m² (normal), between 23 and 27.49 kg/m² (overweight) and 27.5 kg/m² or above as (obese).[11]
WC was measured at the end of several consecutive natural breaths, at the level parallel to the floor, midpoint between the top of the iliac crest and the lower margin of the last palpable rib in midaxillary line.[3] The data were analyzed using cutoffs points for Caucasians (94 cm in men and 80 cm in women) and cutoffs points for Asians (90 cm in men and 80 cm in women).[3,12]
WHR was calculated by dividing WC (in cm) by hip circumference (cm). Hip circumference was measured at a level parallel to floor, at the largest circumference of the buttocks. The cutoffs points (Caucasian) of WHR used (>1 in men and >0.85 in women)[13] and cutoffs points for Asians used (0.95 in men and 0.80 in women)[14] denote abdominal obesity. Average of two readings was used for analysis.
Research ethics
The study was approved by the Medical Faculty, Universiti Kebangsaan Malaysia. Permission to enter the villages was obtained from the head villages and the respondents provided with informed consent. All co-researchers were briefed and trained before data collection.
Statistical analysis
Data were analyzed using SPSS version 19 (IBM SPSS Statistics for Windows, Armonk, NY: IBM Corp) for descriptive and correlation analysis. Descriptive analysis used for continuous variables was mean and SD while categorical data were presented as frequency and percentage. Pearson's correlation (r) was conducted to determine the correlation of BMI with WC and WHR. Receiver operating characteristic (ROC) curve was used to show if the optimal cutoff points of WC for this particular population is similar or different with the standard cutoff points for Caucasian. Statistical significance was set at P < 0.05.
RESULTS
Table 1 shows that out of 669 respondents, 273 (40.8%) were male and 396 (59.2%) were female. Female had higher mean of BMI compared to male respondents while males had higher mean of WC and WHR compared to female respondents. BMI cutoff points for Caucasian identified lower total prevalence of overweight and obese compared to cutoff points for Asian (44.2% and 60.0%, respectively) [Table 2]. Among the male respondents, Caucasian BMI cutoff points showed lower prevalence of overweight and obese respondents compared to Asian cutoff points. Nevertheless, Caucasian BMI cutoff points showed higher prevalence of overweight respondents compared to Asian cutoff points among the female respondents.
Table 1.
Abdominal obesity based on 3 indicators among Malaysian adults (2011) (n=669)
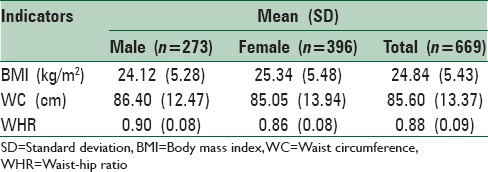
Table 2.
Prevalence of abdominal obesity across body mass index class based on Caucasian and Asian cutoff points among Malaysian adults (2011) (n=667)

Table 3 indicates that, based on Caucasian cutoff points for WC and WHR, the male respondents had the prevalence of abdominal obesity of 23.8% and 6.2%, respectively. Whereas. Asian cutoff points for WC and WHR identified higher prevalence of abdominal obesity among the male respondents (37.4% and 26.4%, respectively). Both cutoff points identified similar prevalence of abdominal obesity for WC among the female respondents. However, the Asian cutoff points for WHR showed a higher prevalence of abdominal obesity among female respondents.
Table 3.
Prevalence of abdominal obesity according to waist circumference and waist-hip ratio across gender among Malaysian adults (2011) (n=669)
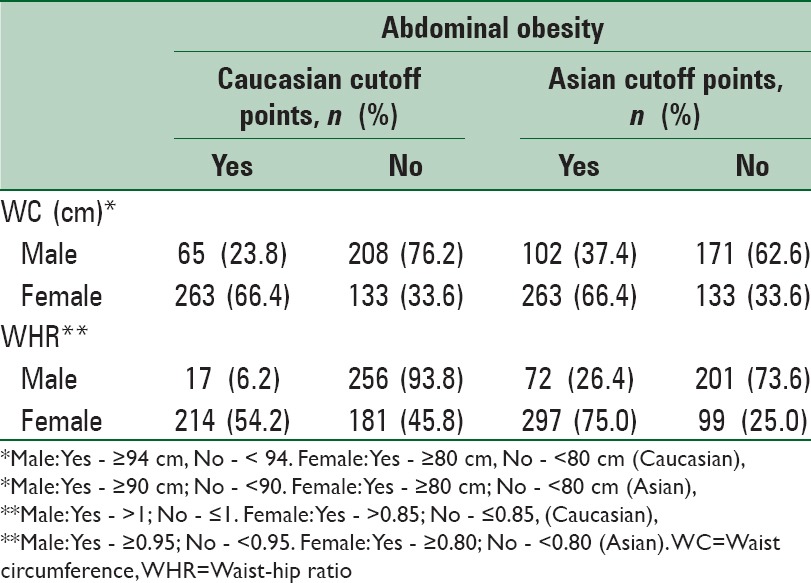
Table 4 illustrates the Pearson correlation between BMI with WC and WHR. WC was moderately strong and positive correlated with BMI (r = 0.727, P < 0.001) while WHR was poorly and positive correlated with BMI (r = 0.176, P < 0.001). Results also indicated that WC was better correlated with BMI as compared to WHR for both male and female. Figures 1 and 2 indicate the ROC curve for both male and female, the cutoff point of WC among male at optimal sensitivity (87.9%) and specificity (82.9%) was 92.5 cm (area under the curve [AUC] = 0.93; 95% confidence interval [CI] = 0.87, 0.99), which is near to Caucasian cutoff point, and among female the cutoff point at optimal sensitivity (94.0%) and specificity (55.4%) was 85.5 cm (AUC = 0.87, 95% CI = 0.83,0.91), which is higher than the Caucasian and Asian cutoff points.
Table 4.
Pearson correlation coefficients between body mass index with waist circumference and waist-hip ratio across gender among Malaysian adults (2011)
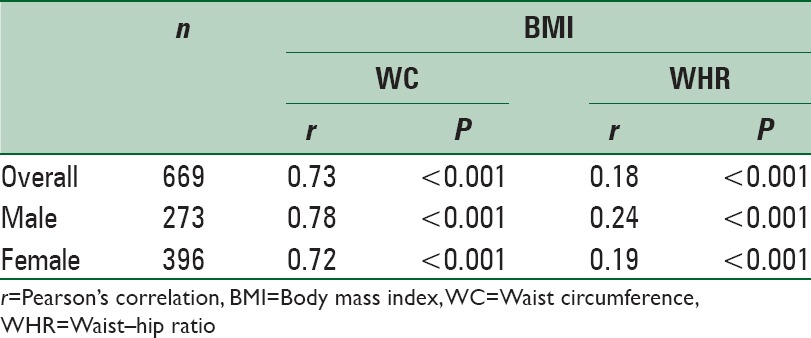
Figure 1.
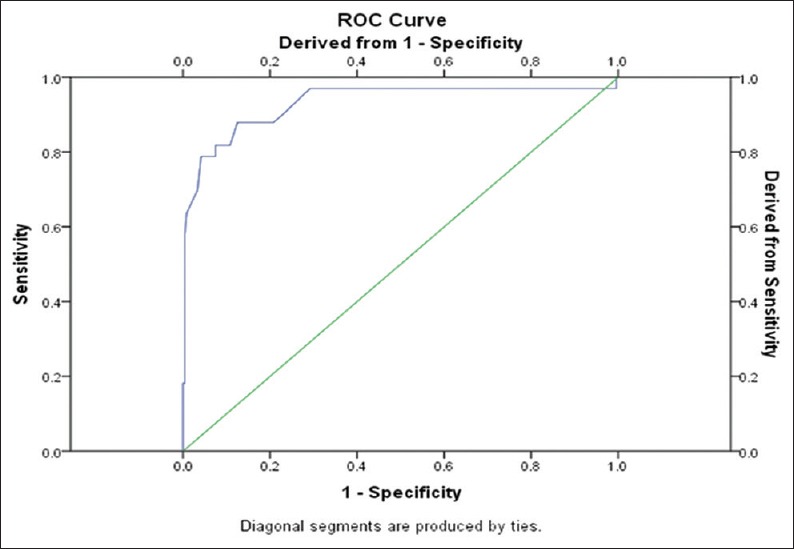
Receiver operating characteristic for waist circumference among male respondents
Figure 2.
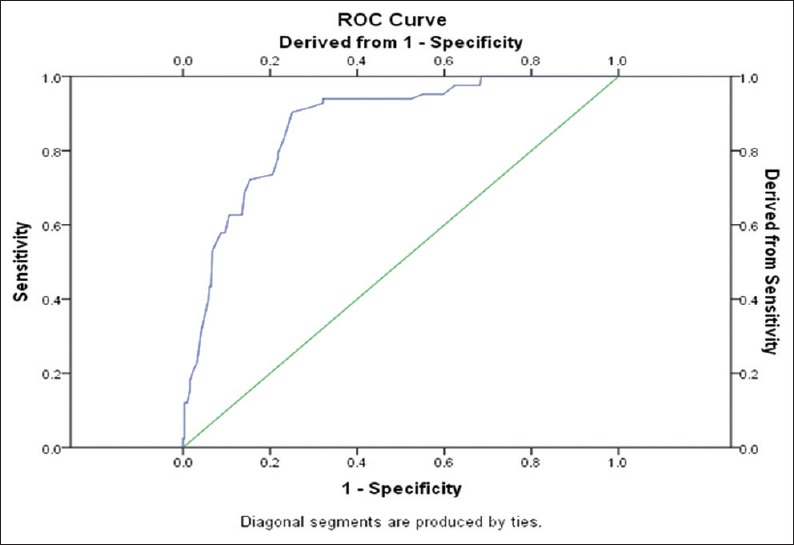
Receiver operating characteristic for waist circumference among female respondents
DISCUSSION
This study showed that the BMI cutoff points for Asian gave higher prevalence of overweight and obese among the respondents compared to BMI cutoff points for Caucasian. However, WC cutoff points for Asian gave a higher prevalence of abdominal obesity among male respondents compared to WC cutoff points for Caucasian. This finding supported the WHO monograph on obesity which recommended even lower cutoff for BMI and WC for Asians.[11]
Studies conducted locally using BMI and WC cutoff points for Caucasian showed that prevalence of overweight and obesity among Malaysian adults using BMI were 29.1% and 14.2% for males and females respectively in the Third National Health and Morbidity Survey in 2006.[15] Meanwhile overall national prevalence of abdominal obesity using WC was 17.4% among adult Malaysian with women at higher risk (26.0%) compared to men (7.2%).[16] A study among Indian found that the prevalence of abdominal obesity using WC were 46% in men and 64% in women and using WHR were about 12% in men and 68% in women (using the lowest cutoff points recommended for Asians).[9]
In general, the result of this study showed that WC has a strong positive correlation with BMI as compared to WHR, which is congruent with findings from other studies. BMI and WC are more useful than WHR for predicting two or more nonadipose components of metabolic syndrome[17] and WC was a stronger indicator of the risk of diabetes than BMI.[18] BMI and WC showed strong positive correlation (r = 0.68–0.73; P < 0.0001) with body fat percentage in both sexes, but the correlation was weaker for WHR (r = 0.30-0.41; P < 0.0001).[19] WC was also found to correlate positively and significantly with BMI compared to WHR in diabetic females and males.[20]
ROC analysis in our study indicated that WC had the best sum of sensitivity and specificity compared to WHR. This is consistent with a study among Malaysian population which found WC is the better indicator for predicting CVD risk factors than BMI and the optimal cutoffs for WC were 83–92 cm in men and 83–88 cm in women.[21] A study among Chinese population stated that WC is the best predictor of hyperglycemia and the optimal cutoffs for WC was 85 for men 82 for women.[22]
In our study, the prevalence of abdominal obesity using WC was higher than using WHR. The WHR for both standard and Asian cutoffs detect more underweight and normal respondents as being abdominal obese may be attributed to the small hip circumference (in dominator) leading to high WHR. This is consistent with the finding among the Indian population.[9] The limitations of our study were due to primarily the study among population not differentiated by socio-demographic characteristics such as age or ethnicity. Secondly, due to multiple missing data which prevent further analysis. However, the large sample size in this study make our results useful as a baseline data for future research, especially focusing on waist circumference as a screening tool for abdominal obesity.
CONCLUSIONS
The WC shows strong and positive correlation with BMI as compared to WHR. Using both Caucasian and Asian cutoff points, the prevalence of abdominal obesity using WC were found to be higher than in using WHR, as the WHR for both Caucasian and Asian cutoffs detect more underweight and normal respondents as being abdominally obese. The optimal cutoff points of WC for detecting abdominal obesity in this adult Malaysian population were somewhere in between the Caucasian and Asian cutoff points 92.5 for males. The optimal cutoff points for WC among female was found to be higher than both Caucasian and Asian cutoff points.
Financial support and sponsorship
Nil.
Conflicts of interest
There are no conflicts of interest.
Acknowledgements
We would like to thank the village heads and respondents of Kampung Api-Api and Kampung Kuantan, Kuala Selangor, Selangor for their kind and unlimited cooperation and support. We also would like to acknowledge the 3rd Year Medical Students (2011/2012) of Faculty of Medicine, UniversitiKebangsaan Malaysia Medical Centre for their involvement during the initial data collection of the study.
REFERENCES
- 1.Vazquez G, Duval S, Jacobs DR, Jr, Silventoinen K. Comparison of body mass index, waist circumference, and waist/hip ratio in predicting incident diabetes: A meta-analysis. Epidemiol Rev. 2007;29:115–28. doi: 10.1093/epirev/mxm008. [DOI] [PubMed] [Google Scholar]
- 2.Paniagua L, Lohsoonthorn V, Lertmaharit, Jiamjarasrangsi W, Williams MA. Comparison of waist circumference, body mass index, percent body fat and other measure of adiposity in identifying cardiovascular disease risks among Thai adults. Obes Res Clin Pract. 2008;2:215–23. doi: 10.1016/j.orcp.2008.05.003. [DOI] [PMC free article] [PubMed] [Google Scholar]
- 3.Geneva: World Health Organization; 2008. World Health Organization (WHO). Waist Circumference and Waist-Hip Ratio. Report of WHO Expert Consultation. [Google Scholar]
- 4.Yanga F, Lv JH, Lei SF, Chena XD. Receiver-operating characteristic analyses of body mass index, waist circumference and waist-to-hip ratio for obesity: Screening in young adults in central south of China. Clin Nut. 2006;25:1030–9. doi: 10.1016/j.clnu.2006.04.009. [DOI] [PubMed] [Google Scholar]
- 5.Mamtani MR, Kulkarni HR. Predictive performance of anthropometric indexes of central obesity for the risk of type 2 diabetes. Arch Med Res. 2005;36:581–9. doi: 10.1016/j.arcmed.2005.03.049. [DOI] [PubMed] [Google Scholar]
- 6.Cheng CH, Ho CC, Yang CF, Huang YC, Lai CH, Liaw YP. Waist-to-hip ratio is a better anthropometric index than body mass index for predicting the risk of type 2 diabetes in Taiwanese population. Nutr Res. 2010;30:585–93. doi: 10.1016/j.nutres.2010.08.007. [DOI] [PubMed] [Google Scholar]
- 7.Hajian-Tilaki K, Heidari B. Is waist circumference a better predictor of diabetes than body mass index or waist-to-height ratio in Iranian adults? Int J Prev Med. 2015;6:5. doi: 10.4103/2008-7802.151434. [DOI] [PMC free article] [PubMed] [Google Scholar]
- 8.Sanya AO, Ogwum Ike OO, Ige AP, Ayanniyi OA. Relationship of waist-hip ratio and body mass index to blood pressure of individuals in Ibadan North Local Government. AJPARS. 2009;1:7–11. [Google Scholar]
- 9.Kurpad SS, Tandon H, Srinivasan K, Kurpad SS, Tandon H, Srinivasan K. Waist circumference correlates better with body mass index than waist-to-hip ratio in Asian Indians. Natl Med J India. 16:189–92. [PubMed] [Google Scholar]
- 10.Snedecor GW, Cochran WG. 8th ed. Ames: Iowa State Press; 1989. Statistical Methods. [Google Scholar]
- 11.WHO Expert Consultation. Appropriate body-mass index for Asian populations and its implications for policy and intervention strategies. Lancet. 2004;363:157–63. doi: 10.1016/S0140-6736(03)15268-3. [DOI] [PubMed] [Google Scholar]
- 12.Zimmet PZ, Alberti KG. Introduction: Globalization and the non-communicable disease epidemic. Obesity (Silver Spring) 2006;14:1–3. doi: 10.1038/oby.2006.1. [DOI] [PubMed] [Google Scholar]
- 13.World Health Organization (WHO) The Problem of Obesity. 2000. [Last accessed on 2015 Aug 15]. Available from: http://www.whqlibdoc.who.int/trs/WHO_TRS_894_(part1).pdf .
- 14.Lean ME, Han TS, Morrison CE. Waist circumference as a measure for indicating need for weight management. BMJ. 1995;311:158–61. doi: 10.1136/bmj.311.6998.158. [DOI] [PMC free article] [PubMed] [Google Scholar]
- 15.Vol. 1. Malaysia: Ministry of Health (MOH); 2006. Ministry of Health (MOH). The Third National health and Morbidity Survey (NHMS III) [Google Scholar]
- 16.Kee CC, Jr, Jamaiyah H, Noor Safiza MN, Khor GL, Suzana S, Jamalludin AR, et al. Abdominal obesity in Malaysian adults: National health and morbidity survey III (NHMS III, 2006) Malays J Nutr. 2008;14:125–35. [PubMed] [Google Scholar]
- 17.Wang F, Wu S, Song Y, Tang X, Marshall R, Liang M, et al. Waist circumference, body mass index and waist to hip ratio for prediction of the metabolic syndrome in Chinese. Nutr Metab Cardiovasc Dis. 2009;19:542–7. doi: 10.1016/j.numecd.2008.11.006. [DOI] [PubMed] [Google Scholar]
- 18.Humayun A, Shah AS. Comparison of body mass index and waist circumference in predicting incident diabetes. Pak J Physiol. 2010;6:47–9. [Google Scholar]
- 19.Neovius M, Linné Y, Rossner S. BMI, waist-circumference and waist-hip-ratio as diagnostic tests for fatness in adolescents. Int J Obes (Lond) 2005;29:163–9. doi: 10.1038/sj.ijo.0802867. [DOI] [PubMed] [Google Scholar]
- 20.Marjani A. Waist circumference, body mass index, hip circumference and waist-to-hip ratio in type 2 diabetes patients in Gorgan, Iran. J Clin diag Res. 2011;5:201–5. [Google Scholar]
- 21.Zaher ZM, Zambari R, Pheng CS, Muruga V, Ng B, Appannah G, et al. Optimal cut-off levels to define obesity: Body mass index and waist circumference, and their relationship to cardiovascular disease, dyslipidaemia, hypertension and diabetes in Malaysia. Asia Pac J Clin Nutr. 2009;18:209–16. [PubMed] [Google Scholar]
- 22.Xu F, Wang YF, Lu L, Liang Y, Wang Z, Hong X, et al. Comparison of anthropometric indices of obesity in predicting subsequent risk of hyperglycemia among Chinese men and women in Mainland China. Asia Pac J Clin Nutr. 2010;19:586–93. [PubMed] [Google Scholar]


