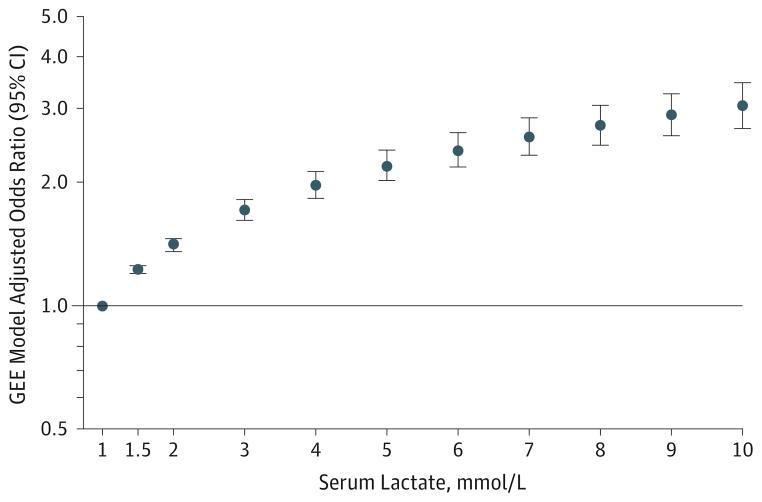
Figure 4.
Serum Lactate Level Analysis
Adjusted odds ratio for actual serum lactate levels for the entire septic shock cohort (N = 18 840). The covariates used in the regression model include region (United States and Europe), location where sepsis was suspected (emergency department, ward, or critical care unit), antibiotic administration, steroid use, organ failures (pulmonary, renal, hepatic, and acutely altered mental state), infection source (pneumonia, urinary tract infection, abdominal, meningitis, and other), hyperthermia (>38.3°C), hypothermia (<36°C), chills with rigor, tachypnea (>20/min), leukopenia (<4000 cells/μL), hyperglycemia (plasma glucose >120 mg/dL [6.7 mmol/L]), platelet count <100 ×103/μL, and coagulopathy (eMethods 3 in the Supplement). The adjusted odds ratio (OR) for the 6 groups presented in eTable 7 in the Supplement and the adjusted OR for the individual variables (lactate, vasopressor therapy, and fluids) are reported in eTable 8 in the Supplement. To convert serum lactate values to mg/dL, divide by 0.111.

