

Abstract
Parental genomes in the endosperm are marked by differential DNA methylation and are therefore epigenetically distinct. This epigenetic asymmetry is established in the gametes and maintained after fertilization by unknown mechanisms. In this manuscript, we have addressed the key question whether parentally inherited differential DNA methylation affects de novo targeting of chromatin modifiers in the early endosperm. Our data reveal that polycomb‐mediated H3 lysine 27 trimethylation (H3K27me3) is preferentially localized to regions that are targeted by the DNA glycosylase DEMETER (DME), mechanistically linking DNA hypomethylation to imprinted gene expression. Our data furthermore suggest an absence of de novo DNA methylation in the early endosperm, providing an explanation how DME‐mediated hypomethylation of the maternal genome is maintained after fertilization. Lastly, we show that paternal‐specific H3K27me3‐marked regions are located at pericentromeric regions, suggesting that H3K27me3 and DNA methylation are not necessarily exclusive marks at pericentromeric regions in the endosperm.
Keywords: DEMETER, DNA methylation, endosperm, genomic imprinting, Polycomb Repressive Complex 2
Subject Categories: Chromatin, Epigenetics, Genomics & Functional Genomics; Plant Biology
Introduction
Seed development in flowering plants is initiated by a double‐fertilization event, leading to the formation of two distinct fertilization products, the embryo and endosperm that are surrounded by the maternally derived seed coat. The embryo is derived after fusion of a haploid sperm cell with the haploid egg cell, while the endosperm is derived after fusion of the diploid central cell with a second haploid sperm cell. The endosperm is an ephemeral tissue that serves to support embryo growth or seed germination (Li & Berger, 2012). The parental genomes in the endosperm are epigenetically distinct (Ibarra et al, 2012). Thus, the maternal alleles in the endosperm are locally DNA hypomethylated (Gehring et al, 2009; Hsieh et al, 2009), a status which is established by the DNA glycosylase DEMETER (DME) that excises 5‐methylcytosine preferentially at small, euchromatic transposable elements (TEs) (Ibarra et al, 2012). DNA methylation in flowering plants occurs in three sequence contexts: CG, CHG, and CHH (asymmetric), where H is any nucleotide except G (Law and Jacobsen, 2010). DME has reported in vitro activity on methylation in all sequence contexts (Gehring et al, 2006). DME is expressed in the central cell of the female gametophyte before fertilization, but not after fertilization in the endosperm (Choi et al, 2002). How the hypomethylated status is maintained in the endosperm is unknown. DME also acts in the vegetative cell of pollen, the companion cell to the sperm cells. Similar to its role in the central cell, DME removes DNA methylation at distinct regions in the vegetative cell (Ibarra et al, 2012). Those regions accumulate small RNAs (sRNAs) in sperm cells (Slotkin et al, 2009; Calarco et al, 2012), suggesting communication between vegetative cells and sperm cells.
As a consequence of DNA hypomethylation in the central cell, the parental genomes are differentially methylated in the endosperm, which can cause genes to become preferentially expressed from either the maternally (MEGs (maternally expressed imprinted genes)) or paternally inherited alleles (PEGs (paternally expressed imprinted genes)). Parent‐of‐origin‐dependent gene expression as a consequence of epigenetic modification of maternal and paternal alleles in the gametes is a well‐known phenomenon termed genomic imprinting (Köhler et al, 2012; Gehring, 2013). Hypomethylation of TEs can cause either activation or silencing of the neighboring genes, by mechanisms that remain to be resolved. Hypomethylation could expose binding sites for the Fertilization Independent Seed (FIS)‐Polycomb Repressive Complex 2 (PRC2) as it has been proposed for the differentially methylated region downstream of the PHERES1 (PHE1) gene (Makarevich et al, 2008; Gehring et al, 2009; Villar et al, 2009). The PRC2 is an evolutionary conserved repressive complex that modifies histones by depositing histone trimethylation marks on histone H3 at lysine 27 (H3K27me3) (Simon & Kingston, 2013). The Arabidopsis FIS‐PRC2 is specifically expressed in the central cell of the female gametophyte and in the endosperm and consists of the subunits MEDEA (MEA), FIS2, FERTILIZATION INDEPENDENT ENDOSPERM (FIE), and MULTICOPY SUPPRESSOR OF IRA1 (MSI1) (Mozgova & Hennig, 2015). In plants as well as in mammals, PRC2 is localized to DNA hypomethylated TEs (Mathieu et al, 2005; Weinhofer et al, 2010; Deleris et al, 2012; Reddington et al, 2013; Zhang et al, 2014), revealing a general ability of PRC2 to target and possibly silence TEs. Previous studies in Arabidopsis (Köhler et al, 2005; Makarevich et al, 2008; Villar et al, 2009; Weinhofer et al, 2010; Wolff et al, 2011; Hsieh et al, 2011; Ibarra et al, 2012), rice (Du et al, 2014), and maize (Makarevitch et al, 2013; Zhang et al, 2014) have linked the imprinted status of PEGs with activities of PRC2 complexes; however, whether H3K27me3 is specifically localized to DME hypomethylated sites on the maternal genome remains to be tested.
In this manuscript, we addressed the key question whether parentally inherited differential DNA methylation affects de novo targeting and function of chromatin modifiers in the early endosperm, thereby directing gene expression over shorter or longer developmental time windows. To address this question, we established allele‐specific epigenome maps of H3K27me3, which in plants is mainly located in euchromatic regions (Zhang et al, 2007), and the heterochromatic marks H3K9me2 and H3K27me1 of the Arabidopsis endosperm. Our data reveal that H3K27me3 in addition to being located on genes is also localized to DME hypomethylated regions in the endosperm. The majority of paternally expressed imprinted genes (PEGs) had H3K27me3 on the maternal alleles, providing a mechanistic explanation why DME‐mediated hypomethylation of the maternal allele can cause specific silencing of this allele. Our data furthermore suggest an absence of de novo DNA methylation in the early endosperm, providing an explanation how DME‐mediated hypomethylation of the maternal genome is maintained after fertilization. We finally demonstrate that H3K27me3 is also located at pericentromeric regions of the paternal genome, suggesting that H3K27me3 and DNA methylation are not necessarily exclusive marks at pericentromeric regions in the endosperm.
Results
H3K27me3 in the endosperm localizes to pericentromeric regions
To understand the extent and biological importance of parental‐specific repressive epigenetic modifications in the Arabidopsis endosperm, we used reciprocal crosses between Col and Ler accessions to identify H3K27me3, H3K9me2, and H3K27me1 on the maternal or paternal endosperm genomes by chromatin immunoprecipitation followed by deep sequencing (ChIP‐seq). To facilitate crosses, we made use of the male sterile delayed‐dehiscence2 (dde2) mutant (Przybyla et al, 2008) in the Col background and the pistillata (pi) mutant (Goto & Meyerowitz, 1994) in the Ler background as female partners, while pollen donors were wild type. Both genes are not active in the endosperm (Belmonte et al, 2013) and the mutations will be heterozygous in the endosperm, we therefore do not expect any confounding effects caused by the mutants as female partners. We purified endosperm nuclei using the INTACT method (Deal & Henikoff, 2010) making use of the endosperm‐specific PHE1 promoter (Weinhofer et al, 2010) to express the BirA and NTF constructs (Appendix Fig S1 and Table EV1). About 70% of genes and TEs identified to be targeted by H3K27me3 in the endosperm overlapped between reciprocal crosses (Fig 1A), covering in total about 14 Mbps of the genome. We identified 1,916 genes overlapping with maternal‐specific H3K27me3‐marked regions (MSRs) and 1,456 genes overlapping with paternal‐specific H3K27me3‐marked regions (PSRs) in the Col accession and about the same number of parental‐specifically marked genes in the Ler accession (Fig 1B and Table EV2). We also identified about 5,000 parental‐specifically marked TEs in Col and Ler accessions (Fig 1B), which differs markedly from leaf tissues where only few TEs are marked by H3K27me3 (Fig 1C). Localization of H3K27me3 to TEs in the endosperm was reflected by a distinct localization of this modification at pericentromeric regions, contrasting the exclusion of H3K27me3 from those regions in leaf tissue (Fig 1D and Appendix Fig S2A). About 60% of maternal‐specific genes and about 50% of maternal‐specific TEs overlapped between the accessions (Appendix Fig S2B), as well as about 30% of paternal‐specific genes and about 40% of paternal‐specific TEs (Appendix Fig S2B). Accession‐specific H3K27me3‐marked regions differed substantially in their DNA methylation levels between the accessions (Appendix Fig S2C) and revealed high CG methylation levels at paternal H3K27me3‐marked regions in the Col accession. To avoid accession‐specific bias when comparing maternal and paternal‐specific H3K27me3 localization, we separately analyzed the parental‐specific H3K27me3 in both accessions by comparing H3K27me3 on the maternal Col or Ler genomes with H3K27me3 on the paternal Col or Ler genomes, respectively (Fig 1B). Using the same ChIP procedure and algorithm to identify enriched regions in leaf tissue (see Materials and Methods for details), we identified 17 Mbps covered by H3K27me3 targeting 6,639 genes, which is in a similar range as in previously published studies (Zhang et al, 2007; Bouyer et al, 2011; Farrona et al, 2011; et al; Lu et al, 2011). There are 5,382 genes commonly targeted by H3K27me3 in at least three previously published datasets of seedling tissues, of which 89% are also targeted in our study (Appendix Fig S3A), demonstrating the validity of our approach. Comparing the commonly H3K27me3‐targeted genes and TEs in endosperm and leaves (Appendix Fig S3B), we found that 63.5% of genes and 23.1% of TEs marked in the endosperm are also targeted in leaves, revealing a high tissue specificity of PRC2 targets, in agreement with previous studies (Weinhofer et al, 2010; Makarevitch et al, 2013; Zhang et al, 2014). Targeting of TEs by H3K27me3 has been previously reported (Weinhofer et al, 2010) and 64% of previously identified TEs were also identified in our new dataset (P < 1.5E‐60; Table EV2).
Figure 1. Parental‐specific distribution of H3K27me3 in the Arabidopsis endosperm.
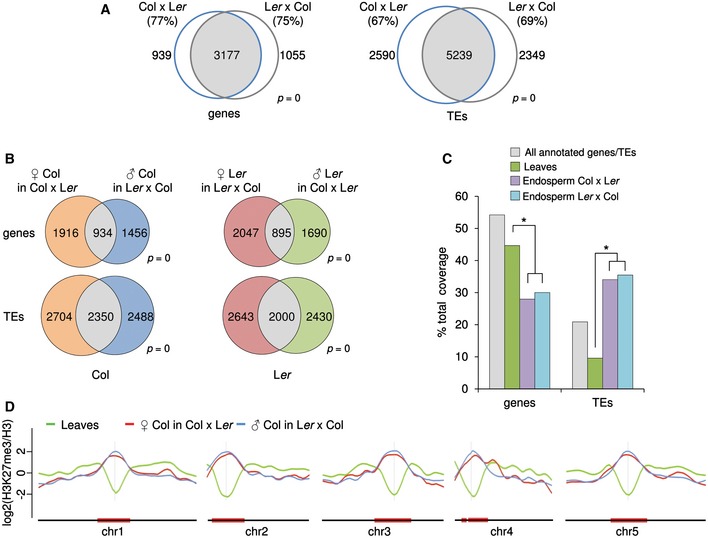
- Overlap of genes (left Venn diagram) and TEs (right Venn diagram) marked by H3K27me3 in Col x Ler and Ler x Col endosperm. Significance was tested using a hypergeometric test. Numbers in parenthesis correspond to percent of overlap.
- Parental‐specific and shared H3K27me3 genes (upper Venn diagrams) and TEs (lower Venn diagrams) in Col and Ler accessions. Significance was tested using a hypergeometric test.
- Distribution of H3K27me3‐marked regions in genes and TEs in leaves and endosperm. All annotated genes and TEs correspond to the frequency of genes and TEs present in the Arabidopsis genome. Significance of differences in the distribution of H3K27me3‐marked regions in genes and TEs between different tissues was tested by chi‐square, and significant differences (*P < 0.001) are marked by an asterisk.
- Chromosomal distribution of z‐score normalized H3K27me3 in leaves and on maternal and paternal alleles in the endosperm of the Col accession.
We addressed the question whether specific TE families have parental‐specific H3K27me3 enrichment in the endosperm. Helitron, MuDR, and gypsy elements were most commonly targeted by H3K27me3, reflecting their abundance in the genome (Fig 2A). There was preferential enrichment of specific TE classes marked by H3K27me3 on maternal and paternal genomes; while helitrons were significantly enriched among maternal‐specific compared to paternal‐specific H3K27me3 targets in both accessions, there was a significant enrichment of gypsy elements among paternal‐specific compared to maternal‐specific H3K27me3 targets (Fig 2A). Gypsy elements cluster at the pericentromeric heterochromatin regions (Wright et al, 2003), contrasting the distribution of helitrons that are distributed throughout the genome with a bias toward centromeres (Hollister & Gaut, 2009; Numa et al, 2010). This different localization pattern of gypsy elements and helitrons was reflected in the different localization of maternal and paternal‐specific H3K27me3; while H3K27me3 MSRs were localized throughout the genome with a bias toward the pericentromere, H3K27me3 PSRs were clustered at pericentromeric regions (Fig 2B and Appendix Fig S4). Together, these data reveal that there are parental‐specific differences in the distribution of H3K27me3 in the endosperm that are particularly pronounced at TEs.
Figure 2. Parental‐specific localization of H3K27me3 on transposable elements in the Arabidopsis endosperm.
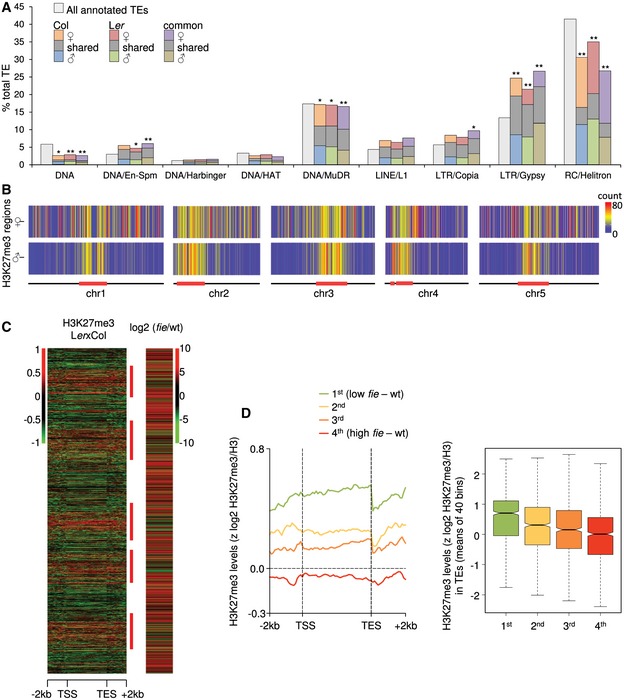
- Distribution of H3K27me3‐marked regions among TE superfamilies. The maternal and paternal H3K27me3‐marked TEs in Col and Ler correspond to comparison of Fig 1B; common maternal and paternal regions refer to parental‐specific H3K27me3 target regions that were shared among Col and Ler accessions (see Appendix Fig S2B). Significance of differences of the H3K27me3 distribution on maternal and paternal genomes in different TE families was tested by chi‐square, and significant differences (*P < 0.05 or **P < 0.005) are marked by one or two asterisks, respectively. Superfamilies DNA/Mariner, RathE1–3, LINE, SINE, DNA/Pogo and DNA/Tc1 were excluded from this graph because of relatively few occurrences.
- Heat map for maternal‐ and paternal‐specific H3K27me3 distribution in Col. Bin size is 100 kbp and colors reflect number of enriched regions.
- Total TAIR10‐annotated TEs were aligned at the 5′ and 3′ ends and stacked from the top of chromosome 1 to the bottom of chromosome 5. The log2 enrichment ratio of H3K27me3 methylation in Ler x Col endosperm is displayed as a heat map in the left panel and the log2‐fold expression changes in fie versus wild‐type endosperm (Hsieh et al, 2011) in the right panel. Expression scores were calculated as number of reads per kb of sequence per 10 million aligned reads. Only TEs showing expression in at least wild‐type or fie are shown. Red bars on the right margin mark pericentromeric regions as defined in Wang et al (2013).
- Metagene plot (left panel) across TE bodies was constructed between −2 kb and + 2 kb for z‐score normalized H3K27me3. Positions plotted on the x‐axis are relative to annotated transcription start and end sites (TSS and TES, respectively) and given in kilobases for upstream and downstream sequences and as percentages for TE bodies. TEs were grouped according to the fold change in expression between fie and wild type. Box plot (right panel) of expression differences in fie and wild type in relation to H3K27me3 levels for the group of TEs shown in the left panel.
To test whether H3K27me3 is functionally relevant for TE silencing, we analyzed TE expression in FIS‐PRC2‐depleted fie endosperm (Hsieh et al, 2011). As fie is a maternal gametophytic mutant (Ohad et al, 1996), we only analyzed endosperm of maternal fie mutants. Indeed, TEs in fie endosperm were upregulated (Fig 2C), but the level of deregulation anti‐correlated with the level of H3K27me3 on maternal and paternal alleles, which was particularly pronounced at pericentromeric regions (Fig 2C and D, and Appendix Fig S5). We addressed the question whether TEs that remained silent or were downregulated in the fie mutant were additionally marked by DNA methylation. Indeed, TEs with low expression in fie had higher levels of DNA methylation in all sequence contexts compared to TEs that became upregulated upon lack of FIS‐PRC2 function (Appendix Fig S6). Consistent with the reported upregulation of genes mediating CG DNA methylation in fie endosperm (Hsieh et al, 2011), the CG DNA methylation level at TEs was increased in fie, while the CHG and CHH methylation level decreased, in agreement with previously published data (Ibarra et al, 2012). Those TEs with low expression in fie were preferentially localized in pericentromeric regions (Fig 2C) and densely marked by CG DNA methylation that furthermore increased upon FIE depletion (Appendix Fig S6), correlating with reduced TE expression in fie. The most highly upregulated TEs in fie were neither substantially marked by H3K27me3 nor by DNA methylation (Fig 2D and Appendix Fig S6), suggesting an unknown mechanism responsible for their upregulation, possibly connected to increased endosperm growth. In summary, our data suggest that H3K27me3 is not a major silencing mark for TEs in the endosperm; however, the additional regulation by DNA methylation and unknown factors may potentially mask the effect of H3K27me3 depletion. Furthermore, the concomitant presence of H3K27me3 and CG DNA methylation at pericentromeric regions suggests that both marks are not necessarily exclusive.
Maternal and paternal‐specific H3K27me3 regions have distinct chromatin properties
Previous studies in plants and animals revealed that PRC2 is redistributed to DNA hypomethylated regions, suggesting that DNA methylation prevents PRC2 recruitment (Mathieu et al, 2005; Weinhofer et al, 2010; Deleris et al, 2012; Reddington et al, 2013; Saksouk et al, 2014). To determine the basis for parental‐specific H3K27me3, we tested whether H3K27me3 positioning anti‐correlates with parental‐specific DNA methylation. To test this hypothesis, we generated parental‐specific DNA methylation profiles of INTACT‐purified endosperm at 4 days after pollination (DAP) derived from reciprocal crosses of Col and Ler accessions. Both, MSRs and PSRs had reduced CG methylation levels on maternal alleles compared to the paternal alleles, suggesting them to be targeted by the DNA glycosylase DME (Fig 3A). To address the question whether DME regions are preferentially targeted by H3K27me3, we tested H3K27me3 localization at DME target regions. Consistently, DME target regions (see Materials and Methods) were preferentially marked by H3K27me3 (Fig 3B), suggesting that DME‐mediated reduced CG methylation on MSRs promotes H3K27me3 targeting, consistent with previous data revealing H3K27me3 targeting to hypomethylated regions (Mathieu et al, 2005; Weinhofer et al, 2010; Deleris et al, 2012; Reddington et al, 2013). Strikingly, however, DME target regions were also marked by H3K27me3 on paternal alleles (Fig 3B), suggesting that DNA‐methylated regions and H3K27me3 co‐occur at pericentromeric regions.
Figure 3. DEMETER target regions are enriched for H3K27me3.
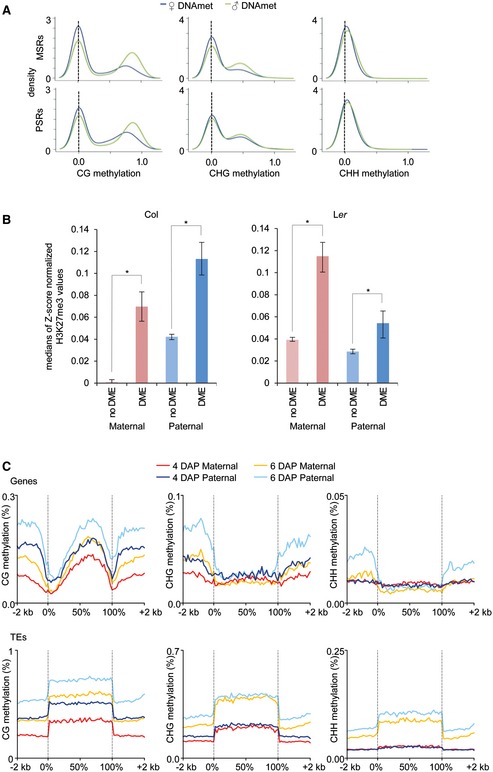
- Kernel density plots visualizing the frequency distribution of parental‐specific CG, CHG, and CHH methylation levels in the endosperm of 4 DAP seeds on maternal‐specific H3K27me3‐marked regions (MSRs; upper panels) and paternal‐specific H3K27me3‐marked regions (PSRs; lower panels). DNA methylation levels in 50‐bp windows were plotted.
- Bar charts representing median values of z‐scored H3K27me3 values on maternal and paternal genomes in 50‐bp windows intersecting DME target sites or sites not targeted by DME. Statistical test for difference was done by a Wilcoxon rank‐sum test. Asterisks mark significance (*P < 10E‐5 ). Left and right panels show data for Col and Ler, respectively.
- DNA methylation levels over genes (upper plots) and TEs (lower plots) in the endosperm at 4 and 6 DAP. Genes were aligned at the 5' and 3' ends (dashed lines), and average methylation levels in CG, CHG, and CHH context for each 100‐bp interval were plotted.
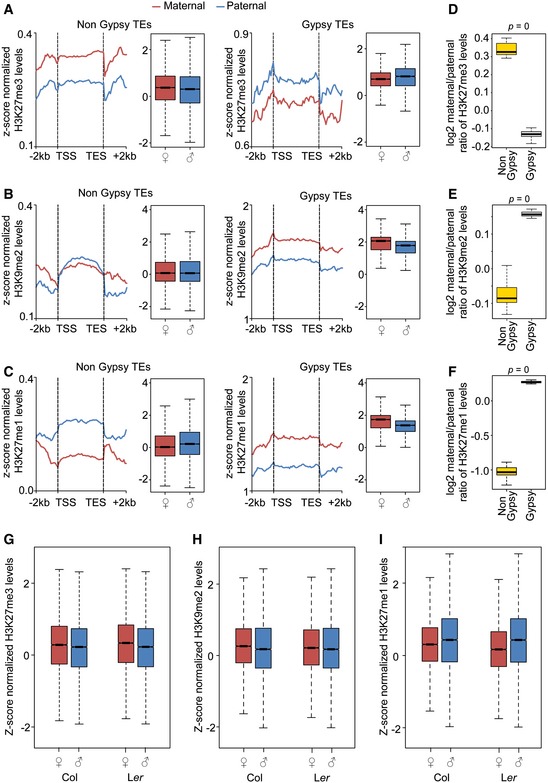
Regions targeted by DME in the pollen vegetative cell accumulate sRNAs in sperm, suggesting that those regions are targets for active RNA‐dependent DNA methylation after fertilization (Calarco et al, 2012). However, at 4 DAP, there was no substantial CHH methylation detectable in the endosperm (Fig 3C), supporting data showing that the de novo DNA methyltransferases DRM1 and DRM2 are not active in the early endosperm (Jullien et al, 2012). Thus, differential CHH methylation seems unlikely to account for specific recruitment of H3K27me3 to pericentromeric PSRs. Pericentromeric regions are characterized by the presence of heterochromatic marks H3K9me2 and H3K27me1 (Turck et al, 2007; Bernatavichute et al, 2008; Jacob et al, 2009; Roudier et al, 2011). We therefore tested whether there are parental‐specific differences in the distribution of H3K9me2 and H3K27me1 modifications in 4 DAP endosperm nuclei. The genomewide distribution of both modifications was similar compared to sporophytic tissues and accumulated at pericentromeric regions (Fig 4A and B, and Appendix Fig S7A and B). Nevertheless, we noticed a marked reduction in paternal‐specific compared to maternal‐specific H3K9me2‐marked regions in both accessions (Fig 4A and C, and Appendix Fig S7A). A paternal‐specific reduction in H3K27me1‐marked regions was restricted to centromeric regions, while the flanks of pericentromeric regions had increased levels of paternal‐specific H3K27me1 (Fig 4B and D, and Appendix Fig S7B). Thus, the increased paternal‐specific localization of H3K27me3 at pericentromeric regions correlates with reduced H3K9me2. Supporting this notion, the parental distribution of H3K27me3 on gypsy elements, which are mainly restricted to pericentromeric heterochromatic regions, differed significantly from that of all other TEs and was higher on the paternal compared to the maternal alleles or equal between both alleles, while there was a strong maternal bias for non‐gypsy TEs (Fig 5A and D, and Appendix Fig S8A and B). The level of H3K27me3 on gypsy elements was substantially higher on the paternal Col compared to the paternal Ler genome (Fig 5A and Appendix Fig S8A). Nevertheless, parental differences in H3K27me3 on gypsy elements compared to non‐gypsy TEs were significant in both accessions (Fig 5D and Appendix Fig S8B). Correlating with the parental‐specific differences of H3K27me3 distribution on gypsy elements, the parental distribution of H3K9me2 on gypsy elements was distinct to that of H3K27me3 with increased levels of H3K9me2 on maternal compared to paternal alleles (Fig 5B and E, and Appendix Fig S8C and D). Also, the parental distribution of H3K27me1 on gypsy elements was similar to that of H3K9me2, contrasting the paternal bias of this modification on non‐gypsy TEs (Fig 5C and F, and Appendix Fig S8E and F). While pericentromeric DME regions had similar levels of H3K27me3 as gypsy elements (Fig 5A and G), pericentromeric DME target regions were not substantially enriched for H3K9me2 and H3K27me1 on both parental alleles (Fig 5H and I), which may promote their targeting by H3K27me3. Depletion of heterochromatic modifications on DME target sites is in agreement with previously published data (Ibarra et al, 2012). Importantly, regions that lose CG methylation and H3K9me2 in a mutant deficient for the maintenance methyltransferase MET1 gain H3K27me3 (Mathieu et al, 2005; Deleris et al, 2012), which occurs prominently at gypsy elements located at pericentromeric regions (Appendix Fig S9A). Consistently, 52% of those TEs that gained H3K27me3 in the met1 mutant overlapped with those marked by H3K27me3 in the endosperm (hypergeometric test P < 1E‐20; Appendix Fig S9B). Thus, localization of H3K27me3 at H3K9me2‐depleted regions may act as a general mechanism to maintain heterochromatin formation in plants.
Figure 4. Parental‐specific distribution of H3K9me2 and H3K27me1 in the Arabidopsis endosperm.
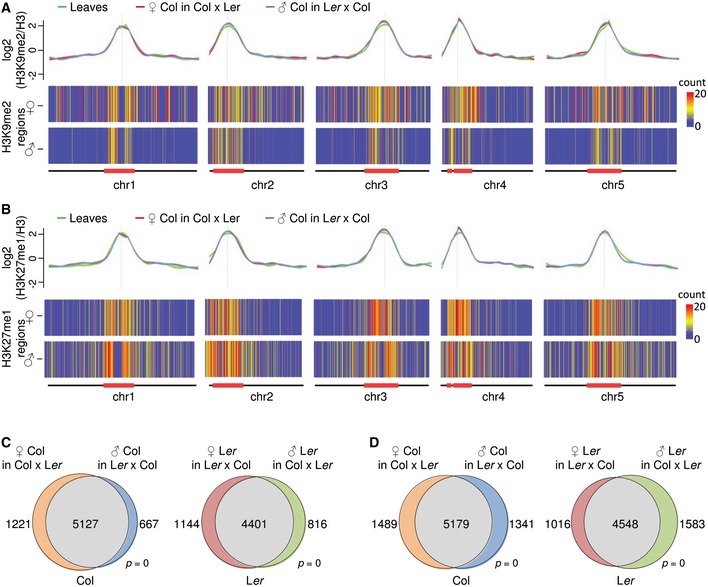
- Upper panel shows chromosomal distribution of z‐score normalized H3K9me2 in leaves and on maternal and paternal alleles in the endosperm of the Col accession. Lower panel shows heat map for maternal‐ and paternal‐specific H3K9me2 distribution in Col. Bin size is 100 kbp, and colors reflect number enriched regions.
- Upper panel shows chromosomal distribution of z‐score normalized H3K27me1 in leaves and on maternal and paternal alleles in the endosperm of the Col accession. Lower panel shows heat map for maternal‐ and paternal‐specific H3K27me1 distribution in Col. Bin size is 100 kbp, and colors reflect number of enriched regions.
- Overlap of parental‐specific and shared TEs marked by H3K9me2 in Col and Ler accessions. Significance was tested using a hypergeometric test.
- Overlap of parental‐specific and shared TEs marked by H3K27me1 in Col and Ler accessions. Significance was tested using a hypergeometric test.
Figure 5. Parental‐specific distribution of H3K27me3, H3K9me2, and H3K27me1 in gypsy and Non‐gypsy TEs.
-
A–CMetagene plots showing average distribution of z‐score normalized H3K27me3 (A), H3K9me2 (B), H3K27me1 (C) levels on maternal and paternal alleles of non‐gypsy TE elements (left panel) and gypsy elements (right panel) in the cross Ler x Col. Box plots show mean values of z‐scored methylation marks shown in the metagene plots.
-
D–FBox plots showing log2 ratios of H3K27me3 (D), H3K9me2 (E), H3K27me1 (F) levels on maternal and paternal alleles of non‐gypsy and gypsy TE elements in the cross Ler x Col. Statistical test for difference was done by a Wilcoxon rank‐sum test.
-
G–IBox plots represent mean values of z‐scored H3K27me3 (G), H3K9me2 (H), and H3K27me1 (I) values in 50‐bp windows intersecting pericentromeric DME target regions.
Together, we conclude that specific localization of H3K27me3 on maternal alleles occurs on sites that undergo DME‐mediated hypomethylation in the central cell, while H3K27me3 at paternal pericentromeric regions co‐occurs with DNA methylation.
Paternally expressed imprinted genes are marked by maternal‐specific H3K27me3
If DME regulates the deposition of H3K27me3 and therefore establishes parent‐of‐origin‐specific H3K27me3 differences, we expected that imprinted genes should be marked by allele‐specific H3K27me3. Indeed, out of 43 paternally expressed imprinted genes (PEGs) that were previously identified in Col/Ler interaccession crosses (Pignatta et al, 2014), 35 were commonly marked by maternal H3K27me3 in Col and Ler accessions (hypergeometric test P < 1E‐20; Fig 6A and Table EV3). Of those, six genes were also marked by H3K27me3 on the paternal alleles (Fig 6A). However, the paternal alleles of five of those six genes had substantially lower H3K27me3 levels compared to the maternal alleles (Appendix Fig S10A), correlating with increased activity of paternal alleles. For the PEG PHE1, a distantly located differentially DNA‐methylated region was shown to be important for the imprinted status of PHE1 (Makarevich et al, 2008; Gehring et al, 2009; Villar et al, 2009) and our study reveals these regions to be specifically H3K27me3 marked on the maternal allele (Appendix Fig S10B), suggesting that indeed distantly located differentially H3K27me3‐marked regions can affect the imprinted status of genes. To test whether H3K27me3 is functionally relevant for the imprinted status of PEGs, we tested imprinted expression in fie mutant endosperm (cross fie (Ler) × Col (Hsieh et al, 2011)). Indeed, imprinted expression of all PEGs marked by maternal H3K27me3 broke down in fie (Table EV3), revealing that H3K27me3 on maternal alleles is required for the imprinted status of PEGs. The maternal alleles of three out of six PEGs that were not marked by maternal H3K27me3 became upregulated in fie (Table EV3). Whether distantly located H3K27me3‐marked regions establish imprinted expression of those genes remains to be investigated.
Figure 6. Maternal alleles of PEGs are marked by H3K27me3.
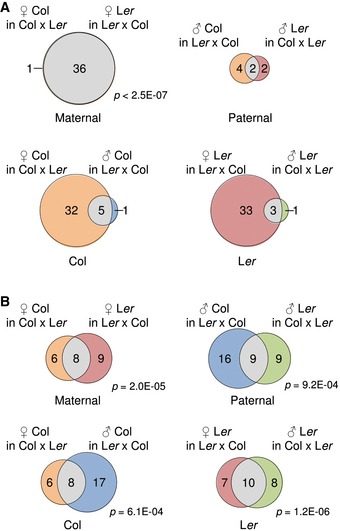
- Analysis of parental‐specific H3K27me3 in 43 PEGs (Pignatta et al, 2014). PEGs associating with accession‐specific and shared H3K27me3 regions on maternal and paternal genomes (upper Venn diagrams). PEGs associating with parental‐specific and shared H3K27me3 regions in Col and Ler accessions (lower Venn diagrams). Significance was tested using a hypergeometric test, and only P‐values < 0.001 are shown. The color code corresponds to the same used in Fig 1B.
- Analysis of parental‐specific H3K27me3 in 131 MEGs (Pignatta et al, 2014). MEGs associating with accession‐specific and shared H3K27me3 regions on maternal and paternal genomes (upper Venn diagrams). MEGs associating with parental‐specific and shared H3K27me3 regions in Col and Ler accessions (lower Venn diagrams). Significance was tested using a hypergeometric test, and only P‐values < 0.001 are shown. The color code corresponds to the same used in Fig 1B.
In contrast to the strong overlap of PEGs with maternal H3K27me3 regions, out of 131 MEGs only nine were commonly marked by paternal H3K27me3 in Col and Ler accessions (hypergeometric test P > 0.1; Fig 6B and Table EV4), suggesting that H3K27me3 (P < 10E‐5) on paternal alleles is not a major determinant for genomic imprinting in Arabidopsis. Supporting this notion, with the exception of two MEGs (AT5G35490 and AT3G27130), the imprinting status of MEGs marked by paternal H3K27me3 (in Col) was maintained in the fie mutant compared to their corresponding control (Ler × Col; Table EV4).
In summary, we conclude that the imprinted status of PEGs is mediated by H3K27me3 on the paternal allele, while the imprinted status of the majority of MEGs is largely independent of H3K27me3.
We furthermore tested whether genes with parentally biased expression that were, however, not passing all criteria used to define imprinted genes (Pignatta et al, 2014), were enriched for H3K27me3 on the silent allele. We found that about half of all genes with paternally biased expression (186 genes) were marked by maternal H3K27me3 in either Col or Ler accessions, while only 8–9% of all genes with maternally biased expression (1,233 genes) had paternal H3K27me3 (Appendix Fig S11 and Table EV5). Thus, paternally biased expression is strongly associated with H3K27me3 on maternal alleles, while maternally biased expression and paternal H3K27me3 rarely coincide.
Discussion
In this study, we investigated the parental‐specific distribution of the FIS‐PRC2‐established histone modification H3K27me3 in the Arabidopsis endosperm using INTACT‐purified nuclei. We report the following new discoveries: (i) H3K27me3 has a parent‐of‐origin‐specific distribution in the endosperm and determines the imprinting status of PEGs. (ii) The specific localization of H3K27me3 on the maternal genome occurs preferentially at DME target sites, suggesting that DME‐mediated DNA demethylation is the decisive step to allow allele‐specific H3K27me3 and imprinted expression of PEGs. (iii) The 4 DAP endosperm is largely devoid of CHH methylation, providing an explanation of how DME‐mediated hypomethylation of the maternal genome is maintained after fertilization. (iv) Paternal‐specific H3K27me3 is localized at pericentromeric regions and has no major impact on the regulation of MEGs.
Our study revealed that there are substantial accession‐dependent differences in H3K27me3 distribution, contrasting previous observations in Arabidopsis leaf tissue (Dong et al, 2012). However, as the previous study used whole‐genome tiling microarrays (Dong et al, 2012), the extent of accession‐specific differences in H3K27me3 distribution was likely underestimated. Accession‐specific differences in H3K27me3 distribution that have been identified in leaf tissues are associated with TEs (Dong et al, 2012) that as shown in this study are overrepresented among H3K27me3 targets in the endosperm. Differences between Col and Ler accessions are frequently associated with differences in TE localization (Ziolkowski et al, 2009), providing an explanation for the large number of accession‐specific H3K27me3 targets in the endosperm. Consistently, correlating with a higher number of TEs in maize compared to Arabidopsis, there is a substantially higher number of strain‐specific H3K27me3‐marked regions in maize endosperm (Zhang et al, 2014). In addition to differences in TE localization, Col and Ler accessions differ substantially in DNA methylation (Vaughn et al, 2007; Zhai et al, 2008). As shown in this study, H3K27me3 in the endosperm is localized to DNA‐demethylated regions targeted by DME but also co‐localizes with DNA‐methylated pericentromeric regions, revealing that both modifications are not necessarily exclusive. Co‐localization of both modifications also occurs in animal cells but both modifications are mutually exclusive in CpG‐dense regions (Brinkman et al, 2012; Statham et al, 2012). We observed substantial differences in DNA methylation at accession‐specific H3K27me3‐marked regions, in particular increased DNA methylation in the Col compared to the Ler accession. Whether the accession‐specific differences in DNA methylation can give rise to accession‐specific differences in H3K27me3 remains to be tested. It is possible that differences in H3K27me3 direct differences in DNA methylation, as previously suggested in cancer cells, where PRC2 recruits DNA methyltransferases to CpG islands (Schlesinger et al, 2007; Widschwendter et al, 2007; Gal‐Yam et al, 2008). However, endosperm lacking the main FIS‐PRC2 component FIE maintains parental‐specific differences in CG methylation (Ibarra et al, 2012), arguing in favor of the idea that differences in DNA methylation direct differences in H3K27me3.
A previous study described parental‐specific H3K27me3 localization to hypomethylated maternal regions in maize (Zhang et al, 2014), demonstrating that the regulatory mechanisms controlling imprinted expression of PEGs predates the split of monocots and dicots. In contrast to the maize study (Zhang et al, 2014), we also identified H3K27me3‐specific regions on paternal alleles that, however, were not connected to the regulation of MEGs. Instead, we find H3K27me3 PSRs to be preferentially localized at pericentromeres. Pericentromeres are heterochromatic regions marked by H3K9me2 and H3K27me1 modifications (Turck et al, 2007; Bernatavichute et al, 2008; Jacob et al, 2009; Roudier et al, 2011) and are enriched for the histone H3.1 variant (Stroud et al, 2012; Wollmann et al, 2012). Our data revealed that maternal and paternal pericentromeric regions differ in H3K9me2 and H3K27me1 occupancy, with reduced levels of H3K9me2 being present on the paternal genome. Reduced levels of H3K27me1 on the paternal genome were restricted to the centromere, in agreement with the preferential localization of gypsy TEs at centromeric regions (Arabidopsis Genome Initiative, 2000) and the depletion of H3K27me1 on paternal copies of gypsy TEs. Interestingly, pericentromeric regions in the paternal genome of early mouse embryos are also marked by H3K27me3, which is required for establishment of heterochromatin (Puschendorf et al, 2008; Santenard et al, 2010; Akiyama et al, 2011). The H3K27me3 modification is replaced by Suv39h‐mediated H3K9me3 after the first three cleavage divisions (Puschendorf et al, 2008), concomitantly with the exchange of the histone variant H3.3 by the H3.1 variant (Akiyama et al, 2011). Whether reduced occupancy of H3K9me2 and H3K27me1 at the paternal endosperm genome is a consequence of the replication‐coupled exchange of histone H3.3 by H3.1 after fertilization (Ingouff et al, 2007) remains to be shown.
Our data furthermore revealed that there are only low levels of CHH methylation in the 4 DAP endosperm, supporting data showing that the de novo DNA methyltransferases DRM1 and DRM2 are not active in the early endosperm (Jullien et al, 2012). Combined, these data suggest an absence of de novo DNA methylation in the early endosperm, providing an explanation how DME‐mediated hypomethylation of the maternal genome is maintained after fertilization. At later stages of endosperm development, reduced DNA methylation of the maternal compared to the paternal genome is maintained, even though de novo DNA methylation has resumed, as judged by increased DNA methylation levels in all sequence contexts and expression of DRM1 and DRM2 (Belmonte et al, 2013). Thus, it seems likely that the presence of FIS‐PRC2 at DME target sites prevents DNA remethylation and thus maintains parental‐specific DNA methylation differences.
Lastly, we show that regulation of MEGs and PEGs depends on different epigenetic mechanisms. While DME‐mediated demethylation is required for the regulation of both classes of imprinted genes (Gehring et al, 2009; Hsieh et al, 2009; and this study), FIS‐PRC2 mediated regulation is mainly restricted to PEGs. The likely reason for this difference is that DME is not active in sperm (Schoft et al, 2011); thus, demethylation of small TEs in gene‐rich regions is restricted to the central cell of the female gametophyte. As FIS‐PRC2 is active in the central cell of the female gametophyte (Luo et al, 2000), regions demethylated by DME can be targeted by FIS‐PRC2 in the central cell and remain targeted after fertilization, establishing maternal‐specific H3K27me3. Importantly, helitrons were shown to be frequently associated with maternally demethylated regions and the regulation of imprinted genes (Pignatta et al, 2014), in agreement with our findings revealing helitrons to be preferentially targeted by maternal‐specific H3K27me3. PEGs are enriched for demethylated regions within the gene body (Ibarra et al, 2012); thus, binding of FIS‐PRC2 and deposition of H3K27me3 within the coding region likely causes efficient silencing of the maternal alleles. Nevertheless, for the PEG PHE1, the coding region was not marked by H3K27me3, but the 3′ region contained maternal‐specific H3K27me3, suggesting that higher‐order chromatin structures can cause efficient silencing of the maternal alleles as previously shown for other PRC2 targets (Crevillen et al, 2013; Ariel et al, 2014). In conclusion, our analyses reveal that FIS‐PRC2 maintains epigenetic asymmetry between parental genomes during endosperm development leading to paternal‐specific expression of imprinted genes.
Materials and Methods
Plant material and growth conditions
All seeds were surface‐sterilized (5% sodium hypochlorite and 0.01% Triton X‐100), stratified for 2 days at 4°C, and germinated on half‐strength Murashige and Skoog medium containing 1% sucrose under long‐day conditions (16‐h light/8‐h darkness; 21°C). Plants were transferred to soil after 10–12 days and grown under long‐day conditions. The Arabidopsis mutant dde2 is in the Col‐0 accession (Przybyla et al, 2008), while pistillata (pi‐1) is in Ler (Goto & Meyerowitz, 1994). Transgenic Arabidopsis lines expressing PHE1::NTF and PHE1::BirA (lines with both constructs are referred to as INT) are in the Col‐0 accession. Plant material of the cross‐combination Col x Ler was generated by manually pollinating dde2, INT with pollen of Ler plants. Material for the reciprocal cross‐combination Ler x Col was generated by pollinating pi mutants with pollen of INT plants. Siliques were harvested at 4 DAP, flash‐frozen in liquid nitrogen, and stored at −80°C. Leaf material was harvested from 20‐day‐old Col‐0 plants by specifically selecting leaf number 5 and 6. Leaves were collected in PBS (137 mM NaCl, 2.7 mM KCl, 4.3 mM Na2HPO4, 1.4 mM KH2PO4) supplemented with 0.1% Tween and cross‐linked using 1% formaldehyde for 10 min under vacuum. Cross‐linking was stopped by adding glycine at final concentration 125 mM for 5 min under vacuum. Leaves were rinsed with water and blotted dry before freezing in liquid nitrogen and stored at −80°C.
Generation of transgenic lines
The INTACT plasmid constructs were cloned using BP/LR Gateway cloning technology (Life Technologies, Carlsbad, USA). NTF and BirA fragments were amplified by PCR using previously published constructs (Deal & Henikoff, 2010) with primers attB1 5′‐GGGGACAAGTTTGTACAAAAAAGCAGGCTTAATGAATCATTCAGCGAAA‐3′ and attB2 5′‐GGGGACCACTTTGTACAAGAAAGCTGGGTACATCTAGTAACATAGATG‐3′ for NTF and attB1 5′‐GGGGACAAGTTTGTACAAAAAAGCAGGCTTAATGAAGGATAACACCGTG‐3′ and attB2 5′‐GGGGACCACTTTGTACAAGAAAGCTGGGTACGACGGGGATCTGGATTT‐3′ for BirA. The fragments were introduced into the pDONR221 vector and transferred to a pB7WG2 pDEST vector containing 3 kb PHE1 (At1g65330) promoter sequence (Weinhofer et al, 2010). Constructs were introduced into the Col accession using Agrobacterium‐mediated transformation (Clough & Bent, 1998). Lines expressing both INT constructs were generated by crossing. NTF biotinylation by BirA ligase activity was analyzed by Western blotting and microscope analysis to select the best NTF/BirA combination.
Western blotting
Nuclei extracts from siliques were prepared from several double‐transgenic NTF and BirA lines by grinding the material in liquid nitrogen and resuspending it in Honda buffer (2.5% w/v Ficoll 400, 5% dextran T40, 0.4 M sucrose, 25 mM Tris–HCl pH 7.4, 10 mM MgCl2, 10 mM β‐mercaptoethanol, and 0.5% Triton X‐100). The nuclei were pelleted at 1,500 g for 5 min at 4°C and resuspended in lysis buffer (10 mM Tris–HCl pH 7.5, 150 mM NaCl, 0.5 mM EDTA, 0.5% NP40, 1 mM PMSF, 1 μg/μl DNase I, 2.5 mM MgCl2, containing complete protease inhibitors, Roche, Basel, Switzerland) with extensive pipetting. The extract was incubated on ice for 30 min and cleared by centrifugation at 17,000 g for 5 min at 4°C. The supernatant was diluted with dilution buffer (10 mM Tris–HCl pH 7.5, 150 mM NaCl, 0.5 mM EDTA, 1 mM PMSF, containing complete protease inhibitors, Roche), and equilibrated GFP‐Trap M magnetic beads (Chromotek, Planegg‐Martinsried, Germany) were added. The extract was incubated for 2 h at 4°C, and magnetic beads were captured and washed twice with dilution buffer. Beads were incubated with SDS‐loading buffer (100 mM Tris, 10% sodium dodecyl sulfate, 30% glycerol, 1% β‐mercaptoethanol, and 0.2% bromophenol blue, pH 7.5) for 5 min at 95°C, and the eluted proteins were electrophoresed in a 12% SDS–PAGE gel. The Western blotting was performed as described previously (Deal & Henikoff, 2010).
INTACT nuclei purification
Siliques were homogenized in Honda buffer using GentleMACS dissociator (Miltenyi Biotec, Bergisch Gladbach, Germany). The homogenate was incubated for 15 min at gentle rotation, followed by filtering two times through Miracloth and one time through 30 μm CellTrics (Sysmex, Kobe, Japan). The nuclear suspension was pelleted at 1,500 g for 6 min at 4°C and the pellet was resuspended in 1.5 ml PBS (137 mM NaCl, 2.7 mM KCl, 4.3 mM Na2HPO4, 1.4 mM KH2PO4) supplemented with 1% BSA (albumin from bovine serum, Sigma, St. Louis, USA) (PBSB). Thirty‐three microliters of PBSB‐equilibrated M‐280 streptavidin‐coated Dynabeads (Invitrogen, Carlsbad, USA) was added to the nuclear suspensions, and the mixture was rotated for 30 min at 4°C. The biotinylated nuclei bound to the beads were captured using a magnetic rack and diluted in 12 ml of PBSB with 0.1% Triton X‐100. After 15 min incubation under rotation at 4°C, bead‐bound nuclei were captured in a flow‐based setup (Deal & Henikoff, 2010). Briefly, the suspension was pipetted into a 10‐ml serological pipette (Sarstedt, Nümbrecht, Germany) and then inserted to 1‐ml pipette tip placed in a MiniMACS separator magnet (Miltenyi Biotec). The solution was allowed to drain out. The captured bead‐bound nuclei were eluted from the wall of the tip by repeated pipetting with buffer. Purity of endosperm nuclei was determined by calculating the deviation from the expected ratio (R) of two maternal to one paternal genomes using Col and Ler SNPs (Table EV1). The contamination (C) was calculated by applying the formula C = (R/2−1)/(2 + R/2) that was derived based on the assumption that in a cross Col × Ler the ratio of Col‐derived sequences is the sum of 2/3rd Col sequences from endosperm nuclei plus 2 Col‐derived sequences from seed coat nuclei.
Chromatin immunoprecipitation (ChIP)
About 500,000 INTACT‐purified nuclei of 600–800 mg siliques were resuspended in PBSB buffer and after adding formaldehyde to a final concentration of 1% incubated on ice for 8 min. The cross‐linking was stopped by adding glycine to a final concentration 125 mM, and incubation was continued for 5 min. Bead‐bound nuclei were collected using a magnetic rack and resuspended in 100 μl of NLB (nuclei lysis buffer, 50 mM Tris–HCl pH 8.0, 10 mM EDTA, 1% SDS, supplemented with complete protease inhibitors, Roche). Leaf nuclei extraction was performed from 300 mg starting material. Cross‐linked leaves were ground to a fine powder in liquid nitrogen and resuspended in 5 ml of Honda buffer. The homogenate was incubated for 15 min with gentle rotation and filtered two times through Miracloth and one time through 30 μm CellTrics. The nuclear suspension was pelleted at 1,500 g for 5 min at 4°C, and the pellet was resuspended in 100 μl of NLB. NLB‐resuspended nuclei (of either endosperm of leaves) were sonicated using a Bioruptor (Diagenode, Liège, Belgium) for 9 cycles 20 s on and 45 sec off at high power. Afterward, 900 μl of ChIP dilution buffer (1.1% Triton X‐100, 1.2 mM EDTA, 16.7 mM Tris–HCl pH 8.0, 167 mM NaCl, containing complete protease inhibitors (Roche)) was added, and the sheared chromatin was centrifuged at 17,000 g for 5 min at 4°C. The supernatant was kept and divided into different aliquots for incubation with antibodies. Twenty microliters of the chromatin suspension was kept as input sample. Antibodies were added and incubated overnight at 4°C on a rotating mixer, followed by the addition of protein A Dynabeads (Invitrogen) and continued incubation for 90 min. Beads were washed one time shortly and one time for 5 min at 4°C in low‐salt wash buffer (150 mM NaCl, 0.1% SDS, 1% Triton X‐100, 2 mM EDTA, 20 mM Tris–HCl pH 8.0), followed by two times 5‐min incubation in high‐salt wash buffer (500 mM NaCl, 0.1% SDS, 1% Triton X‐100, 2 mM EDTA, 20 mM Tris–HCl pH 8.0). Finally, beads were washed in TE buffer (1 mM EDTA, 10 mM Tris–HCl pH 8.0). DNA elution, de‐cross‐linking, and purification steps were done using the IPure kit (Diagenode) following the manufacturer's protocol. The following antibodies were used in this study: antihistone H3 (Sigma, #H9289), anti‐H3K27me3 (Millipore, #07‐449, Billerica, Massachusetts), anti‐H3K9me2 (Diagenode, #pAb‐060‐050), and anti‐H3K27me1 (Diagenode, #pAB‐045‐050). ChIP qPCR was performed for selected genes and TEs marked by H3K27me3 in the endosperm (Appendix Fig S12; for primers see Table EV7). All experiments were performed in at least two biological replicates.
DNA extraction and bisulfite conversion
Endosperm DNA for bisulfite conversion was derived from INTACT‐purified nuclei of 150–300 mg of 4 DAP INT Col siliques. DNA was purified using MagJET Plant Genomic DNA kit (Thermo Fisher Scientific, Waltham, USA), eluted in 80 μl elution buffer (from the kit), and sonicated for 30 cycles (30 s on, 30 s off at high power) using a Bioruptor (Diagenode). The bisulfite conversion was done using the EpiTect Fast DNA Bisulfite Kit (Qiagen, Hilden, Germany) during the library preparation. Experiments were performed in biological replicates.
Library preparation and sequencing
Endosperm ChIP‐seq libraries were generated using the Microplex Library Preparation kit (Diagenode) following the manufacturer's protocol using 1 ng of starting material. Leaf ChIP‐seq libraries were generated using Ovation Ultralow Library System (NuGEN, San Carlos, USA) using 1 ng of starting material. Bisulfite libraries were generated using Ovation Ultralow Methyl‐Seq Library Systems (NuGEN) following the manufacturer's protocol using 10 ng of starting DNA. Libraries were sequenced at the SciLife Laboratory (Uppsala, Sweden) on an Illumina HiSeq2000 in 100‐bp or 124‐bp paired‐end fashion. Sequencing reads are deposited as fastq files in the Gene Expression Omnibus (GSE66585).
Analysis of ChIP‐seq and Bisulfite‐seq data
Reads passing a quality control were trimmed to 100 bp, pooled together replicate‐wise, and mapped to the Arabidopsis (TAIR10) genome using Bowtie (Langmead, 2010) in a single‐end mode allowing for up to two mismatches. Replicability was assessed by calculating the Pearson correlation coefficient (PCC) between biological replicates and their input samples (Bardet et al, 2012) using average read coverage values in 50‐bp windows across the whole genome (see below). The values were similar to the ones previously reported (Bardet et al, 2012) for high‐quality ChIP experiments (Table EV6).
Parental‐of‐origin alleles were identified by sorting reads with SNPsplit v0.2.0 (http://www.bioinformatics.babraham.ac.uk/projects/SNPsplit/). This was done by mapping all reads to a “N” masked genome for all the SNP positions between the TAIR10 Col and the Ler‐0 genomes with bowtie2 v2.1.0 (‐L 20 ‐N 1) and then sorting the reads based on the known SNP identity. Mapped reads were deduplicated and extended to the estimated average length of the genomic fragments (270 bp). Coverage was estimated and normalized to 10 million of reads. ChIP signals were normalized with H3 ChIP data by calculating the log2 ratio in 150‐bp bins across the genome. These data were standardized and normalized for comparative purposes across samples with a z‐score transformation (Cheadle et al, 2003). define enriched regions, we selected 150‐bp bins having a z‐score ≥ 1. Bins with low H3 coverage (≤ 1st quartile) and single isolated bins situated > 150 bp away from another bin were discarded. Enriched regions were defined by merging adjacent bins that passed the former selection steps. If two enriched regions were not more than 150 bp away from each other, they were merged into a single one. Overlapping enriched regions between samples in the analysis are always those overlapping at least 150 nucleotides. Genetic features (genes and TEs) marked by histone methylation are considered those overlapping any length with enriched regions. DME‐targeted regions were defined as those 50‐bp windows were the log twofold change in CG methylation between the dme mutant (Ibarra et al, 2012) and the wild type is > 1.5.
Bisulfite sequencing data were analyzed as previously described (Schatlowski et al, 2014).
Analysis of RNA‐seq data
Data from Ler x Col and Ler fie x Col crosses (Hsieh et al, 2011) were downloaded from the GEO omnibus. Data from Ler x Col and Ler fie x Col crosses (Hsieh et al, 2011) were downloaded from the GEO omnibus. Reads were mapped to the Arabidopsis (TAIR10) genome using TopHat v2.1.0 (Trapnell et al, 2009) (parameters adjusted as ‐g 1 ‐a 10 ‐i 40 ‐I 5000 ‐F 0 ‐r 130) and normalized to reads per kilobase per million mapped reads (RPKM). Parental‐of‐origin expression was calculated using the same approach described above for the ChIP‐seq analysis. The following datasets that were used in comparisons with the data generated in this study: methylation data in endosperm and dme endosperm were from (Schatlowski et al, 2014) and (Ibarra et al, 2012) (GSM952440), respectively, and RNA‐seq data of wild‐type and fie endosperm were from (Hsieh et al, 2011) (GSM607729 and GSM607732).
Author contributions
JMR and HJ executed the experimental procedures. JMR, JSG, and CK analyzed the data. JMR, HJ, and CK performed the experimental design. JMR and CK wrote the manuscript. All authors discussed the results and commented on the manuscript.
Conflict of interest
The authors declare that they have no conflict of interest.
Supporting information
Appendix
Table EV1
Table EV2
Table EV3
Table EV4
Table EV5
Table EV6
Table EV7
Review Process File
Acknowledgements
We thank Cecilia Wärdig for technical support. Sequencing was performed by the SNP&SEQ Technology Platform, Science for Life Laboratory at Uppsala University, a national infrastructure supported by the Swedish Research Council (VRRFI) and the Knut and Alice Wallenberg Foundation. This research was supported by a European Research Council Starting Independent Researcher grant (to CK), a grant from the Swedish Science Foundation (to CK), a grant from the Knut and Alice Wallenberg Foundation (to CK), and a grant from the Nilsson Ehle foundation (to JMR).
The EMBO Journal (2016) 35: 1298–1311
References
- Akiyama T, Suzuki O, Matsuda J, Aoki F (2011) Dynamic replacement of histone H3 variants reprograms epigenetic marks in early mouse embryos. PLoS Genet 7: e1002279 [DOI] [PMC free article] [PubMed] [Google Scholar]
- Arabidopsis Genome Initiative (2000) Analysis of the genome sequence of the flowering plant Arabidopsis thaliana . Nature 408: 796–815 [DOI] [PubMed] [Google Scholar]
- Ariel F, Jegu T, Latrasse D, Romero‐Barrios N, Christ A, Benhamed M, Crespi M (2014) Noncoding transcription by alternative RNA polymerases dynamically regulates an auxin‐driven chromatin loop. Mol Cell 55: 383–396 [DOI] [PubMed] [Google Scholar]
- Bardet AF, He Q, Zeitlinger J, Stark A (2012) A computational pipeline for comparative ChIP‐seq analyses. Nat Protoc 7: 45–61 [DOI] [PubMed] [Google Scholar]
- Belmonte MF, Kirkbride RC, Stone SL, Pelletier JM, Bui AQ, Yeung EC, Hashimoto M, Fei J, Harada CM, Munoz MD, Le BH, Drews GN, Brady SM, Goldberg RB, Harada JJ (2013) Comprehensive developmental profiles of gene activity in regions and subregions of the Arabidopsis seed. Proc Natl Acad Sci USA 110: 435–444 [DOI] [PMC free article] [PubMed] [Google Scholar]
- Bernatavichute YV, Zhang X, Cokus S, Pellegrini M, Jacobsen SE (2008) Genome‐wide association of histone H3 lysine nine methylation with CHG DNA methylation in Arabidopsis thaliana . PLoS One 3: e3156 [DOI] [PMC free article] [PubMed] [Google Scholar]
- Bouyer D, Roudier F, Heese M, Andersen ED, Gey D, Nowack MK, Goodrich J, Renou JP, Grini PE, Colot V, Schnittger A (2011) Polycomb repressive complex 2 controls the embryo‐to‐seedling phase transition. PLoS Genet 7: 1002014 [DOI] [PMC free article] [PubMed] [Google Scholar]
- Brinkman AB, Gu H, Bartels SJ, Zhang Y, Matarese F, Simmer F, Marks H, Bock C, Gnirke A, Meissner A, Stunnenberg HG (2012) Sequential ChIP‐bisulfite sequencing enables direct genome‐scale investigation of chromatin and DNA methylation cross‐talk. Genome Res 22: 1128–1138 [DOI] [PMC free article] [PubMed] [Google Scholar]
- Calarco JP, Borges F, Donoghue MT, Van Ex F, Jullien PE, Lopes T, Gardner R, Berger F, Feijo JA, Becker JD, Martienssen RA (2012) Reprogramming of DNA methylation in pollen guides epigenetic inheritance via small RNA. Cell 151: 194–205 [DOI] [PMC free article] [PubMed] [Google Scholar]
- Cheadle C, Vawter MP, Freed WJ, Becker KG (2003) Analysis of microarray data using Z score transformation. J Mol Diagn 5: 73–81 [DOI] [PMC free article] [PubMed] [Google Scholar]
- Choi Y, Gehring M, Johnson L, Hannon M, Harada JJ, Goldberg RB, Jacobsen SE, Fischer RL (2002) DEMETER, a DNA glycosylase domain protein, is required for endosperm gene imprinting and seed viability in Arabidopsis. Cell 110: 33–42 [DOI] [PubMed] [Google Scholar]
- Clough SJ, Bent AF (1998) Floral dip: a simplified method for agrobacterium‐mediated transformation of Arabidopsis thaliana . Plant J 16: 735–743 [DOI] [PubMed] [Google Scholar]
- Crevillen P, Sonmez C, Wu Z, Dean C (2013) A gene loop containing the floral repressor FLC is disrupted in the early phase of vernalization. EMBO J 32: 140–148 [DOI] [PMC free article] [PubMed] [Google Scholar]
- Deal RB, Henikoff S (2010) A simple method for gene expression and chromatin profiling of individual cell types within a tissue. Dev Cell 18: 1030–1040 [DOI] [PMC free article] [PubMed] [Google Scholar]
- Deleris A, Stroud H, Bernatavichute Y, Johnson E, Klein G, Schubert D, Jacobsen SE (2012) Loss of the DNA methyltransferase MET1 Induces H3K9 hypermethylation at PcG target genes and redistribution of H3K27 trimethylation to transposons in Arabidopsis thaliana . PLoS Genet 8: e1003062 [DOI] [PMC free article] [PubMed] [Google Scholar]
- Dong X, Reimer J, Gobel U, Engelhorn J, He F, Schoof H, Turck F (2012) Natural variation of H3K27me3 distribution between two Arabidopsis accessions and its association with flanking transposable elements. Genome Biol 13: R117 [DOI] [PMC free article] [PubMed] [Google Scholar]
- Du M, Luo M, Zhang R, Finnegan EJ, Koltunow AM (2014) Imprinting in rice: the role of DNA and histone methylation in modulating parent‐of‐origin specific expression and determining transcript start sites. Plant J 79: 232–242 [DOI] [PubMed] [Google Scholar]
- Farrona S, Thorpe FL, Engelhorn J, Adrian J, Dong X, Sarid‐Krebs L, Goodrich J, Turck F (2011) Tissue‐specific expression of FLOWERING LOCUS T in Arabidopsis is maintained independently of polycomb group protein repression. Plant Cell 23: 3204–3214 [DOI] [PMC free article] [PubMed] [Google Scholar]
- Gal‐Yam EN, Egger G, Iniguez L, Holster H, Einarsson S, Zhang X, Lin JC, Liang G, Jones PA, Tanay A (2008) Frequent switching of Polycomb repressive marks and DNA hypermethylation in the PC3 prostate cancer cell line. Proc Natl Acad Sci USA 105: 12979–12984 [DOI] [PMC free article] [PubMed] [Google Scholar]
- Gan X, Stegle O, Behr J, Steffen JG, Drewe P, Hildebrand KL, Lyngsoe R, Schultheiss SJ, Osborne EJ, Sreedharan VT, Kahles A, Bohnert R, Jean G, Derwent P, Kersey P, Belfield EJ, Harberd NP, Kemen E, Toomajian C, Kover PX et al (2011) Multiple reference genomes and transcriptomes for Arabidopsis thaliana . Nature 477: 419–423 [DOI] [PMC free article] [PubMed] [Google Scholar]
- Gehring M (2013) Genomic imprinting: insights from plants. Annu Rev Genet 47: 187–208 [DOI] [PubMed] [Google Scholar]
- Gehring M, Bubb KL, Henikoff S (2009) Extensive demethylation of repetitive elements during seed development underlies gene imprinting. Science 324: 1447–1451 [DOI] [PMC free article] [PubMed] [Google Scholar]
- Gehring M, Huh JH, Hsieh TF, Penterman J, Choi Y, Harada JJ, Goldberg RB, Fischer RL (2006) DEMETER DNA glycosylase establishes MEDEA Polycomb gene self‐imprinting by allele‐specific demethylation. Cell 124: 495–506 [DOI] [PMC free article] [PubMed] [Google Scholar]
- Goto K, Meyerowitz EM (1994) Function and regulation of the Arabidopsis floral homeotic gene pistillata. Genes Dev 8: 1548–1560 [DOI] [PubMed] [Google Scholar]
- Hollister JD, Gaut BS (2009) Epigenetic silencing of transposable elements: a trade‐off between reduced transposition and deleterious effects on neighboring gene expression. Genome Res 19: 1419–1428 [DOI] [PMC free article] [PubMed] [Google Scholar]
- Hsieh TF, Ibarra CA, Silva P, Zemach A, Eshed‐Williams L, Fischer RL, Zilberman D (2009) Genome‐wide demethylation of Arabidopsis endosperm. Science 324: 1451–1454 [DOI] [PMC free article] [PubMed] [Google Scholar]
- Hsieh TF, Shin J, Uzawa R, Silva P, Cohen S, Bauer MJ, Hashimoto M, Kirkbride RC, Harada JJ, Zilberman D, Fischer RL (2011) Regulation of imprinted gene expression in Arabidopsis endosperm. Proc Natl Acad Sci USA 108: 1755–1762 [DOI] [PMC free article] [PubMed] [Google Scholar]
- Ibarra CA, Feng X, Schoft VK, Hsieh TF, Uzawa R, Rodrigues JA, Zemach A, Chumak N, Machlicova A, Nishimura T, Rojas D, Fischer RL, Tamaru H, Zilberman D (2012) Active DNA demethylation in plant companion cells reinforces transposon methylation in gametes. Science 337: 1360–1364 [DOI] [PMC free article] [PubMed] [Google Scholar]
- Ingouff M, Hamamura Y, Gourgues M, Higashiyama T, Berger F (2007) Distinct dynamics of HISTONE3 variants between the two fertilization products in plants. Curr Biol 17: 1032–1037 [DOI] [PubMed] [Google Scholar]
- Jacob Y, Feng S, LeBlanc CA, Bernatavichute YV, Stroud H, Cokus S, Johnson LM, Pellegrini M, Jacobsen SE, Michaels SD (2009) ATXR5 and ATXR6 are H3K27 monomethyltransferases required for chromatin structure and gene silencing. Nat Struct Mol Biol 16: 763–768 [DOI] [PMC free article] [PubMed] [Google Scholar]
- Jullien PE, Susaki D, Yelagandula R, Higashiyama T, Berger F (2012) DNA methylation dynamics during sexual reproduction in Arabidopsis thaliana . Curr Biol 22: 1825–1830 [DOI] [PubMed] [Google Scholar]
- Köhler C, Page DR, Gagliardini V, Grossniklaus U (2005) The Arabidopsis thaliana MEDEA Polycomb group protein controls expression of PHERES1 by parental imprinting. Nat Genet 37: 28–30 [DOI] [PubMed] [Google Scholar]
- Köhler C, Wolff P, Spillane C (2012) Epigenetic mechanisms underlying genomic imprinting in plants. Annu Rev Plant Biol 63: 331–352 [DOI] [PubMed] [Google Scholar]
- Langmead B (2010) Aligning short sequencing reads with Bowtie. Curr Protoc Bioinformatics 32: 11.7 [DOI] [PMC free article] [PubMed] [Google Scholar]
- Law JA, Jacobsen SE (2010) Establishing, maintaining and modifying DNA methylation patterns in plants and animals. Nat Rev Genet 11: 204–220 [DOI] [PMC free article] [PubMed] [Google Scholar]
- Li J, Berger F (2012) Endosperm: food for humankind and fodder for scientific discoveries. New Phytol 195: 290–305 [DOI] [PubMed] [Google Scholar]
- Lu F, Cui X, Zhang S, Jenuwein T, Cao X (2011) Arabidopsis REF6 is a histone H3 lysine 27 demethylase. Nat Genet 43: 715–719 [DOI] [PubMed] [Google Scholar]
- Luo M, Bilodeau P, Dennis ES, Peacock WJ, Chaudhury A (2000) Expression and parent‐of‐origin effects for FIS2, MEA, and FIE in the endosperm and embryo of developing Arabidopsis seeds. Proc Natl Acad Sci USA 97: 10637–10642 [DOI] [PMC free article] [PubMed] [Google Scholar]
- Makarevich G, Villar CB, Erilova A, Köhler C (2008) Mechanism of PHERES1 imprinting in Arabidopsis. J Cell Sci 121: 906–912 [DOI] [PubMed] [Google Scholar]
- Makarevitch I, Eichten SR, Briskine R, Waters AJ, Danilevskaya ON, Meeley RB, Myers CL, Vaughn MW, Springer NM (2013) Genomic distribution of maize facultative heterochromatin marked by trimethylation of H3K27. Plant Cell 25: 780–793 [DOI] [PMC free article] [PubMed] [Google Scholar]
- Mathieu O, Probst AV, Paszkowski J (2005) Distinct regulation of histone H3 methylation at lysines 27 and 9 by CpG methylation in Arabidopsis. EMBO J 24: 2783–2791 [DOI] [PMC free article] [PubMed] [Google Scholar]
- Mozgova I, Hennig L (2015) The Polycomb Group Protein Regulatory Network. Annu Rev Plant Biol 66:269–296 [DOI] [PubMed] [Google Scholar]
- Numa H, Kim JM, Matsui A, Kurihara Y, Morosawa T, Ishida J, Mochizuki Y, Kimura H, Shinozaki K, Toyoda T, Seki M, Yoshikawa M, Habu Y (2010) Transduction of RNA‐directed DNA methylation signals to repressive histone marks in Arabidopsis thaliana . EMBO J 29: 352–362 [DOI] [PMC free article] [PubMed] [Google Scholar]
- Ohad N, Margossian L, Hsu Y‐C, Williams C, Fischer R (1996) A mutation that allows endosperm development without fertilization. Proc Natl Acad Sci USA 93: 5319–5324 [DOI] [PMC free article] [PubMed] [Google Scholar]
- Pignatta D, Erdmann RM, Scheer E, Picard CL, Bell GW, Gehring M (2014) Natural epigenetic polymorphisms lead to intraspecific variation in Arabidopsis gene imprinting. elife 3: e03198 [DOI] [PMC free article] [PubMed] [Google Scholar]
- Przybyla D, Gobel C, Imboden A, Hamberg M, Feussner I, Apel K (2008) Enzymatic, but not non‐enzymatic, 1O2‐mediated peroxidation of polyunsaturated fatty acids forms part of the EXECUTER1‐dependent stress response program in the flu mutant of Arabidopsis thaliana . Plant J 54: 236–248 [DOI] [PubMed] [Google Scholar]
- Puschendorf M, Terranova R, Boutsma E, Mao X, Isono K, Brykczynska U, Kolb C, Otte AP, Koseki H, Orkin SH, van Lohuizen M, Peters AH (2008) PRC1 and Suv39h specify parental asymmetry at constitutive heterochromatin in early mouse embryos. Nat Genet 40: 411–420 [DOI] [PubMed] [Google Scholar]
- Reddington JP, Perricone SM, Nestor CE, Reichmann J, Youngson NA, Suzuki M, Reinhardt D, Dunican DS, Prendergast JG, Mjoseng H, Ramsahoye BH, Whitelaw E, Greally JM, Adams IR, Bickmore WA, Meehan R (2013) Redistribution of H3K27me3 upon DNA hypomethylation results in de‐repression of Polycomb target genes. Genome Biol 14: R25 [DOI] [PMC free article] [PubMed] [Google Scholar]
- Roudier F, Ahmed I, Berard C, Sarazin A, Mary‐Huard T, Cortijo S, Bouyer D, Caillieux E, Duvernois‐Berthet E, Al‐Shikhley L, Giraut L, Despres B, Drevensek S, Barneche F, Derozier S, Brunaud V, Aubourg S, Schnittger A, Bowler C, Martin‐Magniette ML et al (2011) Integrative epigenomic mapping defines four main chromatin states in Arabidopsis. EMBO J 30:1928–1938 [DOI] [PMC free article] [PubMed] [Google Scholar]
- Saksouk N, Barth TK, Ziegler‐Birling C, Olova N, Nowak A, Rey E, Mateos‐Langerak J, Urbach S, Reik W, Torres‐Padilla ME, Imhof A, Dejardin J (2014) Redundant mechanisms to form silent chromatin at pericentromeric regions rely on BEND3 and DNA methylation. Mol Cell 56: 580–594 [DOI] [PubMed] [Google Scholar]
- Santenard A, Ziegler‐Birling C, Koch M, Tora L, Bannister AJ, Torres‐Padilla ME (2010) Heterochromatin formation in the mouse embryo requires critical residues of the histone variant H3.3. Nat Cell Biol 12: 853–862 [DOI] [PMC free article] [PubMed] [Google Scholar]
- Schatlowski N, Wolff P, Santos‐Gonzalez J, Schoft V, Siretskiy A, Scott R, Tamaru H, Köhler C (2014) Hypomethylated pollen bypasses the interploidy hybridization barrier in Arabidopsis. Plant Cell 26: 3556–3568 [DOI] [PMC free article] [PubMed] [Google Scholar]
- Schoft VK, Chumak N, Choi Y, Hannon M, Garcia‐Aguilar M, Machlicova A, Slusarz L, Mosiolek M, Park JS, Park GT, Fischer RL, Tamaru H (2011) Function of the DEMETER DNA glycosylase in the Arabidopsis thaliana male gametophyte. Proc Natl Acad Sci USA 108: 8042–8047 [DOI] [PMC free article] [PubMed] [Google Scholar]
- Simon JA, Kingston RE (2013) Occupying chromatin: polycomb mechanisms for getting to genomic targets, stopping transcriptional traffic, and staying put. Mol Cell 49: 808–824 [DOI] [PMC free article] [PubMed] [Google Scholar]
- Slotkin RK, Vaughn M, Borges F, Tanurdzic M, Becker JD, Feijo JA, Martienssen RA (2009) Epigenetic reprogramming and small RNA silencing of transposable elements in pollen. Cell 136: 461–472 [DOI] [PMC free article] [PubMed] [Google Scholar]
- Statham AL, Robinson MD, Song JZ, Coolen MW, Stirzaker C, Clark SJ (2012) Bisulfite sequencing of chromatin immunoprecipitated DNA (BisChIP‐seq) directly informs methylation status of histone‐modified DNA. Genome Res 22: 1120–1127 [DOI] [PMC free article] [PubMed] [Google Scholar]
- Stroud H, Otero S, Desvoyes B, Ramirez‐Parra E, Jacobsen SE, Gutierrez C (2012) Genome‐wide analysis of histone H3)1 and H3)3 variants in Arabidopsis thaliana . Proc Natl Acad Sci USA 109: 5370–5375 [DOI] [PMC free article] [PubMed] [Google Scholar]
- Trapnell C, Pachter L, Salzberg SL (2009) TopHat: discovering splice junctions with RNA‐Seq. Bioinformatics 25: 1105–1111 [DOI] [PMC free article] [PubMed] [Google Scholar]
- Turck F, Roudier F, Farrona S, Martin‐Magniette ML, Guillaume E, Buisine N, Gagnot S, Martienssen RA, Coupland G, Colot V (2007) Arabidopsis TFL2/LHP1 specifically associates with genes marked by trimethylation of histone H3 lysine 27. PLoS Genet 3: e86 [DOI] [PMC free article] [PubMed] [Google Scholar]
- Vaughn MW, Tanurdzic M, Lippman Z, Jiang H, Carrasquillo R, Rabinowicz PD, Dedhia N, McCombie WR, Agier N, Bulski A, Colot V, Doerge RW, Martienssen RA (2007) Epigenetic natural variation in Arabidopsis thaliana . PLoS Biol 5: e174 [DOI] [PMC free article] [PubMed] [Google Scholar]
- Villar C, Erilova A, Makarevich G, Trösch R, Köhler C (2009) Control of PHERES1 imprinting in Arabidopsis by direct tandem repeats. Mol Plant 2: 654–660 [DOI] [PubMed] [Google Scholar]
- Wang X, Weigel D, Smith LM (2013) Transposon variants and their effects on gene expression in Arabidopsis. PLoS Genet 9: e1003255 [DOI] [PMC free article] [PubMed] [Google Scholar]
- Weinhofer I, Hehenberger E, Roszak P, Hennig L, Köhler C (2010) H3K27me3 profiling of the endosperm implies exclusion of polycomb group protein targeting by DNA methylation. PLoS Genet 6: e1001152 [DOI] [PMC free article] [PubMed] [Google Scholar]
- Widschwendter M, Fiegl H, Egle D, Mueller‐Holzner E, Spizzo G, Marth C, Weisenberger DJ, Campan M, Young J, Jacobs I, Campan M, Young J, Jacobs I, Laird PW (2007) Epigenetic stem cell signature in cancer. Nat Genet 39: 157–158 [DOI] [PubMed] [Google Scholar]
- Wolff P, Weinhofer I, Seguin J, Roszak P, Beisel C, Donoghue MT, Spillane C, Nordborg M, Rehmsmeier M, Köhler C (2011) High‐resolution analysis of parent‐of‐origin allelic expression in the Arabidopsis endosperm. PLoS Genet 7: e1002126 [DOI] [PMC free article] [PubMed] [Google Scholar]
- Wollmann H, Holec S, Alden K, Clarke ND, Jacques PE, Berger F (2012) Dynamic deposition of histone variant H3.3 accompanies developmental remodeling of the Arabidopsis transcriptome. PLoS Genet 8: e1002658 [DOI] [PMC free article] [PubMed] [Google Scholar]
- Wright SI, Agrawal N, Bureau TE (2003) Effects of recombination rate and gene density on transposable element distributions in Arabidopsis thaliana . Genome Res 13: 1897–1903 [DOI] [PMC free article] [PubMed] [Google Scholar]
- Zhai J, Liu J, Liu B, Li P, Meyers BC, Chen X, Cao X (2008) Small RNA‐directed epigenetic natural variation in Arabidopsis thaliana . PLoS Genet 4: e1000056 [DOI] [PMC free article] [PubMed] [Google Scholar]
- Zhang M, Xie S, Dong X, Zhao X, Zeng B, Chen J, Li H, Yang W, Zhao H, Wang G, Chen Z, Sun S, Hauck A, Jin W, Lai J (2014) Genome‐wide high resolution parental‐specific DNA and histone methylation maps uncover patterns of imprinting regulation in maize. Genome Res 24: 167–176 [DOI] [PMC free article] [PubMed] [Google Scholar]
- Zhang X, Clarenz O, Cokus S, Bernatavichute YV, Pellegrini M, Goodrich J, Jacobsen SE (2007) Whole‐genome analysis of histone H3 lysine 27 trimethylation in Arabidopsis. PLoS Biol 5: e129 [DOI] [PMC free article] [PubMed] [Google Scholar]
- Ziolkowski PA, Koczyk G, Galganski L, Sadowski J (2009) Genome sequence comparison of Col and Ler lines reveals the dynamic nature of Arabidopsis chromosomes. Nucleic Acids Res 37: 3189–3201 [DOI] [PMC free article] [PubMed] [Google Scholar]
Associated Data
This section collects any data citations, data availability statements, or supplementary materials included in this article.
Supplementary Materials
Appendix
Table EV1
Table EV2
Table EV3
Table EV4
Table EV5
Table EV6
Table EV7
Review Process File