Abstract
Speech perception varies widely across cochlear implant (CI) users and typically improves over time after implantation. There is also some evidence for improved auditory evoked potentials (shorter latencies, larger amplitudes) after implantation but few longitudinal studies have examined the relationship between behavioral and evoked potential measures after implantation in postlingually deaf adults. The relationship between speech perception and auditory evoked potentials was investigated in newly implanted cochlear implant users from the day of implant activation to 9 months postimplantation, on five occasions, in 10 adults age 27 to 57 years who had been bilaterally profoundly deaf for 1 to 30 years prior to receiving a unilateral CI24 cochlear implant. Changes over time in middle latency response (MLR), mismatch negativity, and obligatory cortical auditory evoked potentials and word and sentence speech perception scores were examined. Speech perception improved significantly over the 9-month period. MLRs varied and showed no consistent change over time. Three participants aged in their 50s had absent MLRs. The pattern of change in N1 amplitudes over the five visits varied across participants. P2 area increased significantly for 1,000- and 4,000-Hz tones but not for 250 Hz. The greatest change in P2 area occurred after 6 months of implant experience. Although there was a trend for mismatch negativity peak latency to reduce and width to increase after 3 months of implant experience, there was considerable variability and these changes were not significant. Only 60% of participants had a detectable mismatch initially; this increased to 100% at 9 months. The continued change in P2 area over the period evaluated, with a trend for greater change for right hemisphere recordings, is consistent with the pattern of incremental change in speech perception scores over time. MLR, N1, and mismatch negativity changes were inconsistent and hence P2 may be a more robust measure of auditory plasticity in adult implant recipients. P2 was still improving at 9 months postimplantation. Future studies should explore longitudinal changes over a longer period.
Keywords: Cochlear implant, speech perception, middle latency response, cortical auditory evoked potential, N1, P2, mismatch negativity
Learning Outcomes: As a result of this activity, the participant will be able to describe the effects of deafness and cochlear implantation on a range of evoked potentials and changes in speech perception and evoked potentials over time after implantation in postlingually deaf adults.
There is now extensive literature documenting the effectiveness of cochlear implants (CIs) in restoring speech perception abilities to postlingually deaf adults.1 Results continue to vary across participants, however. Early CI studies identified factors such as duration of deafness, residual hearing, and age at which profound deafness occurred as key factors affecting outcomes.2 3 4 A recent CI study showed that the effects of age at CI and age at onset of severe to profound hearing loss are less significant in younger CI recipients and that the effect of CI experience is greater.1 Early CI studies showed that in adults the level of speech perception performance measured immediately after implantation is about half that achieved eventually; on average speech recognition reached an asymptote 30 to 40 months after implantation.5 Gray et al found that for adults who took part in 10 hours of auditory training after the activation of the CI, the majority of the improvement occurred within the first 9 months after implantation.6 Changes in auditory evoked potentials may be more rapid than these reported changes in speech perception.7 A multicenter review by Blamey et al of 800 postlingually deaf adults showed that performance increased with duration of implant experience up to 3.5 years after implantation, with most change occurring within the first year of experience.1
The current study was undertaken to determine if changes in behavioral performance over time correspond to changes in electrophysiologic measures of auditory processing in a small group of postlingually deaf adults receiving a CI. The association between speech perception and auditory evoked potential measures (latencies, amplitudes) has been shown in cross-sectional group studies and longitudinal case studies of adult CI users,4 8 9 10 11 12 13 14 15 16 17 but there is limited published group data showing evoked potential and behavioral changes over time in adult CI users.7 18 Middle latency response (MLR), obligatory cortical auditory evoked potentials (CAEPs), and mismatch negativity (MMN) auditory evoked potentials were measured and compared with speech perception scores recorded during the week the CI was activated and at 1, 3, 6, and 9 months postimplantation.
The MLR consists of a series of negative and positive peaks (Na, Pa, Nb, Pb) occurring 10 to 80 milliseconds after stimulus onset. Jerger et al described the MLR as potentially “the single most important auditory evoked response in terms of its ability to help us identify, and understand CAPD [central auditory processing disorder],”19 and hence the MLR is of interest in studying auditory plasticity after cochlear implantation. Although Jerger et al highlighted the MLR as an important measure in the auditory evoked potential test battery, relatively few recent studies have examined the MLR in CI or other populations. Significant correlations between electrically evoked MLR amplitudes and speech perception scores have been reported for adult CI users.11 Groenen et al reported more variable electrically evoked MLR latencies and amplitudes in postlingually deaf adults with poorer speech perception.20 A study by Nelson et al on optimal MLR stimulus and recording parameter found that Pb (equivalent to P1 cortical potential) was optimized by using a relatively long duration, low-frequency tone burst, and a slow repetition rate, and MLR was evoked using these stimulus parameters in the current study.21
Obligatory CAEPs consist of a series of vertex positive and negative peaks (P1, N1, P2) that can be elicited by a range of stimuli. Due to the dominance of P1 in the immature CAEP waveform, P1 has been widely studied in children after cochlear implantation,22 23 but studies of adult CI users have focused on N1 and P2. CAEP investigations of adults using CIs have used clicks,24 tonal,7 8 14 15 18 19 25 and speech8 25 acoustic stimuli or direct electrical stimulation of the implant.11 12 14 Adults with late-onset deafness have P1-N1-P2 responses that resemble those of adults with normal hearing,24 although latencies may be prolonged and amplitudes reduced.4 22 Immature or atypical CAEP waveforms have been reported in young adults who were deaf from infancy.26 Lammers et al found variable CAEP morphology in adults with onset of deafness before and after 2 years of age who received their CIs as adults (age 21 to 75 years).15 27 N1 and P2 latencies and amplitudes differed across electrodes in both early (<2 years) and later-onset groups, with smallest responses basally and largest responses apically.
Sandmann et al reported rapid changes in N1 in postlinguistically deaf CI users (n = 11) who were followed for 59 weeks after implantation.7 Auditory discrimination of complex tonal stimuli, speech perception, and N1 latency and amplitude stabilized at 8 weeks postimplantation. Pantev et al found that the N1m measured using magnetoencephalography developed within a variable period in two adult CI users (patient 2, 15 years of variable hearing loss preimplant; patient 1, 27 years progressive hearing loss preimplant), based on comparison with control group waveforms.14 For patient 2 who had a progressive hearing loss, N1m stabilized after 6 weeks; for patient 1, N1m stabilized after 6 months. Burdo et al found that N1 and P2 latencies decreased at 3 and 12 months after implant activation in adults with acquired deafness implanted between the ages of 21 and 70 years (n = 11).18 These studies have shown latency and amplitude changes for N1 and P2 during the year following implantation but changes vary across participants. The effect of implant experience on CAEPs was investigated in the current study using tonal stimuli delivered acoustically to adults with postlinguistic onset of profound deafness.
MMN is a discriminative cortical evoked potential elicited using an oddball paradigm in which deviant stimuli are embedded randomly in a train of frequent, standard stimuli. MMN is elicited by any discernible change in a repetitive sound regardless of whether the listener attends to the stimulus or not and hence is potentially a useful objective indicator of auditory processing in CI users. Reduced MMN amplitudes have been reported in CI users with poorer speech perception but not consistently.25 28 29 30 31 32 MMN latencies are increased and detectability of MMN is reduced in CI users with poorer auditory perceptual abilities such as perception of timbre and spectral differences and musical pitch.30 33 34 MMN can be elicited by frequency contrasts as small as 5 to 10 Hz for a 1,000-Hz standard stimulus in listeners with normal hearing.35 Larger-frequency contrasts for acoustic stimuli or basal versus apical electrode contrasts have been used to elicit MMN to pitch change in CI users.10 36 In the current study, MMN was recorded to tonal stimuli with frequency differences of 250 to 500 Hz.
There is substantial evidence for cortical tonotopic reorganization after deafness.37 Changes in speech perception scores obtained on the day of CI activation and at 1, 3, 6, and 9 months postimplantation were compared with MLR, CAEP, and MMN recordings obtained on the same day to determine whether these evoked potential measures are sensitive to the central auditory changes associated with enhanced speech perception in adult CI users. It was hypothesized that (1) all evoked potentials would show change after implantation and that these changes would be associated with improvements in speech perception scores, (2) greater CAEP change would be evident for high-frequency tones as participants had better pre-CI low-frequency residual hearing (based on their pre-CI audiograms), (3) CAEP changes would vary across electrode montage, and (4) changes in MMN after implantation evoked by frequency contrasts would reflect changes in frequency coding in the cortex (expanded high-frequency representation) that are thought to occur after implantation.
Methods
Participants
Participants were four men and six women with unilateral CI24 Cochlear™ Nucleus® CI24 (Sydney, Australia) CIs. Average age at implantation was 43.1 years (range 27 to 57 years, standard deviation [SD] 12.0). Average duration of profound deafness prior to implantation was 6.7 years (range 1 to 30 years, SD 8.7). Only two participants received left ear implants. None of the participants wore a hearing aid in their nonimplanted ear.
Procedure
Participants were tested on five occasions after implantation, during the week that the CI was activated and 1, 3, 6, and 9 months after implantation. Participant 3 did not attend his 6-month appointment and participant 9 died prior to the 6-month appointment. Thus, 10 participants were seen at CI activation and 1 and 3 months postimplantation, 8 participants were seen at 6 months postimplantation, and 9 participants were seen at 9 months postimplantation. Speech perception scores and MLR, obligatory CAEPs, and MMN auditory evoked potentials were measured on each occasion during a single session.
Speech Perception
Speech materials and acoustic stimuli for the evoked potential testing were presented via a loudspeaker placed at ear level, 90 degrees azimuth on the CI side and 50 cm from the ear. Speech perception was evaluated using Hearing in Noise Test (HINT) sentence lists and Consonant-Nucleus-Consonant (CNC) word lists,38 39 rerecorded using a male native speaker of New Zealand English. Speech materials were delivered auditory alone at 70-dB sound pressure level (linear weighted). The audio recording was played through a video TV (SHARP Corporation VT-3428X, Osaka, Japan), amplified (AUDIOTELEX IC30 (Australian Monitor, Victoria, Australia)) and then delivered through a loudspeaker (Wharfedale International Ltd, Modus one, Kingsgrove, NSW, Australia).
Auditory Evoked Potentials
The Neuroscan STIM (Abbotsford, Victoria, Australia) system was used to generate acoustic stimuli (Table 1) and the Neuroscan SCAN system interfaced with Grass Model 12A5 (Warwick, RI) amplifiers was used for recording evoked potentials. Each Grass amplifier had a custom-built radiofrequency filter on the front end to reduce CI radiofrequency stimulus artifact. Ag-AgCl surface electrodes were used and impedances were kept below 3 kOhms.
Table 1. AEP Stimulus and Recording Parameters.
| AEP | Total Duration (ms) | Rise/Fall (ms) | Frequency (Hz) | Rate (/s) or ISI (ms) | Number of Sweeps | Recording Filter (Hz) |
|---|---|---|---|---|---|---|
| MLR | 10 | 4 | 500 | 8.7/s | 2 × 250 | 3–300 |
| CAEP | 60 | 20 | 250, 1,000, 4,000 | 1.1/s | 2 × 100 | 1–100 |
| MMN | 60 | 20 | Frequent =1,000; small dev = 1,250*; large dev = 1,500† | 600 ms | 800 (80%); 100 (10%); 100 (10%) | 0.1–100 |
Abbreviations: AEP, auditory evoked potential; CAEP, cortical auditory evoked potential; dev, deviant stimulus in oddball paradigm; ISI, interstimulus interval; MLR, middle latency response; MMN, mismatch negativity.
Small = 250-Hz frequency change (relative to standard).
Large = 500-Hz frequency change (relative to standard).
All evoked responses were amplified with a gain of 50,000 and sampled at 2,048 Hz. Eyeblink activity was monitored in one recording channel by the placement of electrodes at the lateral canthus and below the eye opposite to the implant side. Five evoked potential recording channels were used (Fz, Cz, Pz, C3, C4). For MLR and CAEP recordings, noninverting electrodes were placed at Fz and Cz. These were referenced to the contralateral earlobe to minimize CI stimulus artifact. Artifact reject levels were ± 50 µV for all evoked potential recordings. MLR responses were post hoc digitally low-pass filtered at 200 Hz (12 dB/octave) to aid in peak identification; the time window was 80 milliseconds, with a 3-millisecond prestimulus baseline. For CAEP recordings, the responses were post hoc digitally low-pass filtered at 30 Hz (12 dB/octave); the time window was 400 milliseconds, with a 100-millisecond prestimulus baseline.
Participants were seated comfortably in a reclining chair and watched silent subtitled videos. They were encouraged to remain alert and to stay awake. Prior to the recording session, listening levels for the evoked potential stimuli were set to a “loud, but OK” level for individual participants using the Independent Hearing Aid Fitting Forum Contour Test 7-point rating scale.40 Stimulus sound pressure levels ranged from 83 to 113 dB ppeSPL peak-to-peak sound pressure level. MMN was recorded first to ensure participants were alert, followed by MLR, and finally CAEP recordings. For MMN recordings, the levels for the deviant stimuli were the same as for the frequent stimuli.
For MMN, an oddball paradigm was used to present the stimuli. There were 1,000 stimulus presentations in pseudorandom order. The first 20 stimulus presentations were all frequent stimuli to build a strong memory trace of this stimulus. There was a minimum of three standard stimuli between each deviant stimulus. A 500-millisecond recording-time window was used that included a 100-millisecond prestimulus baseline. For MMN recordings, noninverting electrodes were placed at the midline sites Fz, Cz, and Pz, referenced to the contralateral earlobe. Prior to testing, participants' frequency allocation tables were checked to ensure standard and deviant tone bursts stimulated different electrodes. All participants could behaviorally discriminate the standard and deviant stimuli. The artifact reject level was set at ± 75 µV. MMN was judged to be present if there was an area of negativity present on the deviant waveform caused by the deviant waveform crossing the frequent waveform at a latency no earlier than the latency of the N1 cortical peak for the individual participant.
Results
Speech Perception
Average speech scores are presented in Fig. 1 for HINT sentences and CNC words and phonemes for the five visits (activation week and 1, 3, 6, and 9 months after implantation). Repeated-measures analysis of variance showed an improvement in scores over time for all three speech measures: F(4, 28) = 13.61, p < 0.001 for HINT sentences; F(4, 24) = 14.31, p < 0.001 for CNC word scores; F(4, 24) = 26.81, p < 0.001 for CNC phoneme scores.
Figure 1.
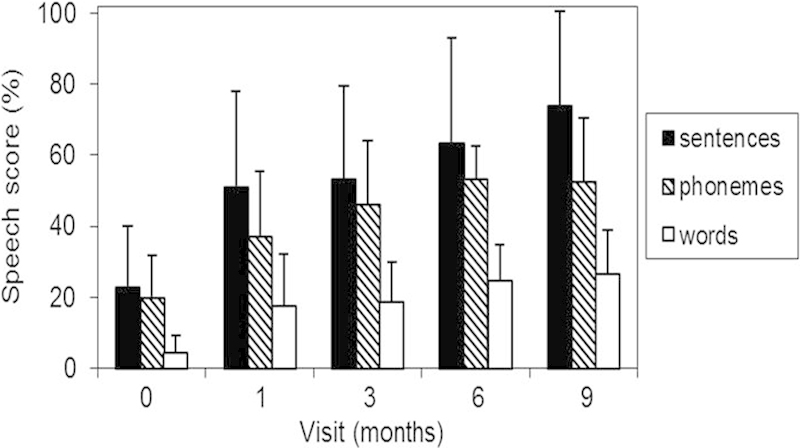
Hearing in Noise Test (HINT) sentences and Consonant-Nucleus-Consonant (CNC) words/phonemes perception scores (% correct) for the five test occasions. Error bars indicate standard deviations. N = 10, with the exception of the 6- and 9-month data for which N = 8 and 9, respectively.
Auditory Evoked Potentials
MLR morphology varied across individuals but was consistent across visits for each participant. Some individual MLR waveforms contained a large artifact (below 20 milliseconds), but it was possible to identify a small amplitude Pa peak in the MLR waveform at 25 to 50 milliseconds for seven of the participants. Fig. 2 shows the MLR recorded at each visit for a 45-year-old participant who was profoundly deaf for 2 years before receiving a CI. This participant's final HINT score was 49%. One-way repeated-measures analysis of variance on the group data revealed no significant changes over time for MLR latencies and amplitudes (p > 0.05). The waveforms were classified into three groups (Table 2). The sample size is small, but Table 2 shows that the five participants with typical MLR morphology tended to be younger. There is no clear association between MLR characteristics and speech perception outcomes.
Figure 2.
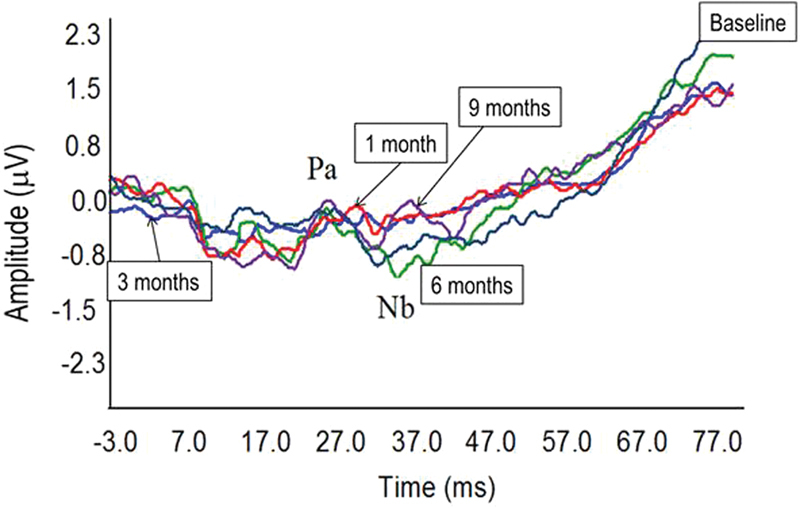
Individual middle latency response (MLR) waveforms for the 45-year-old participant recorded over the five visits (cochlear implant activation/baseline, 1 month, 3 months, 6 months, 9 months). MLR amplitude is small and variable and shows no systematic improvement over time. The x-axis shows time in milliseconds (from −3 to +77 milliseconds). The y-axis shows voltage in microvolts.
Table 2. Speech Perception, Age, and Duration of Hearing Loss for Individual Participants Grouped According to Their Patterns of MLR Results.
| MLR Morphology | n | HINT Sentence Score, 9 mo (%) | Age (y) | Duration of Profound Hearing Loss (y) |
|---|---|---|---|---|
| Typical | 5 | 97, 90, 75, 74, 49 | 34, 37, 26, 29, 45 | 2–10 |
| Late broad | 2 | 11, 84 | 36, 55 | 30, 1 |
| Absent | 3 | 19, 62, 79 | 51, 59, 57 | 1, 5, 10 |
Abbreviations: HINT, hearing in noise test; MLR, middle latency response.
CAEPs (N1 and P2) varied across participants but generally improved with time, particularly for higher frequencies. For some participants, CAEPs were absent initially for some stimuli and did not improve after implantation (see examples in Fig. 3). Overall, N1 latencies and amplitudes did not change significantly over time. Between the initial and final CAEP measures, the pattern of N1 changes varied greatly across participants (Fig. 4).
Figure 3.
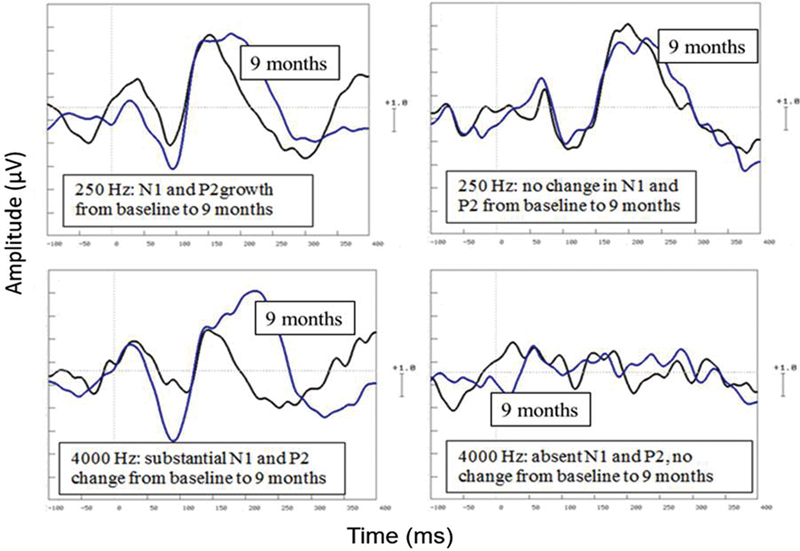
Individual cortical auditory evoked potential waveforms to 250 Hz (top) and 4,000 Hz (bottom) tones showing different patterns of results, comparing baseline recordings at the time of CI activation to recordings at 9 months (labeled). The x-axis shows time in milliseconds (from −100 to +400 milliseconds). The y-axis shows voltage in microvolts (1 scale unit = 1 μV).
Figure 4.
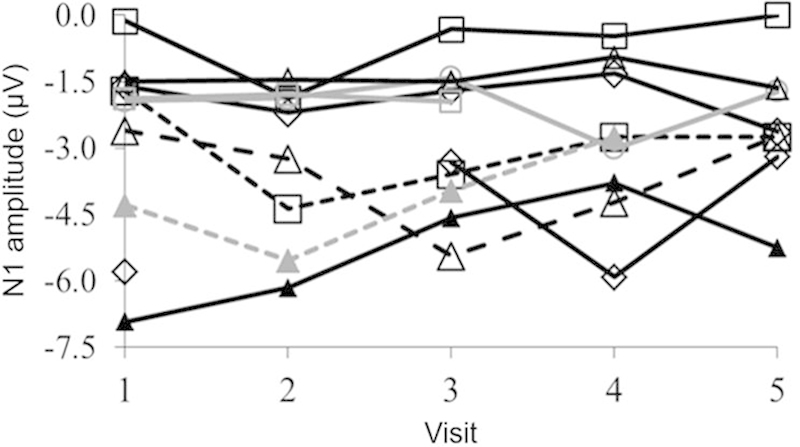
Individual N1 amplitudes (in microvolts) across the five visits (1 = baseline, 2 = 1 month, 3 = 3 months, 4 = 6 months, 5 = 9 months) showing considerable variability across participants.
P2 latencies did not change significantly over time (p > 0.05). Because P2 became wider as well as larger over time (see example in Fig. 3), peak areas rather than peak amplitudes were measured (using Neuroscan software). Fig. 5 shows P2 areas for 1,000- and 4,000-Hz stimuli, for different electrode montages and different visits. As these was a different pattern of results across stimuli separate two-way (electrode montage ×4, time ×5) repeated-measures analysis of variance were conducted for the three stimuli. P2 areas increased over time for 1,000- and 4,000-Hz but not 250-Hz stimuli (p < 0.05). P2 areas were compared between electrodes using planned comparisons. There was a significant electrode montage effect for P2 area (Fz > C4, p = 0.012; Cz > C4, p = 0.001; Fz > C3, p = 0.010). The electrode montage effect on P2 area, with larger areas at midline electrodes (Cz, Fz) compared with hemispheric electrodes (C3, C4), was also evident at 1,000 Hz (Fz > C4, p = 0.001; Cz > C4, p = 0.001; Fz > C3, p = 0.001) and 4,000 Hz (Fz > C4, p = 0.010; Cz > C4, p = 0.001; Fz > C3, p = 0.010).
Figure 5.
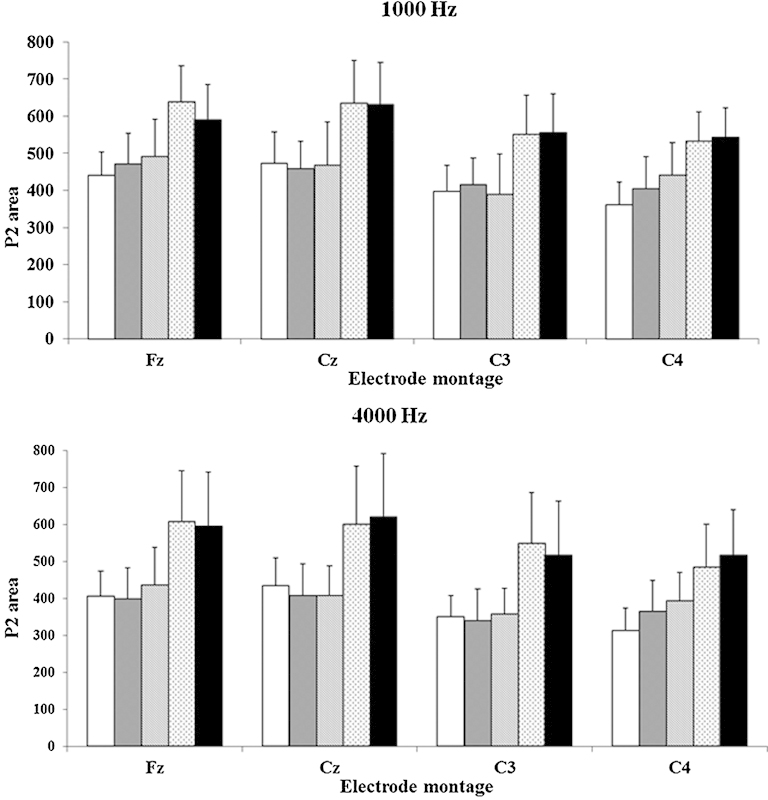
Average P2 area (microvolt × milliseconds) measured at baseline (cochlear implant activation) and 1, 3, 6, and 9 months (from left to right) for each electrode montage for 1,000- and 4,000-Hz stimuli. Error bars indicate standard deviations.
Fig. 5 shows P2 area growth over time, particularly for visits 4 and 5 (6 and 9 months). P2 area showed consistent growth over time over the right hemisphere (C4), which was ipsilateral to the CI for the eight participants with right-sided CIs. For the 1,000-Hz stimulus, baseline P2 areas were significantly smaller than those recorded at 1, 3, 6, and 9 months (p < 0.05), indicating ongoing enhancement of P2 area over time, consistent with the steady improvement in speech perception scores over the 9 months. At 4,000-Hz P2 areas also showed a significant overall increase across visits, but planned comparisons showed fewer differences between visits (1 month < 6 months, p = 0.050; baseline < 1 month, p = 0.030).
Sixty percent of participants had a recordable MMN at the time of CI activation. At 9 months postimplantation, this had increased to 100% of participants. Fig. 6 shows the baseline versus 9-month MMN waveforms for one participant with no MMN initially who showed substantial MMN growth. Responses to the standard (1,000 Hz) and deviant (1,500 Hz) stimuli are shown. These overlap initially but show greater negativity at 6 and 9 months for the deviant stimulus, as the MMN becomes apparent. Fig. 7 illustrates the trend for reduced MMN peak latencies and increased MMN width, up until 3 to 6 months after implantation. As shown by the large error bars, there was considerable variability between participants, with some showing steady improvement, whereas others showed no change in their MMN. On average MMN improved over time (peak latency reduced, peak amplitude, and width increased), but changes over visits were not statistically significant (p > 0.05).
Figure 6.
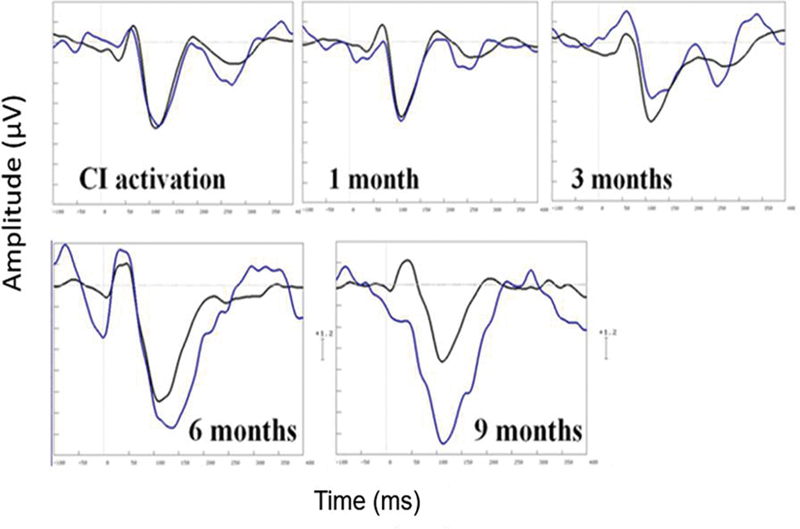
Individual mismatch negativity waveforms for standard 1,000 Hz (black) and deviant (1,500 Hz) stimuli recorded at Fz in one participant (age 37 years, duration of profound deafness 2 years) with a right-side cochlear implant (CI). The x-axis shows time in milliseconds (from −100 to +400 milliseconds). The y-axis shows voltage in microvolts (1 scale unit = 1.2 μV).
Figure 7.
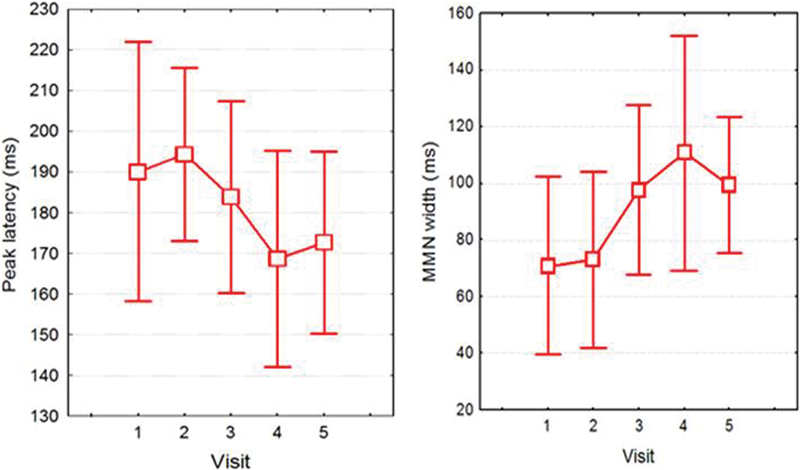
Average mismatch negativity (MMN) latencies (left) and width (right; both in milliseconds) recorded at baseline (CI activation) and 1, 3, 6, and 9 months postimplantation (visits 1, 2, 3, 4, 5, respectively). Error bars indicate 95% confidence intervals.
Discussion
This study investigated changes in speech perception and evoked potentials in a small group of postlingually deaf adults from the week their implant was activated until 9 months after implantation. As seen in other CI studies, speech perception scores improved significantly over time and were better for sentences than for words and phonemes.1 4 41 42 There was no measureable MLR in some participants, and the MLR resembled the typical adult acoustic MLR in other participants, consistent with Firszt et al.11 43 Firszt et al were able to record more reliable MLRs across their 11 adult CI users with less contamination of the waveforms by electrical artifact than was seen in the current study.43 The use of a relatively long acoustic stimulus in the current study compared with brief electrical stimulation probably accounts for this difference.11
Although the obligatory CAEPs showed significant group changes in P2 area over the 9-month period, N1 amplitude and latency changes varied across individuals. In contrast to the current study, Sandmann et al reported rapid, statistically significant changes in N1 latencies (reaching a plateau at 8 weeks) and slower changes in N1 amplitudes (increases stabilized at 15 weeks) in a group of postlingually deaf CI users using a single CI (four left ears).7 Their participants were age 35 to 78 years (mean 58, SD 17), so were slightly older on average and had a wider range of ages than those in the current study (range 27 to 57 years, mean 43, SD 12). Average duration of profound deafness prior to implantation was less in the current study (mean 6.7 years, range 1 to 30 years, SD 8.7) than in the study by Sandmann et al (mean 16.6 years, range 1 to 51 years, SD 17.4). It is not clear how these participant differences would explain the differences in findings, so it may be that the use of more complex tonal stimuli (frequency-modulated sweeps corresponding to 1 semitone, 12 semitones, and 18 semitones in the Western musical scale) by Sandmann et al is responsible for the systematic improvements in N1 that they observed. Stimulus-specific changes in N1 associated with perceptual learning were reported by Alain and colleagues, who measured behavioral discrimination of speech sounds at the same time as recording N1-P2 obligatory cortical responses during a single session in young adults with normal hearing.44 N1 amplitude decreased across blocks of discrimination training, but there were greater N1 changes for the noise than for the consonant-vowel speech stimuli. Using the same consonant-vowel stimuli, Tremblay et al studied the link between pretraining N1 amplitude and training-related changes in behavioral discrimination accuracy.45 There was a trend for “nonlearners” (n = 3) to have smaller baseline N1 amplitudes that increased post-training with no change in P2, and “learners” (n = 10) to show reduced N1 and increased P2 amplitudes post-training, suggesting that N1 (and P2) may relate to individual differences in perceptual learning.
The most robust change in evoked potentials post-CI in the current study was the enhancement of P2 area that was evident for the 1,000- and 4,000-Hz tonal stimuli (but not 250 Hz). A systematic increase in P2 area occurred at the C4 electrode (ipsilateral to the CI for all but one participant). Changes in P2 were not evident at other electrode locations until 6 months post-CI, at which point P2 area increased significantly and then remained stable. This trend for different patterns of evoked potential change across the scalp suggests some change in auditory processing organization in the two hemispheres after the introduction of a single-sided CI in bilateral deafness. Animal and human studies show that unilateral deafness or a single-sided CI alters the balance of bilateral auditory inputs, resulting in altered hemispheric asymmetry.46 47 Sandmann et al performed waveform source analyses on their 96-channel electroencephalogram data to determine whether sources changed over time post-CI and found that both ipsilateral and contralateral (to the CI) sources increased in amplitude after the CI, with the change occurring only up to 15 weeks after the CI (these results did not differ from the 59-week data).7 Few studies have focused solely on P2 amplitude changes after implantation; most have reported N1-P2 amplitudes.11 48 Kelly et al found shorter P2 latencies in participants with better speech scores (r = − 0.629, p = .029), as did Makhdoum et al (r = − .64, p < 0.001).4 48 The results for P2 area for the current study suggest that it would be valuable to separately analyze N1 and P2 in future studies and to measure P2 area as well as latencies.
MMN results did show trends for reducing latency, bigger amplitude and width, and better detectability over time, but none of these changes were statistically significant. The small sample size and large MMN intersubject variability presumably contributed to these negative findings. Interestingly, the data (Fig. 7) suggest that most change in MMN to frequency contrasts occurs between 1 and 6 months and that there is a different time course for MMN change compared with N1 and P2. P2 showed systematic growth at the C4 electrode site from activation to 9 months post-CI. Improved detectability of MMN evoked by frequency contrasts from 60% at activation to 100% at 9 months post-CI is consistent with alterations in pitch perception over time that occur in CI users. For example, Reiss et al found that electric pitch perception can shift by as much as two octaves during the first few years of CI use.49
This study sought to determine whether MLR, CAEP, and MMN auditory evoked responses to simple tonal stimuli were sensitive to the changes in central auditory organization that underlie the substantial improvements in speech perception typically observed in the first year after postlingually deaf adults receive a CI. MLR, N1, and MMN did not show significant improvements over the 9-month period participants were followed, but P2 area did. Future research with a larger subject group, more complex stimuli, concurrent psychophysical and evoked potential measurements, and CAEP recordings from multiple scalp locations so that source localization is possible may help to better delineate the time course and bases for auditory plasticity after implantation in postlingually deaf adults.
Acknowledgment
This research was supported by a grant from the Deafness Research Foundation of New Zealand.
References
- 1.Blamey P, Artieres F, Başkent D. et al. Factors affecting auditory performance of postlinguistically deaf adults using cochlear implants: an update with 2251 patients. Audiol Neurootol. 2013;18(1):36–47. doi: 10.1159/000343189. [DOI] [PubMed] [Google Scholar]
- 2.Blamey P J, Pyman B C, Gordon M. et al. Factors predicting postoperative sentence scores in postlinguistically deaf adult cochlear implant patients. Ann Otol Rhinol Laryngol. 1992;101(4):342–348. doi: 10.1177/000348949210100410. [DOI] [PubMed] [Google Scholar]
- 3.Gantz B J, Woodworth G G, Knutson J F, Abbas P J, Tyler R S. Multivariate predictors of audiological success with multichannel cochlear implants. Ann Otol Rhinol Laryngol. 1993;102(12):909–916. doi: 10.1177/000348949310201201. [DOI] [PubMed] [Google Scholar]
- 4.Kelly A S, Purdy S C, Thorne P R. Electrophysiological and speech perception measures of auditory processing in experienced adult cochlear implant users. Clin Neurophysiol. 2005;116(6):1235–1246. doi: 10.1016/j.clinph.2005.02.011. [DOI] [PubMed] [Google Scholar]
- 5.Tyler R S Summerfield A Q Cochlear implantation: relationships with research on auditory deprivation and acclimatization Ear Hear 199617(3, Suppl):38S–50S. [DOI] [PubMed] [Google Scholar]
- 6.Gray R F, Quinn S J, Court I, Vanat Z, Baguley D M. Patient performance over eighteen months with the Ineraid intracochlear implant. Ann Otol Rhinol Laryngol Suppl. 1995;166:275–277. [PubMed] [Google Scholar]
- 7.Sandmann P, Plotz K, Hauthal N, de Vos M, Schönfeld R, Debener S. Rapid bilateral improvement in auditory cortex activity in postlingually deafened adults following cochlear implantation. Clin Neurophysiol. 2015;126(3):594–607. doi: 10.1016/j.clinph.2014.06.029. [DOI] [PubMed] [Google Scholar]
- 8.Groenen P A, Beynon A J, Snik A F, van den Broek P. Speech-evoked cortical potentials and speech recognition in cochlear implant users. Scand Audiol. 2001;30(1):31–40. doi: 10.1080/010503901750069554. [DOI] [PubMed] [Google Scholar]
- 9.Maurer J, Collet L, Pelster H, Truy E, Gallégo S. Auditory late cortical response and speech recognition in Digisonic cochlear implant users. Laryngoscope. 2002;112(12):2220–2224. doi: 10.1097/00005537-200212000-00017. [DOI] [PubMed] [Google Scholar]
- 10.Beynon A J, Snik A F. Use of the event-related P300 potential in cochlear implant subjects for the study of strategy-dependent speech processing. Int J Audiol. 2004;43 01:S44–S47. [PubMed] [Google Scholar]
- 11.Firszt J B, Chambers And R D, Kraus N. Neurophysiology of cochlear implant users II: comparison among speech perception, dynamic range, and physiological measures. Ear Hear. 2002;23(6):516–531. doi: 10.1097/00003446-200212000-00003. [DOI] [PubMed] [Google Scholar]
- 12.Lammers M J, Versnel H, van Zanten G A, Grolman W. Altered cortical activity in prelingually deafened cochlear implant users following long periods of auditory deprivation. J Assoc Res Otolaryngol. 2015;16(1):159–170. doi: 10.1007/s10162-014-0490-8. [DOI] [PMC free article] [PubMed] [Google Scholar]
- 13.Soshi T, Hisanaga S, Kodama N. et al. Event-related potentials for better speech perception in noise by cochlear implant users. Hear Res. 2014;316:110–121. doi: 10.1016/j.heares.2014.08.001. [DOI] [PubMed] [Google Scholar]
- 14.Pantev C, Dinnesen A, Ross B, Wollbrink A, Knief A. Dynamics of auditory plasticity after cochlear implantation: a longitudinal study. Cereb Cortex. 2006;16(1):31–36. doi: 10.1093/cercor/bhi081. [DOI] [PubMed] [Google Scholar]
- 15.McNeill C, Sharma M, Purdy S C, Agung K. Cortical auditory evoked responses from an implanted ear after 50 years of profound unilateral deafness. Cochlear Implants Int. 2007;8(4):189–199. doi: 10.1179/cim.2007.8.4.189. [DOI] [PubMed] [Google Scholar]
- 16.Purdy S C, Kelly A S, Thorne P R. Auditory evoked potentials as measures of plasticity in humans. Audiol Neurootol. 2001;6(4):211–215. doi: 10.1159/000046835. [DOI] [PubMed] [Google Scholar]
- 17.Kaga K, Kodera K, Hirota E, Tsuzuku T. P300 response to tones and speech sounds after cochlear implant: a case report. Laryngoscope. 1991;101(8):905–907. doi: 10.1288/00005537-199108000-00017. [DOI] [PubMed] [Google Scholar]
- 18.Burdo S, Razza S, Di Berardino F, Tognola G. Auditory cortical responses in patients with cochlear implants. Acta Otorhinolaryngol Ital. 2006;26(2):69–77. [PMC free article] [PubMed] [Google Scholar]
- 19.Jerger J, Oliver T, Chmiel R. Auditory middle latency response: a perspective. Semin in Hear. 1988;9(1):75–85. [Google Scholar]
- 20.Groenen P, Snik A, van den Broek P. Electrically evoked auditory middle latency responses versus perception abilities in cochlear implant users. Audiology. 1997;36(2):83–97. doi: 10.3109/00206099709071963. [DOI] [PubMed] [Google Scholar]
- 21.Nelson M D, Hall J W III, Jacobson G P. Factors affecting the recordability of auditory evoked response component Pb (P1) J Am Acad Audiol. 1997;8(2):89–99. [PubMed] [Google Scholar]
- 22.Ponton C W, Don M, Eggermont J J, Waring M D, Masuda A. Maturation of human cortical auditory function: differences between normal-hearing children and children with cochlear implants. Ear Hear. 1996;17(5):430–437. doi: 10.1097/00003446-199610000-00009. [DOI] [PubMed] [Google Scholar]
- 23.Sharma A, Nash A A, Dorman M. Cortical development, plasticity and re-organization in children with cochlear implants. J Commun Disord. 2009;42(4):272–279. doi: 10.1016/j.jcomdis.2009.03.003. [DOI] [PMC free article] [PubMed] [Google Scholar]
- 24.Ponton C W, Eggermont J J. Of kittens and kids: altered cortical maturation following profound deafness and cochlear implant use. Audiol Neurootol. 2001;6(6):363–380. doi: 10.1159/000046846. [DOI] [PubMed] [Google Scholar]
- 25.Zhang F, Hammer T, Banks H L, Benson C, Xiang J, Fu Q J. Mismatch negativity and adaptation measures of the late auditory evoked potential in cochlear implant users. Hear Res. 2011;275(1–2):17–29. doi: 10.1016/j.heares.2010.11.007. [DOI] [PMC free article] [PubMed] [Google Scholar]
- 26.Gordon K A, Tanaka S, Wong D D, Papsin B C. Characterizing responses from auditory cortex in young people with several years of cochlear implant experience. Clin Neurophysiol. 2008;119(10):2347–2362. doi: 10.1016/j.clinph.2008.06.013. [DOI] [PubMed] [Google Scholar]
- 27.Lammers M J, Versnel H, van Zanten G A, Grolman W. Altered cortical activity in prelingually deafened cochlear implant users following long periods of auditory deprivation. J Assoc Res Otolaryngol. 2015;16(1):159–170. doi: 10.1007/s10162-014-0490-8. [DOI] [PMC free article] [PubMed] [Google Scholar]
- 28.Turgeon C, Lazzouni L, Lepore F, Ellemberg D. An objective auditory measure to assess speech recognition in adult cochlear implant users. Clin Neurophysiol. 2014;125(4):827–835. doi: 10.1016/j.clinph.2013.09.035. [DOI] [PubMed] [Google Scholar]
- 29.Roman S, Canévet G, Marquis P, Triglia J M, Liégeois-Chauvel C. Relationship between auditory perception skills and mismatch negativity recorded in free field in cochlear-implant users. Hear Res. 2005;201(1–2):10–20. doi: 10.1016/j.heares.2004.08.021. [DOI] [PubMed] [Google Scholar]
- 30.Timm L, Vuust P, Brattico E. et al. Residual neural processing of musical sound features in adult cochlear implant users. Front Hum Neurosci. 2014;8:181. doi: 10.3389/fnhum.2014.00181. [DOI] [PMC free article] [PubMed] [Google Scholar]
- 31.Groenen P, Snik A, van den Broek P. On the clinical relevance of mismatch negativity: results from subjects with normal hearing and cochlear implant users. Audiol Neurootol. 1996;1(2):112–124. doi: 10.1159/000259190. [DOI] [PubMed] [Google Scholar]
- 32.Wable J, van den Abbeele T, Gallégo S, Frachet B. Mismatch negativity: a tool for the assessment of stimuli discrimination in cochlear implant subjects. Clin Neurophysiol. 2000;111(4):743–751. doi: 10.1016/s1388-2457(99)00298-9. [DOI] [PubMed] [Google Scholar]
- 33.Rahne T, Plontke S K, Wagner L. Mismatch negativity (MMN) objectively reflects timbre discrimination thresholds in normal-hearing listeners and cochlear implant users. Brain Res. 2014;1586:143–151. doi: 10.1016/j.brainres.2014.08.045. [DOI] [PubMed] [Google Scholar]
- 34.Lopez-Valdes A, Mc Laughlin M, Viani L. et al. Auditory mismatch negativity in cochlear implant users: a window to spectral discrimination. Conf Proc IEEE Eng Med Biol Soc. 2013;2013:3555–3558. doi: 10.1109/EMBC.2013.6610310. [DOI] [PubMed] [Google Scholar]
- 35.Lang A H, Eerola O, Korpilahti P, Holopainen I, Salo S, Aaltonen O. Practical issues in the clinical application of mismatch negativity. Ear Hear. 1995;16(1):118–130. doi: 10.1097/00003446-199502000-00009. [DOI] [PubMed] [Google Scholar]
- 36.Ponton C W, Don M. The mismatch negativity in cochlear implant users. Ear Hear. 1995;16(1):131–146. doi: 10.1097/00003446-199502000-00010. [DOI] [PubMed] [Google Scholar]
- 37.Middlebrooks J C, Bierer J A, Snyder R L. Cochlear implants: the view from the brain. Curr Opin Neurobiol. 2005;15(4):488–493. doi: 10.1016/j.conb.2005.06.004. [DOI] [PubMed] [Google Scholar]
- 38.Nilsson M, Soli S D, Sullivan J A. Development of the Hearing in Noise Test for the measurement of speech reception thresholds in quiet and in noise. J Acoust Soc Am. 1994;95(2):1085–1099. doi: 10.1121/1.408469. [DOI] [PubMed] [Google Scholar]
- 39.Peterson G E, Lehiste I. Revised CNC lists for auditory tests. J Speech Hear Disord. 1962;27:62–70. doi: 10.1044/jshd.2701.62. [DOI] [PubMed] [Google Scholar]
- 40.Valente M, Van Vliet D. The Independent Hearing Aid Fitting Forum (IHAFF) Protocol. Trends Amplif. 1997;2(1):6–35. doi: 10.1177/108471389700200102. [DOI] [PMC free article] [PubMed] [Google Scholar]
- 41.Chang S A, Tyler R S, Dunn C C. et al. Performance over time on adults with simultaneous bilateral cochlear implants. J Am Acad Audiol. 2010;21(1):35–43. doi: 10.3766/jaaa.21.1.5. [DOI] [PMC free article] [PubMed] [Google Scholar]
- 42.Tye-Murray N, Tyler R S, Woodworth G G, Gantz B J. Performance over time with a nucleus or Ineraid cochlear implant. Ear Hear. 1992;13(3):200–209. doi: 10.1097/00003446-199206000-00010. [DOI] [PubMed] [Google Scholar]
- 43.Firszt J B, Chambers R D, Kraus And N, Reeder R M. Neurophysiology of cochlear implant users I: effects of stimulus current level and electrode site on the electrical ABR, MLR, and N1-P2 response. Ear Hear. 2002;23(6):502–515. doi: 10.1097/00003446-200212000-00002. [DOI] [PubMed] [Google Scholar]
- 44.Alain C, Campeanu S, Tremblay K. Changes in sensory evoked responses coincide with rapid improvement in speech identification performance. J Cogn Neurosci. 2010;22(2):392–403. doi: 10.1162/jocn.2009.21279. [DOI] [PubMed] [Google Scholar]
- 45.Tremblay K L, Shahin A J, Picton T, Ross B. Auditory training alters the physiological detection of stimulus-specific cues in humans. Clin Neurophysiol. 2009;120(1):128–135. doi: 10.1016/j.clinph.2008.10.005. [DOI] [PMC free article] [PubMed] [Google Scholar]
- 46.Ponton C W, Vasama J P, Tremblay K, Khosla D, Kwong B, Don M. Plasticity in the adult human central auditory system: evidence from late-onset profound unilateral deafness. Hear Res. 2001;154(1–2):32–44. doi: 10.1016/s0378-5955(01)00214-3. [DOI] [PubMed] [Google Scholar]
- 47.Kral A, Hubka P, Tillein J. Strengthening of hearing ear representation reduces binaural sensitivity in early single-sided deafness. Audiol Neurootol. 2015;20 01:7–12. doi: 10.1159/000380742. [DOI] [PubMed] [Google Scholar]
- 48.Makhdoum M J, Groenen P A, Snik A F, van den Broek P. Intra- and interindividual correlations between auditory evoked potentials and speech perception in cochlear implant users. Scand Audiol. 1998;27(1):13–20. doi: 10.1080/010503998419650. [DOI] [PubMed] [Google Scholar]
- 49.Reiss L A, Turner C W, Erenberg S R, Gantz B J. Changes in pitch with a cochlear implant over time. J Assoc Res Otolaryngol. 2007;8(2):241–257. doi: 10.1007/s10162-007-0077-8. [DOI] [PMC free article] [PubMed] [Google Scholar]


