Abstract
Background
Accurate identification of tricuspid valve (TV) leaflets by two-dimensional (2D) transthoracic echocardiography is difficult because of variability in the intersection between the imaging plane and leaflets. Using information obtained from multiplanar reconstruction (MPR) of three-dimensional (3D) data sets, the investigators sought to define “novel” 2D views that would allow targeted interrogation of TV leaflets using 2D transthoracic echocardiography.
Methods
Images of the TV in the standard 2D views (apical four chamber, right ventricular focused, right ventricular inflow, and parasternal short axis) and 3D data sets were acquired from the same probe position in 106 adults. Three-dimensional MPR was used to determine which leaflet combination was seen in the 2D image: anterior and septal, anterior and posterior, anterior alone, or posterior and septal. Using this analysis, 2D landmarks were identified to define nonstandard TV views tailored to depict specific leaflets. Two-dimensional images in these views and 3D data sets were then prospectively collected in 54 additional patients. Three independent readers analyzed these 2D views to determine TV leaflet combinations, and their interpretation was compared with 3D MPR–derived reference.
Results
Three-dimensional MPR views made it possible to define six nonstandard 2D views on the basis of anatomic clues and landmarks, which consistently depicted all the aforementioned leaflet combinations. When these six views were prospectively tested, the agreement of TV leaflet identification against 3D MPR was excellent (κ = 0.88, κ = 0.93, and κ = 0.98).
Conclusion
The nonstandard 2D views defined in this study allow accurate TV leaflet identification and may thus be useful when localization of TV leaflet pathology is clinically important. (J Am Soc Echocardiogr 2016;29:74–82.)
Keywords: Tricuspid valve, Leaflets, Echocardiography, Multiplanar reconstruction
Standard views of the tricuspid valve (TV) on two-dimensional (2D) transthoracic echocardiography (TTE) include the right ventricular (RV) inflow (RVIF), the parasternal short-axis (PSAX), and the apical four-chamber (A4C) views. Recently the RV-focused (RVF) view has also been introduced as a potentially useful imaging window from which to visualize the TV. Typically, only two of the three TV leaflets are seen in each of these views. Prominent echocardiographic textbooks differ considerably when it comes to describing which two leaflets are being seen in each view,1–4 leading to the belief that there is no consistency in the TV leaflet pairs imaged in any one of the three standard views. With the advent of three-dimensional (3D) echocardiography, it is possible to determine, using multi-planar reconstruction (MPR), where the 2D echocardiographic cut plane falls in relation to the 3D tricuspid leaflet-annulus complex5,6 and thereby determine with confidence which leaflets are visualized. This knowledge has reinforced the fact that with 2D echocardiography alone, it is impossible to be sure which TV leaflets are being imaged.
Significant efforts have been invested in understanding which scallops of the mitral valve are visualized on both transthoracic7,8 and transesophageal echocardiographic views.9–12 In contrast, little effort has been invested in understanding the position of the 2D imaging cut planes relative to the TV leaflets5,6 and which leaflets are being imaged accordingly. This is likely because until recently, it has been more difficult to image the TV than the mitral valve. Three-dimensional TTE allows the simultaneous visualization of all three TV leaflets. It is especially helpful for imaging the TV because of the close proximity and anterior position of this valve to the chest wall. We hypothesized that this inherent advantage of 3D over 2D TTE could help determine which tricuspid leaflets are visualized in standard 2D imaging views and aid in modifying the 2D imaging planes during acquisition to increase the confidence regarding which TV leaflets are being visualized. The aim of the present study was to use MPR of 3D data sets obtained from the RVIF, PSAX, A4C, and RVF views to (1) determine the prevalence of leaflet pairs visualized on each of the standard views, (2) define a set of nonstandard 2D views that would consistently depict specific combinations of TV leaflets, and (3) prospectively test these predefined 2D views in an independent group of patients.
METHODS
Patient Population and Study Design
One hundred sixty patients with a wide range of RV sizes and function and tricuspid annular sizes without previous TV surgery were prospectively studied. All patients had undergone clinically indicated TTE. Of these patients, the first 106 patients became the study group, and the following 54 became the test group. Table 1 summarizes the baseline characteristics of both groups. The study group was used to address the first and second aims, whereas the test group was used to address the third aim. Specifically, using data obtained from the MPR analysis of the study group, 2D view-specific details were identified to describe nonstandard 2D views tailored to depict specific TV leaflets. Two-dimensional acquisitions of these “novel” views combined with the 3D data sets obtained from the identical transducer position were subsequently prospectively collected in the test group. These nonstandard views were reviewed by three independent observers, whose determination of which leaflets were visualized were compared with 3D MPR reference. The study was approved by the institutional review board.
Table 1.
Baseline characteristics of the study and test populations
| Study group (n = 106) |
Test group (n = 54) |
|
|---|---|---|
| Age (y) | 54 ± 20 | 48 ± 23 |
| Men | 52 (49%) | 25 (46%) |
| BSA (m2) | 1.8 ± 0.2 | 1.8 ± 0.2 |
| Tricuspid annular diameter (mm) | 33 ± 7 | 34 ± 8 |
| RV basal diameter (mm) | 55 ± 6 | 53 ± 6 |
| TAPSE (cm) | 1.9 ± 0.5 | 1.9 ± 0.5 |
| S′ (cm/sec) | 11 ± 3 | 11 ± 3 |
BSA, Body surface area; TAPSE, tricuspid annular plane systolic excursion.
Data are expressed as mean ± SD or as number (percentage).
Protocol I: The Study Group
In the study group, digital cine loops of the TV were acquired in the three standard 2D views: A4C, RVIF, and PSAX, as well as in the RVF view (iE33; Philips Medical Systems, Andover, MA) by a single sonographer using the fully sampled matrix-array X5 transducer. For each of the four transducer positions on the chest wall, a full-volume 3D data set was acquired immediately after the 2D acquisition (Figure 1). Full-volume or zoomed acquisitions were performed using electrocardiographic gating over four consecutive cardiac cycles during a single breath-hold.13
Figure 1.
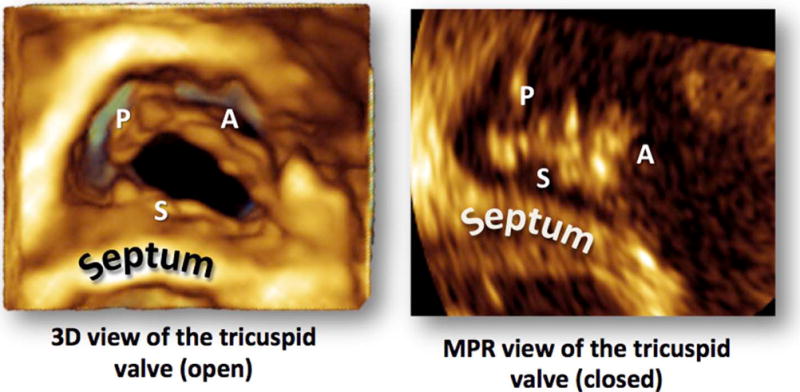
The TV on 3D TTE as viewed from the RV perspective. Three-dimensional zoom acquisition seen on the left and the cross-sectional MPR perspective that was used to assess the intersection of the 2D cut plane with the tricuspid leaflets is seen on the right.
MPR of 3D Data Sets
Digital 3D data sets were analyzed offline using commercial software (QLAB version 9.0; Philips Medical Systems) to determine which combination of leaflets (anterior and septal [A-S]; anterior and posterior [A-P]; posterior and septal [P-S]; posterior, anterior, and septal; or anterior alone [ANT]) was visualized in each 2D image. This was done by manipulating the data set using QLAB with 3DQ functionality (Figure 2). The green plane (Figure 2, top left) represented the original 2D input. The position of this plane was not adjusted. To determine which leaflets were depicted in the original 2D image, the red (orthogonal) and blue (cross-sectional) planes were adjusted to depict a cross-section of the TV as viewed from the RV perspective. The leaflets seen in the original 2D imaging plane were then determined by carefully assessing the intersection between the green plane and the blue plane in systole and diastole (Figure 2). In the study group, the combinations of TV leaflet pairs were counted to obtain the percentage frequency of each combination for each of the standard views.
Figure 2.
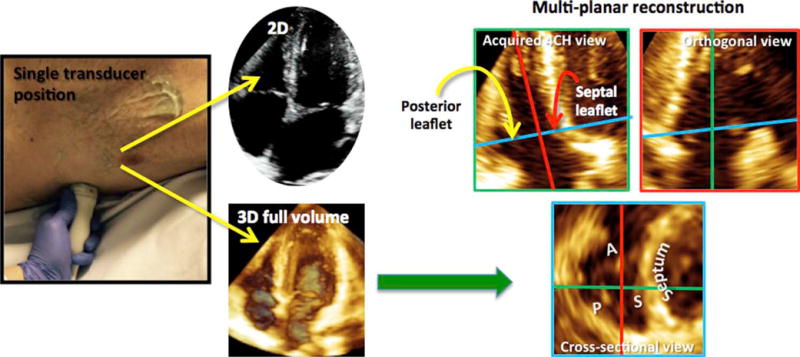
To determine which leaflets were being imaged in the 2D view, 2D and 3D full-volume data sets were obtained with the transducer probe in the same position on the chest wall (left). The full-volume data set was analyzed using MPR (right). The green plane (top left) represented the original 2D input. The position of this plane was not adjusted. The red (orthogonal) and blue (cross-sectional) planes were adjusted to depict a cross-section of the TV as viewed from the RV perspective (blue plane). The leaflets seen in the original 2D imaging plane could then be determined by studying the intersection between the green plane and the cross-sectional plane.
Protocol II: The Test Group
Three independent readers were requested to analyze the nonstandard 2D views obtained in the test group and to identify the TV leaflets in each image. This was done after a brief teaching session, which described the novel 2D views and the TV leaflets expected to be visualized in each of these novel views. The interpretation of these readers was compared with the 3D MPR–based analysis, which was performed by an independent investigator.
Statistical Analysis
In protocol II, κ statistics of agreement between categorical variables were used to compare the 2D and 3D MPR determinations. The calculated κ coefficients were judged as follows: 0 to 0.20, low; 0.21 to 0.40, moderate; 0.41 to 0.60, substantial; 0.61 to 0.80, good; and >0.80, excellent.
RESULTS
Of the 106 study group patients, 25 did not have 2D or 3D data sets from the RVF view of sufficient quality. Time required for the MPR analysis was approximately 25 sec/view and approximately 75 sec/patient on a standard personal computer.
The frequency of leaflet combinations seen in the 2D images is summarized in Figure 3. In the A4C view, the P-S combination was seen in the majority of patients (96 of 106 [91%]). The A-S combination was seen in only 10 of 106 (9%). In the RVF view, the P-S combination was almost exclusively seen (80 of 81 [99%]); in the single patient in whom the A-S combination was seen, the left ventricular outflow tract was seen, and therefore the acquired image was not a true RVF view. In the RVIF view, the A-S combination was seen in most patients (80 of 106 [75%]), while in the remaining 26 patients, the A-P combination was visualized. Interestingly, in none of the RVIF acquisitions was the P-S combination noted. In the PSAX view, the A-P combination was seen in fewer than half of the patients (43 of 106 [41%]). The next most common leaflet combination in this view was the P-S combination, in 24 of 106 (23%), followed by the A-S combination, in 12 of 106 (11%). In this view, it was also possible to image the anterior leaflet alone, as was the case in 14 of 106 patients (13%); at times, all three TV leaflets could be visualized simultaneously in 13 of 106 (12%).
Figure 3.
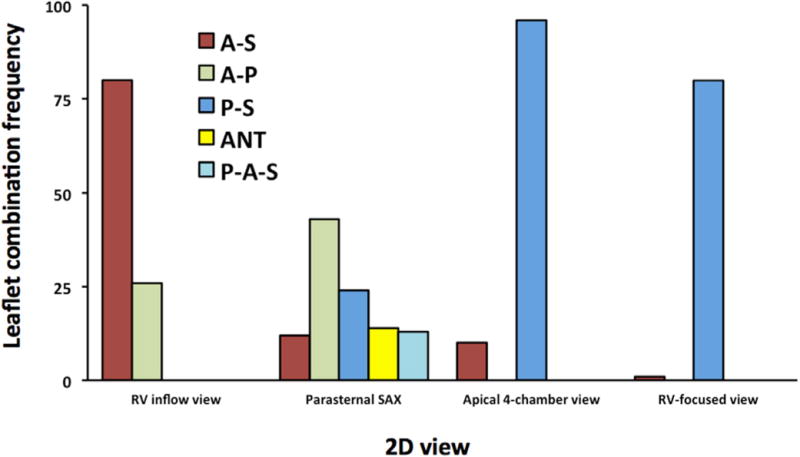
The frequency of leaflet combinations seen in the actual 2D images. P-A-S, Posterior, anterior, and septal leaflets.
RVIF View
In the RVIF view, the leaflet seen to the right of the 2D image (nearest the aortic valve) was always the anterior leaflet. When the RVIF view was acquired with the septum in view, the A-S leaflet combination was always imaged. When the septum was not visualized, it was not possible to determine from the 2D image whether the septal or posterior leaflet was being imaged, because the 2D image with the A-S leaflet combination and the image with the A-P combination looked similar (Figure 4).
Figure 4.
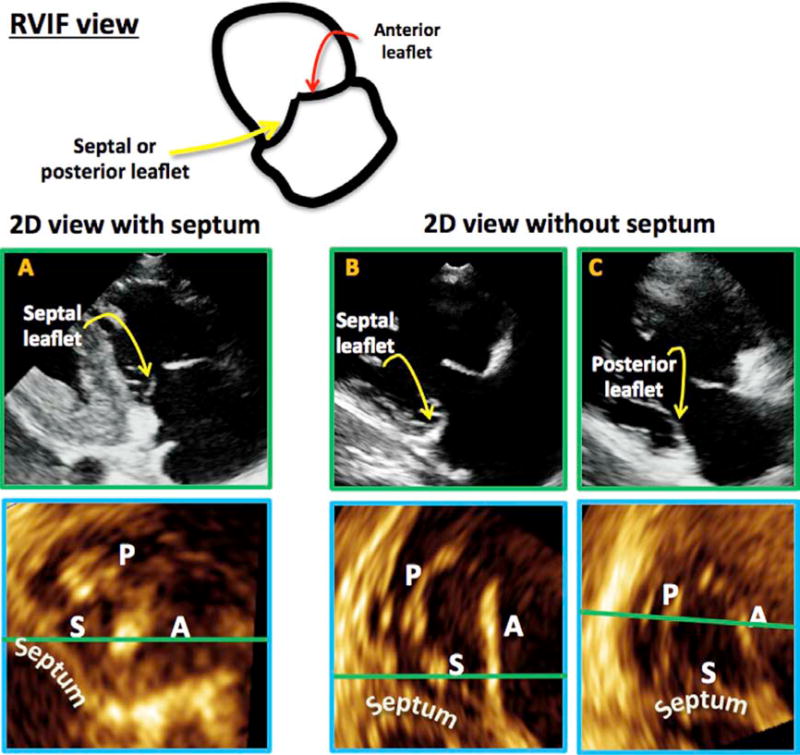
In the RVIF view (top), the anterior leaflet is always seen on the side of the aorta. When the 2D plane intersected the septum, the A-S combination was seen (A, top with corresponding MPR result, bottom). When the septum was not seen in the 2D plane (B,C), the leaflet combination imaged could be A-S or A-P.
PSAX View
The PSAX view showed the most leaflet combination possibilities of all views (Figures 3 and 5). Some consistent observations included the following. The leaflet closest to the aortic valve was always the anterior or septal leaflet and never the posterior leaflet. The leaflet farthest from the aortic valve and arising from the RV free wall was either the posterior or the anterior leaflet and never the septal leaflet.
Figure 5.
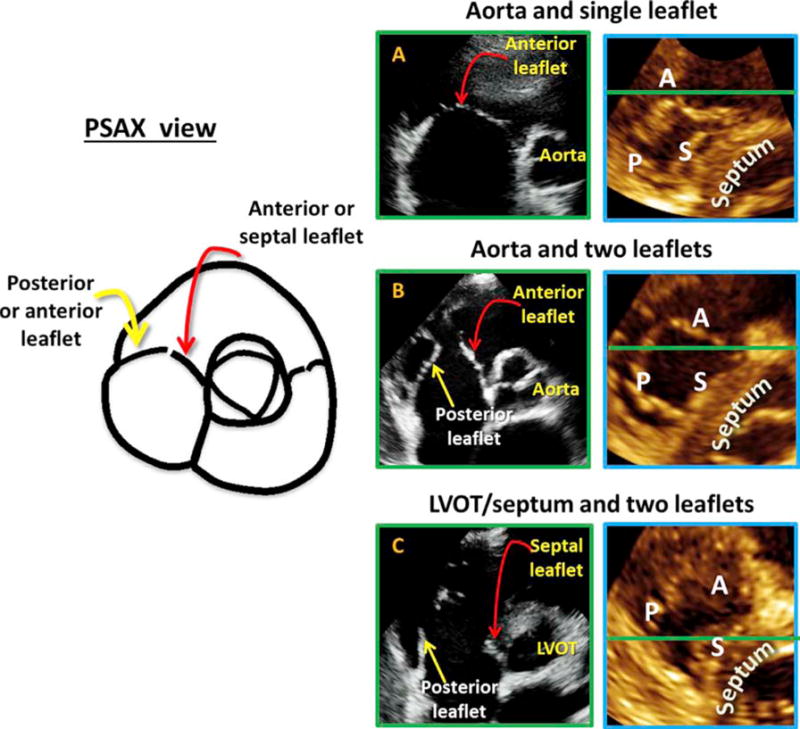
In the PSAX view (left) the leaflet is closest to the aorta is always the anterior or septal and never the posterior. Near the RV free wall, the posterior or anterior leaflet could be seen but never the septal leaflet. The anterior leaflet was depicted if a single leaflet was seen on the 2D image (A with corresponding MPR result to the right). The A-P combination was noted if two leaflets were seen with a central coaptation point together with the aortic valve (B with corresponding MPR result to the right). When the 2D plane intersected below the aortic valve, in the area of the left ventricular outflow tract or septum, and the aortic valve was not seen throughout the cardiac cycle, the leaflets imaged were the septal and the posterior leaflet (C with corresponding MPR result to the right).
When the ANT leaflet was in view (14 cases), the aortic valve was visible in all cases, and in 13 of 14 cases, all three leaflets of the aortic valve were also visualized. In this view, the ANT leaflet was seen as a single leaflet (Figure 5A, Videos 1 and 2). When the A-P combination was seen (43 cases), the aortic valve was always in view, and in 39 of 43 cases, all three aortic leaflets were also seen in the same plane. Additionally, the A-P leaflets came together at a central coaptation point (Figure 5B, Videos 3 and 4). When the A-S leaflets were seen together, the septal leaflet was always on the side of the aorta. In this view, the aorta was not as well seen as it was when the A-P combination was imaged. This is because the septal leaflet arises from the membranous septum, and in order for it to be in the imaging plane, the plane would need to contain the septum. Of note, the septal leaflet was often the smaller of the two, and the coaptation between that A-S leaflet was closer to the aorta and therefore not midline. This view did not have particular landmarks and was therefore difficult to reproduce with certainty. When the P-S combination was imaged, the aortic valve was either poorly visualized or not seen at all (22 of 24 cases). In this plane, the left ventricular outflow tract or septum was visualized throughout most of the cardiac cycle (Figure 5C, Video 5). Once again, this is because the septal leaflet arises from the membranous septum, so that throughout the cardiac cycle, ether the septum or the left ventricular outflow tract was seen in place of the aorta. This view was also difficult to reproduce, as the very basal short-axis plane that rendered this leaflet combination was difficult to consistently reproduce in different patients. Finally, in the PSAX view, occasionally, all three leaflets were seen simultaneously. The septal leaflet was on the side of the aorta and often appeared small, while the anterior leaflet was in the middle and the posterior leaflet was against the RV free wall.
The Apical Views
The apical views included both the A4C and the RVF views. The advantage of the RVF view was often the fact that the leaflets could be better visualized in both the zoomed and full-volume data sets. First, it was observed that when the best RVF view was obtained, P-S leaflets were consistently imaged (Figure 6A). When the left ventricular outflow tract was visualized, the A-S leaflets were seen, and when the coronary sinus was visualized, the P-S leaflets were viewed (Figures 6B and 6C).
Figure 6.
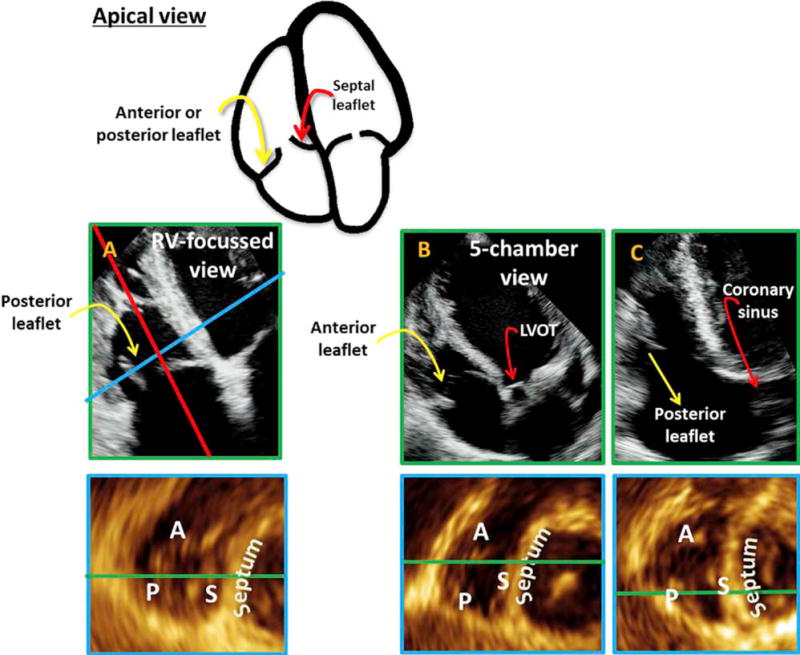
The apical views are presented with the 2D views on top and the corresponding MPR result on the bottom. The views consisted of the RVF view (A), the apical view with left ventricular outflow tract or apical five-chamber view (B), and the apical view with coronary sinus (C). In all cases, the septal leaflet was seen closest to the septum. The leaflet against the RV free wall could be either the anterior or the posterior leaflet. In the RVF view (A), the leaflet against the RV free wall was almost always the posterior. The A-S combination was seen if the 2D plane intersected with the LV outflow tract (B), while the P-S combination was seen if the 2D plane was near the coronary sinus (C).
The Test Group
Anatomic landmarks identified to direct 2D interrogation of the TV leaflets in the test group are tabulated in Table 2 and elaborated in Figure 7. When these six nonstandard 2D views were tested, the agreement of TV leaflet identification for all three readers against 3D MPR was excellent (κ = 0.88, κ = 0.93, and κ = 0.98).
Table 2.
Two-dimensional landmarks corresponding with specific 3D leaflet identification
| Landmarks on 2D view | |||
|---|---|---|---|
| Leaflet(s) | RVIF | PSAX | Apical |
| ANT | — | Single leaflet, Aortic valve | — |
| A-S | Septum | — | LVOT |
| A-P | — | Central coaptation, Aortic valve | — |
| P-S | — | — | CS |
CS, Coronary sinus; LVOT, left ventricular outflow tract.
Dashes signify that this leaflet combination cannot be reliably imaged from this view.
Figure 7.
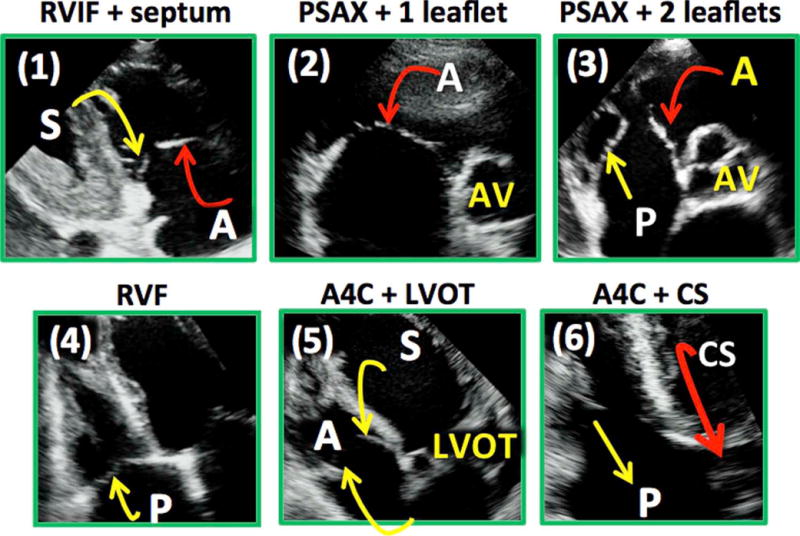
Proposed views of the TV targeted to interrogate specific leaflets: (1) the RVIF view with septum, (2) the PSAX view with a single leaflet, (3) the PSAX view with two leaflets with central coaptation point together with the aortic valve, (4) the RVF view, (5) the A4C view with LVOT (left ventricular outflow tract), and (6) the A4C view with coronary sinus. CS, Coronary sinus.
DISCUSSION
The most important textbooks in echocardiography as well as recent societal guidelines are inconsistent when describing which specific tricuspid leaflet combinations are visualized from each of the standard TV views.1–4 The most commonly proposed descriptions suggest that the posterior and anterior leaflets are seen in the RVIF view, whereas the septal and anterior combination are visualized in the PSAX view and the septal and anterior leaflets in the A4C view. Three-dimensional analysis in our study resulted in data that challenge the textbooks and guidelines, as they demonstrate that it is impossible to predict with certainty the TV leaflet combination visualized in any of the standard 2D views.
Unlike the mitral, the TV has three leaflets, and even slight variations in probe position result in different imaging planes and therefore different leaflet combinations. The clinical significance of identifying the correct TV leaflets is seen in this example (Figure 8). A patient may have minimal tricuspid regurgitation when visualizing the TV from one RVIF position and severe tricuspid regurgitation with leaflet malcoaptation when the valve is visualized from a different RVIF position. This is simply because in the first instance, the 2D cut plane is close to the septum and therefore images the A-S leaflet combination, while in the second instance, the cut plane is far away from the septum so that the A-P combination is viewed. The leaflet malcoaptation was between the anterior and the posterior leaflets (Figure 8). In the initial part of our study, we were able to demonstrate that it is essentially not possible to predict which leaflet combination is being imaged in any standard 2D view of the TV. We performed 2D and 3D imaging of the TV in the RVIF, PSAX, and A4C views, demonstrating that both the A-S and the A-P combinations were possible in the RVIF view; the A-S, A-P, ANT, P-S, and posterior, anterior, and septal were all possible in the PSAX view; whereas the A-S and P-S combinations were seen in the A4C view. Similar conclusions have been drawn by another group using a similar analysis.6
Figure 8.
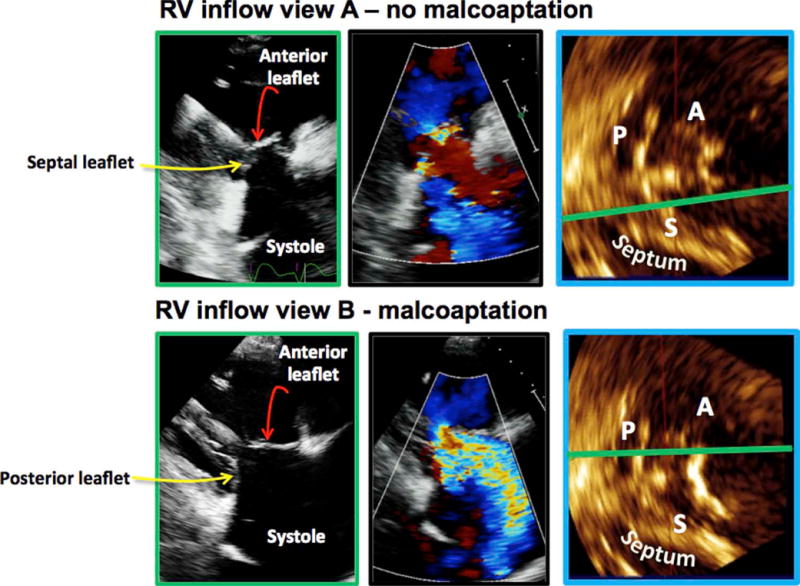
All images come from the same patient. The top row represents one RVIF probe position: the tricuspid leaflets coapt (top, far left), there is minimal tricuspid regurgitation (top, center), and the MPR demonstrates that the 2D plane is intersecting the anterior and the septal leaflets (top, right). The bottom row represents a slightly different RVIF probe position: the TV leaflets do not coapt (bottom, far left), there is severe tricuspid regurgitation (bottom, center), and the MPR demonstrates the 2D plane is intersecting the A-P leaflets (bottom, right).
Recent studies indicate that moderate and severe tricuspid regurgitation has a detrimental impact on morbidity and mortality.14–16 For this reason, there has been renewed interest in the literature to better understand the anatomy and physiology of the TV.17–20 Localization of TV pathology is important in this regard. With the help of 3D MPR analysis, we were able to identify, in each of the standard 2D views, particular landmarks, which would enable targeted imaging of specific tricuspid leaflets pairs. On the basis of these landmarks, we propose six nonstandard novel 2D views: the RVIF plus septum view to interrogate the A-S leaflets, the PSAX single-leaflet view to visualize the ANT leaflet, the PSAX two-leaflet view to depict the A-P combination, the RVF view and the A4C view with coronary sinus visualization to image the P-S combination, and finally the A4C view with the left ventricular outflow tract to display the A-S combination (Figure 7). When these 2D views were prospectively tested, there was excellent agreement between the 2D interpretation and the MPR analysis. Using these novel views, it was possible to determine with confidence which TV leaflets were imaged.
Targeted analysis of the TV would allow improved localization of TV leaflet pathology (e.g., endocarditis), improved assessment of mechanical leaflet problems (e.g., prolapse, flail), and clarification of the mechanisms of tricuspid regurgitation (e.g., as in the case of tricuspid regurgitation due to malcoaptation between specific leaflets). For example, in a patient with TV prolapse, using the proposed targeted novel views, it was possible to localize the prolapse to the anterior leaflet (Figure 9). First, in the A4C view with the coronary sinus visualized, the prolapse was not seen (Video 6), suggesting that the prolapse did not involve the posterior or septal leaflets. In the A4C view with left ventricular outflow tract, the prolapse was seen (Video 7), demonstrating that the pathology was located in the anterior leaflet. MPR analysis in each of the 2D views and subsequent 3D zoom analysis from the right atrial perspective (Figure 9) confirmed these findings.
Figure 9.
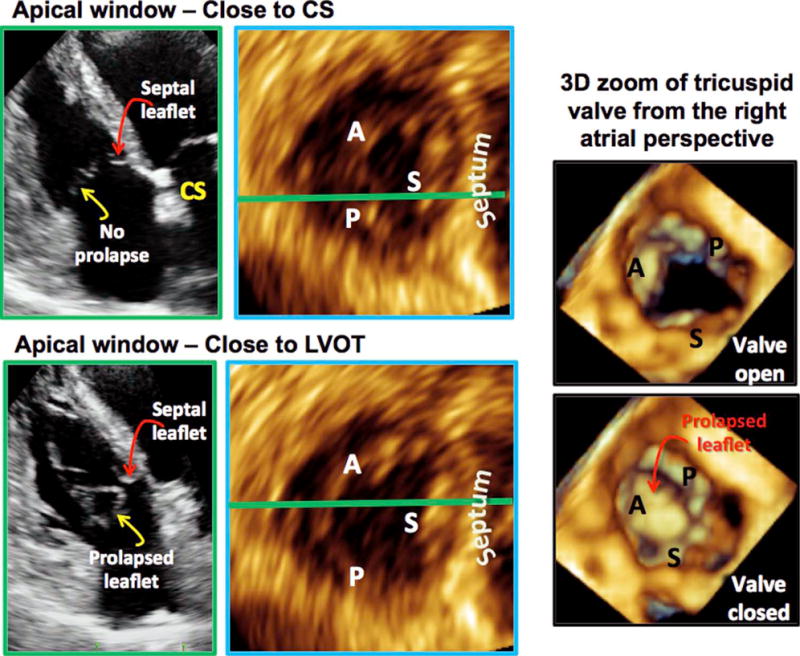
Using the proposed nonstandard TV views to localize TV prolapse. In the A4C view with coronary sinus (left, top row), the prolapse was not seen, suggesting that the prolapse did not involve the posterior or the septal leaflets. In the A4C view with left ventricular outflow tract (LVOT), the prolapse was seen (left, bottom row), suggesting that the pathology was related to the anterior leaflet. MPR analysis in each of the 2D views confirmed these conclusions (left, top and bottom MPR views). Three-dimensional zoom of the TV as seen from the right atrial perspective also confirmed these findings. CS, Coronary sinus.
TV leaflet pairs on 2D echocardiography have been studied using 3D analysis before. In the most recent study,6 leaflet combinations were studied for each of the three standard TV views on 2D echocardiography. In this study, the A-S combination was most frequently seen in the A4C view. Our results are different, because we found that in this view, the P-S combination was the most frequently encountered. This difference may be sonographer specific, due to a more posteriorly positioned 2D plane used to acquire the A4C view in our study, whereas, in a study by Stankovic et al.,6 the 2D plane used to image the A4C view was positioned more anteriorly. Our results agree in part with the results of Stankovic et al. for the RVIF view. Both studies showed that if the septum is on display in the 2D view, the TV leaflets imaged are the septal and the anterior. If the septum is not visualized, the most commonly imaged leaflet pair, in our study, was sill the A-S combination (about three quarters of cases), while the most commonly imaged pair in the study by Stankovic et al. was the A-P combination (also in three quarters of cases). In the PSAX view, both studies showed that it was possible to see all three TV leaflets simultaneously. When this occurred, the posterior leaflet was closest to the RV free wall, the septal leaflet was closest to the aorta, and the anterior leaflet was between these leaflets. In addition, in both studies, the leaflet adjacent to the aortic valve was either the anterior or septal leaflet, never the posterior leaflest. The most common leaflet combination seen was the A-P combination. We identified a novel view in which only the anterior leaflet was visualized. This view has not been described before and provides an alternative way to image the anterior leaflet with certainty. Finally, we also studied the RVF view. By convention, the RVF view is obtained by moving the probe more laterally to focus on the right ventricle. This movement also forces the 2D cut plane to present the right ventricle in a nonforeshortened view while maximizing its basal dimension. This is naturally a more posterior cut plane, such that the P-S combination was more likely imaged in this view.
In an older study, Anwar et al.5 also used 3D echocardiography to determine TV leaflet combinations seen in the standard 2D views. They showed that the leaflet combination seen in the A4C and RVIF views was exclusively A-S. The posterior leaflet was not seen in the RVIF view. In the PSAX view, the A-P combination was the most frequent, followed by the A-S combination.
Three-dimensional transesophageal echocardiography does not offer the same incremental benefit in TV imaging as it does for the mitral valve, because unlike the latter valve, the TV is predominantly located in the far field. Cardiac magnetic resonance imaging is not reliable in imaging fast-moving structures such as valve leaflets. Likewise, other imaging modalities, such as computed tomography and nuclear techniques, are not well suited for in-depth TV assessment. Because of its anterior position in the chest and thus close proximity to the transducer, TTE is the optimal tool for TV imaging. Unlike 2D echocardiography, 3D TTE can display all three TV leaflets simultaneously, thereby enabling accurate localization of leaflet pathology.21–24 However, 2D echocardiography is still the main clinical imaging modality, and therefore implementation of targeted and novel 2D views designed to interrogate specific tricuspid leaflets would be clinically useful to localize tricuspid leaflet pathology with certainty.
Limitations
Our methods do not apply to TVs that are bicuspid or have more than three leaflets. However, the frequency of these leaflet variations is reported to be low. In one study it was reportedly 12%.6 The proposed 2D views would not yield the expected results in these cases. Furthermore, in our study, 3D echocardiography was considered the gold standard. Surgical comparison was not available.
CONCLUSIONS
Given the many different ways in which a 2D cut plane can intersect the TV leaflets and yet produce similar images, it is not possible to define which TV leaflets are seen in the standard 2D views. We defined six novel nonstandard 2D views, which allow accurate TV leaflet identification and therefore promise to be useful for improved localization of TV leaflet pathology.
Supplementary Material
Attention ASE Members.
The ASE has gone green! Visit www.aseuniversity.org to earn free continuing medical education credit through an online activity related to this article. Certificates are available for immediate access upon successful completion of the activity. Nonmembers will need to join the ASE to access this great member benefit!
Abbreviations
- A4C
Apical four-chamber
- ANT
Anterior alone
- A-P
Anterior and posterior
- A-S
Anterior and septal
- MPR
Multiplanar reconstruction
- P-S
Posterior and septal
- PSAX
Parasternal short-axis
- RV
Right ventricular
- RVF
Right ventricular–focused
- RVIF
Right ventricular inflow
- 3D
Three-dimensional
- TTE
Transthoracic echocardiography
- TV
Tricuspid valve
- 2D
Two-dimensional
Footnotes
SUPPLEMENTARY DATA
Supplementary data related to this article can be found at http://dx.doi.org/10.1016/j.echo.2015.08.017.
References
- 1.Armstrong WF, Ryan T. Feigenbaum’s Echocardiography. 7th. Wolters Kluwer Health/Lippincott Williams \& Wilkins; 2010. [Google Scholar]
- 2.Lancellotti P, Moura L, Pierard LA, Agricola E, Popescu BA, Tribouilloy C, et al. European Association of Echocardiography recommendations for the assessment of valvular regurgitation. Part 2: mitral and tricuspid regurgitation (native valve disease) Eur J Echocardiogr. 2010;11:307–32. doi: 10.1093/ejechocard/jeq031. [DOI] [PubMed] [Google Scholar]
- 3.Lang RM, Badano LP, Mor-Avi V, Afilalo J, Armstrong A, Ernande L, et al. Recommendations for cardiac chamber quantification by echocardiography in adults: an update from the American Society of Echocardiography and the European Association of Cardiovascular Imaging. J Am Soc Echocardiogr. 2015;28:1–39. doi: 10.1016/j.echo.2014.10.003. [DOI] [PubMed] [Google Scholar]
- 4.Otto C. Textbook of Clinical Echocardiography. 4th. Philadelphia, PA: W.B. Saunders; 2004. [Google Scholar]
- 5.Anwar AM, Geleijnse ML, Soliman OI, McGhie JS, Frowijn R, Nemes A, et al. Assessment of normal tricuspid valve anatomy in adults by real-time three-dimensional echocardiography. Int J Cardiovasc Imaging. 2007;23:717–24. doi: 10.1007/s10554-007-9210-3. [DOI] [PMC free article] [PubMed] [Google Scholar]
- 6.Stankovic I, Daraban AM, Jasaityte R, Neskovic AN, Claus P, Voigt JU. Incremental value of the en face view of the tricuspid valve by two-dimensional and three-dimensional echocardiography for accurate identification of tricuspid valve leaflets. J Am Soc Echocardiogr. 2014;27:376–84. doi: 10.1016/j.echo.2013.12.017. [DOI] [PubMed] [Google Scholar]
- 7.Minardi G, Pino PG, Manzara CC, Pulignano G, Stefanini GG, Viceconte GN, et al. Preoperative scallop-by-scallop assessment of mitral prolapse using 2D-transthoracic echocardiography. Cardiovasc Ultrasound. 2010;8:1. doi: 10.1186/1476-7120-8-1. [DOI] [PMC free article] [PubMed] [Google Scholar]
- 8.Monin JL, Dehant P, Roiron C, Monchi M, Tabet JY, Clerc P, et al. Functional assessment of mitral regurgitation by transthoracic echocardiography using standardized imaging planes diagnostic accuracy and outcome implications. J Am Coll Cardiol. 2005;46:302–9. doi: 10.1016/j.jacc.2005.03.064. [DOI] [PubMed] [Google Scholar]
- 9.Agricola E, Oppizzi M, De BM, Maisano F, Toracca L, Bove T, et al. Multiplane transesophageal echocardiography performed according to the guidelines of the American Society of Echocardiography in patients with mitral valve prolapse, flail, and endocarditis: diagnostic accuracy in the identification of mitral regurgitant defects by correlation with surgical findings. J Am Soc Echocardiogr. 2003;16:61–6. doi: 10.1067/mje.2003.23. [DOI] [PubMed] [Google Scholar]
- 10.Foster GP, Isselbacher EM, Rose GA, Torchiana DF, Akins CW, Picard MH. Accurate localization of mitral regurgitant defects using multiplane transesophageal echocardiography. Ann Thorac Surg. 1998;65:1025–31. doi: 10.1016/s0003-4975(98)00084-8. [DOI] [PubMed] [Google Scholar]
- 11.Lambert AS, Miller JP, Merrick SH, Schiller NB, Foster E, Muhiudeen-Russell I, et al. Improved evaluation of the location and mechanism of mitral valve regurgitation with a systematic transesophageal echocardiography examination. Anesth Analg. 1999;88:1205–12. doi: 10.1097/00000539-199906000-00004. [DOI] [PubMed] [Google Scholar]
- 12.Omran AS, Woo A, David TE, Feindel CM, Rakowski H, Siu SC. Intraoperative transesophageal echocardiography accurately predicts mitral valve anatomy and suitability for repair. J Am Soc Echocardiogr. 2002;15:950–7. doi: 10.1067/mje.2002.121534. [DOI] [PubMed] [Google Scholar]
- 13.Lang RM, Badano LP, Tsang W, Adams DH, Agricola E, Buck T, et al. EAE/ASE recommendations for image acquisition and display using three-dimensional echocardiography. Eur Heart J Cardiovasc Imaging. 2012;13:1–46. doi: 10.1093/ehjci/jer316. [DOI] [PubMed] [Google Scholar]
- 14.Hung J, Koelling T, Semigran MJ, Dec GW, Levine RA, Di Salvo TG. Usefulness of echocardiographic determined tricuspid regurgitation in predicting event-free survival in severe heart failure secondary to idiopathic-dilated cardiomyopathy or to ischemic cardiomyopathy. Am J Cardiol. 1998;82:1301–3. A10. doi: 10.1016/s0002-9149(98)00624-9. [DOI] [PubMed] [Google Scholar]
- 15.Nath J, Foster E, Heidenreich PA. Impact of tricuspid regurgitation on long-term survival. J Am Coll Cardiol. 2004;43:405–9. doi: 10.1016/j.jacc.2003.09.036. [DOI] [PubMed] [Google Scholar]
- 16.Topilsky Y, Nkomo VT, Vatury O, Michelena HI, Letourneau T, Suri RM, et al. Clinical outcome of isolated tricuspid regurgitation. JACC Cardiovasc Imaging. 2014;7:1185–94. doi: 10.1016/j.jcmg.2014.07.018. [DOI] [PubMed] [Google Scholar]
- 17.Miglioranza MH, Mihaila S, Muraru D, Cucchini U, Iliceto S, Badano LP. Dynamic changes in tricuspid annular diameter measurement in relation to the echocardiographic view and timing during the cardiac cycle. J Am Soc Echocardiogr. 2015;28:226–35. doi: 10.1016/j.echo.2014.09.017. [DOI] [PubMed] [Google Scholar]
- 18.Spinner EM, Buice D, Yap CH, Yoganathan AP. The effects of a three-dimensional, saddle-shaped annulus on anterior and posterior leaflet stretch and regurgitation of the tricuspid valve. Ann Biomed Eng. 2012;40:996–1005. doi: 10.1007/s10439-011-0471-6. [DOI] [PubMed] [Google Scholar]
- 19.Spinner EM, Lerakis S, Higginson J, Pernetz M, Howell S, Veledar E, et al. Correlates of tricuspid regurgitation as determined by 3D echocardiography: pulmonary arterial pressure, ventricle geometry, annular dilatation, and papillary muscle displacement. Circ Cardiovasc Imaging. 2012;5:43–50. doi: 10.1161/CIRCIMAGING.111.965707. [DOI] [PubMed] [Google Scholar]
- 20.Yiu KH, Wong A, Pu L, Chiang MF, Sit KY, Chan D, et al. Prognostic value of preoperative right ventricular geometry and tricuspid valve tethering area in patients undergoing tricuspid annuloplasty. Circulation. 2014;129:87–92. doi: 10.1161/CIRCULATIONAHA.113.003811. [DOI] [PubMed] [Google Scholar]
- 21.Mediratta A, Addetia K, Yamat M, Moss JD, Nayak HM, Burke MC, et al. 3D echocardiographic location of implantable device leads and mechanism of associated tricuspid regurgitation. JACC Cardiovasc Imaging. 2014;7:337–47. doi: 10.1016/j.jcmg.2013.11.007. [DOI] [PubMed] [Google Scholar]
- 22.Muraru D, Badano LP, Sarais C, Solda E, Iliceto S. Evaluation of tricuspid valve morphology and function by transthoracic three-dimensional echocardiography. Curr Cardiol Rep. 2011;13:242–9. doi: 10.1007/s11886-011-0176-3. [DOI] [PubMed] [Google Scholar]
- 23.Nucifora G, Badano LP, Allocca G, Gianfagna P, Proclemer A, Cinello M, et al. Severe tricuspid regurgitation due to entrapment of the anterior leaflet of the valve by a permanent pacemaker lead: role of real time three-dimensional echocardiography. Echocardiography. 2007;24:649–52. doi: 10.1111/j.1540-8175.2007.00443.x. [DOI] [PubMed] [Google Scholar]
- 24.Pothineni KR, Duncan K, Yelamanchili P, Nanda NC, Patel V, Fan P, et al. Live/real time three-dimensional transthoracic echocardiographic assessment of tricuspid valve pathology: incremental value over the two-dimensional technique. Echocardiography. 2007;24:541–52. doi: 10.1111/j.1540-8175.2007.00451.x. [DOI] [PubMed] [Google Scholar]
Associated Data
This section collects any data citations, data availability statements, or supplementary materials included in this article.


