Abstract
Despite the fact that pigs are reputed to have excellent olfactory abilities, few studies have examined regions of the pig brain involved in the sense of smell. The present study provides an overview of the olfactory bulb, anterior olfactory nucleus, and piriform cortex of adult pigs using several approaches. Nissl, myelin, and Golgi stains were used to produce a general overview of the organization of the regions and confocal microscopy was employed to examine 1) projection neurons, 2) GABAergic local circuit neurons that express somatostatin, parvalbumin, vasoactive intestinal polypeptide, or calretinin, 3) neuromodulatory fibers (cholinergic and serotonergic), and 4) glia (astrocytes and microglia). The findings revealed that pig olfactory structures are quite large, highly organized and follow the general patterns observed in mammals.
Key words: anterior olfactory nucleus, olfactory bulb, olfactory cortex, olfactory peduncle, piriform cortex
Introduction
The domestic pig (Sus scrofa) is a member of the diverse and highly successful order Cetartiodactyla (also called artiodactyl, the “even-toed ungulates,” which includes tylopoda [camels], ruminantia [cattle, goats, sheep, deer, and antelope], cetancodonta [hippos, dolphins, and whales], and suiformes [pigs and peccaries]; Price et al. 2005). Pigs and people have lived together for about 10000 years (Giuffra et al. 2000; Amaral et al. 2011; Groenen et al. 2012; Meiri et al. 2013). Although both species are very intelligent, have evolved complex social interactions, and are omnivores that are prone to obesity, pigs are considered to have much more sophisticated olfactory abilities (Pond and Houpt 1978). Both wild and domestic pigs use odors for the recognition of ingroup/outgroup differences, status, sexual receptivity, and to keep roving bands together (Watson 2004). Pigs have evolved 9 glands for the production of odors (digital, preputial, vulvar, anal, mental, salivary, buccal, pre-orbital, and Harderian glands; Pond and Houpt 1978; Watson 2004) and they have one of the largest olfactory receptor repertoires with 1113 functional olfactory receptor genes and 188 pseudogenes (Nguyen et al. 2012; Paudel et al. 2015).
Despite the fact that pigs are legendary for their ability to detect items such as truffles on the basis of their sense of smell, very little attention has been given to describing regions of the pig brain involved in olfaction. Most existing studies appear to have been motivated by the species’ economic importance. Because reproduction in pigs is facilitated by odors (Signoret 1970; Booth and Signoret 1992; Sorensen 1996; Rekwot et al. 2001) several studies have examined the pig vomeronasal system and the perception of pheromones (McGlone 1985; Vieuille-Thomas and Signoret 1992; Guiraudie et al. 2003; Salazar et al. 2003, 2004; Park et al. 2012) or have examined the role of the main olfactory system in detecting odors deemed to be pheromones (Macleod et al. 1979; Dorries et al. 1997). Other studies have examined factors helping to specify the early food preferences of weanlings (Baldwin 1980; Morrow-Tesch and McGlone 1990a, 1990b; Parfet and Gonyou 1991; Kristensen et al. 2001; McGlone and Anderson 2002; Oostindjer et al. 2011). Apart from these works, the remaining few studies have examined diverse other aspects of their olfactory systems, including their ability to use odors to discriminate conspecifics (Meese et al. 1975), the dynamics of neuron addition in the young olfactory bulb (OB; Martin et al. 2013), the effects of OB removal (Meese and Baldwin 1975; Booth and Baldwin 1980; Booth et al. 1981; Kirkwood et al. 1981; Koba and Tanida 2001; Søndergaard et al. 2010), estimates of odor sensory capacities in minipigs (Koba and Tanida 2001; Søndergaard et al. 2010), examinations of nasal patency cycles (Eccles and Maynard 1975; Eccles 1978), odorant binding proteins in the nasal mucosa (Hajjar et al. 2006; Nagnan-Le Meillour et al. 2014), OB luteinizing hormone releasing hormone expression (Leshin et al. 1991), abnormal development (Venneman et al. 1982), and general physiology/synaptology (Kornguth et al. 1976; Reinhardt et al. 1981). A species with such varied and differentiated olfactory capacities deserves more rigorous study. The present work provides a basic examination of the pig olfactory brain through Nissl, Golgi, and fluorescence-immunostained sections of the OB, anterior olfactory nucleus (AON), and piriform cortex (PC). The results indicate that the olfactory structures in the pig are very similar to those seen in lab rodents and other species, although much larger.
Materials and methods
Subjects
All procedures were performed according to NIH guidelines and protocols approved by the University of Virginia Animal Care and Use Committee (PHS service assurance number A3245-01; USDA registration: 52-R-0011). Young (30–36kg) female Yorkshire pigs were housed in temperature- and humidity-controlled rooms maintained on a 12:12 light:dark cycle with 8753 Miniswine Diet (Envigo) and water ad libitum. Ten pigs were euthanized via overdose of Euthasol (0.39mg drug/g body weight; Virbac); their brains were then removed and either the whole organ or dissected portions fixed by immersion in freshly prepared 4% paraformaldehyde in 0.01M phosphate buffer (pH 7.4 PBS) at 4 °C. One pig was anesthetized with Telazol (Zoetis) and Ansed (Lloyd, Inc.), intubated, ventilated and maintained under deep anesthesia on isoflurane (Minrad) to facilitate perfusion through the heart with cold PBS followed by freshly prepared cold 4% paraformaldehyde.
Tissue preparation
Coronal brain sections were cut at 60 µm with a vibratome; the tissue was then stained by a number of methods. Nissl (thionen) staining was accomplished by standard means. These sections were used to estimate the number of OB glomeruli using the Cavalieri method (Maresh et al. 2008). In order to estimate OB size the mitral cell layer (MCL) was used as a metric because the lamina’s location in the middle of the bulb made it much less susceptible to damage in these large and very delicate pieces of tissue. In each of 4 regions of the bulb (each separated by approximately 3mm) the areas of approximately 40 contiguous glomeruli were measured, their mean diameters calculated, and the number/length of the underlying MCL calculated. Total MCL length was estimated by measuring the perimeter of the layer in every 50th section through the bulb. Values from adjacent measured sections (e.g., sections 1 and 50, sections 50 and 100, etc.) were averaged, multiplied by the number intervening sections and the results summed to yield an estimate of laminar size. Total numbers of glomeruli were determined by multiplying the average number of glomeruli/µm2 by the estimated surface area of the MCL and corrected with the Abercrombie method (Guillery and Herrup 1997).
Myelin was visualized with Schmued’s Black Gold using methods described previously (Brunjes et al. 2011). To visualize neuronal dendritic morphology, portions of unfixed brains were placed in Golgi–Cox solution using procedures previously described (Glaser and Van der Loos 1981; Brunjes and Kenerson 2010). Test sections from neocortical regions were examined regularly to determine optimal impregnation. By varying the staining time to accommodate each subject, complete staining was obtained in all samples, minimizing possible artifacts. The tissue was then embedded in celloidin, sectioned at 120 µm, counterstained with methylene blue, dehydrated, mounted, and coverslipped with DPX (Electron Microscope Sciences). In order to compare the size of pig neurons with those of lab rodents, methods described previously (Brunjes and Kenerson 2010; Brunjes et al. 2011) were used to reconstruct pyramidal neurons from pars principalis of the AON (AONpP). Briefly, cells were traced at 400× by using a computer-controlled microscope system (Neurolucida: MBF Biosciences). Every attempt was made to select and reconstruct well-stained cells centered in the section such that the bulk of the dendritic field was not truncated or obscured. A general estimate of the number and extent of the dendritic arborizations was made using the “branch” analysis: processes originating in the cell body were labeled “primary,” subsequent branches of these dendrites were cataloged as second, third, fourth (etc.) order processes. The number of branches at each order as well as their length was recorded. Data for apical and basilar branches were tallied separately.
Fluorescence immunohistochemistry was used to stain free-floating 60 µm-thick vibratome sections. The sections were rinsed 4 times in 0.01M phosphate buffered saline (PBS pH 7.4). Next, the tissue was incubated in 0.01M citrate buffer pH 8.5 at 80 °C (2×15min, Jiao et al. 1999). After cooling at room temperature for 5min, the sections were washed in PBS (2×2.5min), permeablized in 0.03% Triton in PBS (TW: 4×5min), and placed into blocking solution (0.5% normal donkey serum in TW; Jackson ImmunoResearch) for 1h. Sections were then placed into primary antibody (Table 1) at least overnight at 4 °C. They were then washed (PBS 4×5min) and incubated in secondary antibody (1/250 to 1/450 in TW: Jackson ImmunoResearch. donkey anti-rabbit: catalog number 711-165-152 or 711-545-152; donkey anti-goat: 705-165-147 or 705-545-147; donkey anti-mouse: 715-485-150 or 715-545-151; donkey anti-rat: 712-165-153) for 1h, washed again (PBS 4×5min) and mounted on slides with SlowFade mounting media (S36937: Invitrogen). To observe tissue organization some sections were also Nissl-stained (640nm Neurotrace; Invitrogen: N-21483). In each case, deletion of the primary antibody resulted in no staining.
Table 1.
Antibody information
| Antigen | Immunogen | Manufacturer | Cat./lot no. | Species | Dilution |
|---|---|---|---|---|---|
| 5-HT | Serotonin coupled to BSA | Immunostar | 20080/924005 | Rabbit polyclonal | 1:1000 |
| CR | Rat CR | Millipore | AB1550/2024183 | Goat polyclonal | 1:1000 |
| CHAT | Human placental enzyme | Millipore | AB144P/NG1780580 | Goat polyclonal | 1:100 |
| GFAP | Bovine spinal cord isolate | Dako | Z 0334/00076532 | Rabbit polyclonal | 1:500 |
| IBA-1 | Synthetic peptide corresponding to the c terminus of IBA-1 | Wako | 09-197421/WEE4506 | Rabbit polyclonal | 1:1000 |
| PARV | PARV purified from carp muscle | Swant | 235/10(F) | Mouse monoclonal | 1:5000 |
| SOM | SOM coupled to KLH | ImmunoStar | 20067/216002 | Rabbit polyclonal | 1:5000 |
| TBR-1 | Amino acids 1–200 at the N-terminus of mouse TBR-1 | Santa Cruz | SC-48816/10409 | Rabbit polyclonal | 1:100 |
| VIP | VIP coupled to bovine thyroglobulin | ImmunoStar | 20077/1129001 | Rabbit polyclonal | 1:1000 |
Results
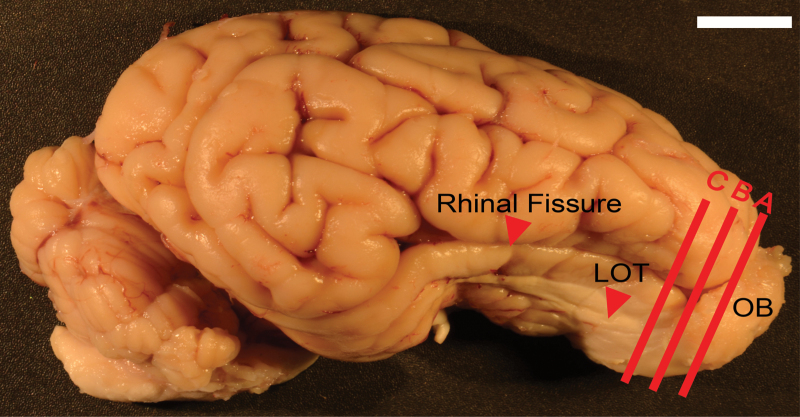
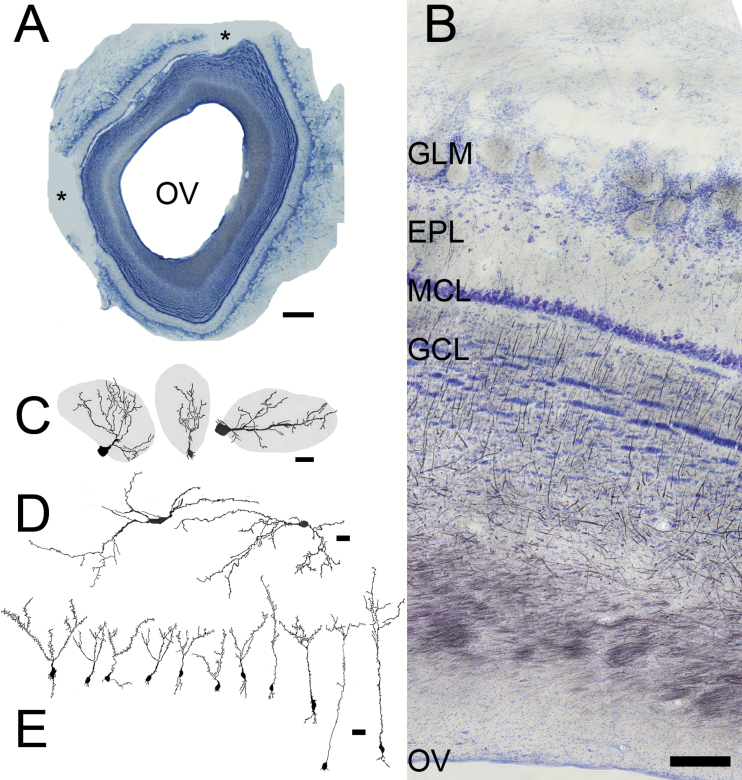
Adult pig brains are large, measuring almost 10cm from rostral tip to the back of the cerebellum, and weigh about 90g (Figure 1). The rhinal fissure extends for over 5cm, delineating the extensive olfactory cortex from the much more convoluted neocortex. Located at the rostral end of the brain, the OB is quite large; cut from the remainder of the brain at the frontal pole of neocortex it weighs about 3g and has a volume of 3ml. In one specimen there were approximately 260 sixty micron coronal sections through the structure. The neuropil of the OB encircles a large olfactory ventricle that extends caudally into the olfactory peduncle, finally merging into the lateral ventricles (Figure 2A). During early development, the walls of the ventricle produce neurons that will populate the OB (e.g., Hinds 1968). In some species (e.g., mice, rats) it collapses with maturation while in diverse others it remains open throughout life (e.g., other members of the suiformes, ruminantia, marsupials such as Didelphis virginiana and Monodelphis domestica, rabbits Oryctolagus cuniculus, armadillos, Dasypus novemcinctus as well as others. See http://www.brainmuseum.org/). There are no reported functional olfactory differences between animals in which the ventricle is either patent or closed.
Figure 1.
Pig brain from the lateral side, anterior to right and dorsal to top. A, B, C = approximate planes of section for Nissl sections in Figures 2A, 5A and 7A, respectively. Red arrow delineates the rhinal fissure, which separates the olfactory cortex (ventral) from the cerebral cortex (dorsal). Scale bar = 1cm.
Figure 2.
Sections from the OB. (A) Low magnification picture (scale bar = 1mm) showing the large olfactory ventricle (OV) and the easily recognizable laminar structure of the bulb. Asterisks = missing portions. (B) Nissl (blue)/myelin (black) staining. Superficial at top, the OV at bottom. The characteristic layers of the bulb include the glomerular layer (GLM), with its spherical regions of neuropil, the broad, relatively cell free EPL, compact MCL, and striated GCL. Scale bar = 200 µm. (C, D) Camera lucida drawings of Golgi–Cox stained cells, scale bars = 25 µm. (C) Periglomerular cells, whose dendrites extend into glomeruli (grey) and their somata are found in region between the glomeruli. (D) Large, horizontal cells from the EPL. (E) Granule cells, whose dendritic tufts are located in the EPL and somata in the superficial (left) to deep (right) GCL. The cell body of the left-most granule cell was located deep within the MCL.
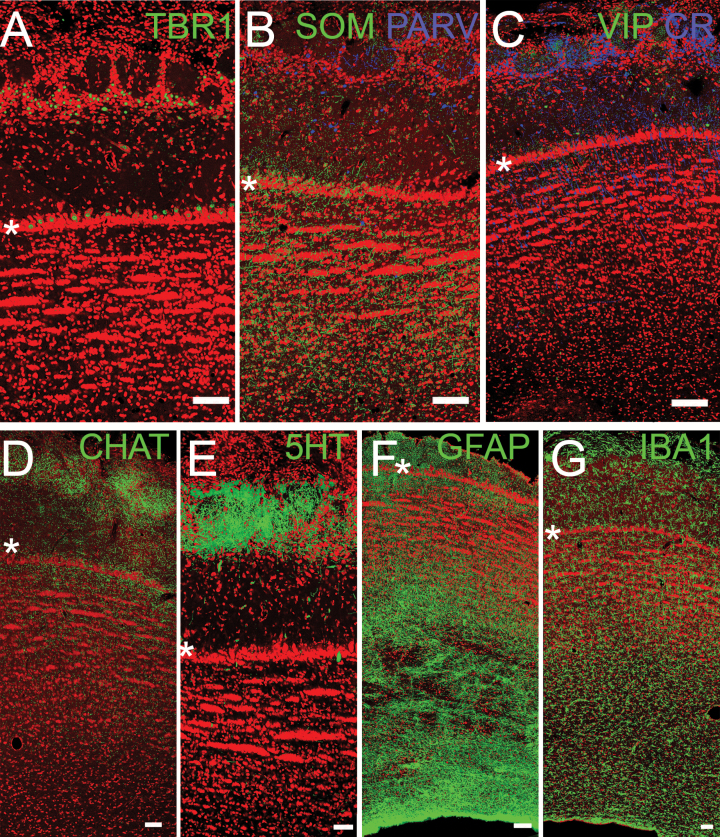
The most superficial region of the OB, the thick olfactory nerve layer, contains the incoming axons of the olfactory sensory neurons that reside in the olfactory mucosa of the nasal cavity (Figure 2B: see Shepherd et al. 2004; Mori 2014; Ennis and Holy 2015 for an overview of the structure of the mammalian OB). The fact the layer is so deep suggests that the pig has both a large number as well as diverse kinds on olfactory sensory neurons (Nguyen et al. 2012). The layer just deep to this superficial region contains spherical shaped regions of neuropil known as glomeruli. Considerable variation in glomerular size was observed; in general the largest were found in the dorsal OB. Average glomerular area was about 10800 µm2 with a range of 2400 to 42000µm2. Using the methods described above it was estimated that there are about 11000 glomeruli in these large bulbs. In the glomeruli the axons of the olfactory nerve ramify and synapse on neuronal elements in the OB. Periglomerular neurons are one variety of these cells; they are interneurons found between and around the glomeruli (Figure 2C). The other neurons receiving direct input are the mitral and tufted cells that are the main projection neurons of the OB. These neurons are immunoreactive for TBR1, a transcription factor shared by many of the projection neurons in the telencephalon (Figure 3A; Brunjes and Osterberg 2015).
Figure 3.
Confocal images of OB. Asterisks delineate the MCL for orientation (Figure 2B). (A) TBR1 staining (green) labels projection neurons: mitral and tufted cells. (B, C) Interneurons stained for SOM, PARV, VIP, and CR. (D, E) Neuromodulatory inputs from higher brain regions, including cholinergic (CHAT) and serotonergic (5-HT) fibers. (F, G) Glial cells including astrocytes (GFAP) and microglia (IBA-1). Red = Nissl stain. Scale bars = 100µm
Beneath the glomeruli is the clearly defined external plexiform layer (EPL); it contains few cells (Figure 2B, D) but many synapses between the dendrites of mitral/tufted cells and granule cells (Figure 2C). The region does contain some horizontally oriented neurons intrinsic to the layer (Figure 2D). The deep border of the EPL is the thin MCL. The zone beneath the mitral cells is quite large, containing about half of the OB’s volume. The top portion of the submitral zone is the granule cell layer (GCL). It houses the largest population of OB neurons, the interneurons known as granule cells (Figure 2E) whose cell bodies are separated by white matter into characteristic islands. The deepest region is a very large layer of white matter containing axons entering the OB from higher brain regions including portions of the olfactory cortices as well as neuromodulatory elements from more caudal brain regions (Brunjes 2012). Myelin stains suggests that some bundling of axons occurs in the region (Figure 2B).
There are several varieties of GABAergic inhibitory interneurons in the OB including the periglomerular and granule cells. Many GABA-containing interneurons also express other markers, and these markers have been used to divide the population into different classes (Petilla Interneuron Nomenclature Group et al. 2008; Kay and Brunjes 2014). Figure 3B, C demonstrate that at least 4 of these classes exist in the pig OB: cells that express 1 of 2 calcium binding proteins (parvalbumin [PARV] or calretinin [CR]) or peptides (somatostatin [SOM] and vasoactive intestinal polypeptide [VIP]). Many of these cells are found in the periglomerular and EPLs. Figure 3 also demonstrates the pig OB is 1) receives both cholinergic (Figure 3D) and serotonergic (Figure 3E) innervation, especially in glomerular regions, as has been reported for laboratory rodent and other species (McLean and Shipley 1987; Gracia-Llanes et al. 2010; Salcedo et al. 2011; Liberia et al. 2015; Steinfeld et al. 2015) and 2) is densely populated by astrocytes (especially in deep layers, Figure 3F; Petzold et al. 2008; but see Roux et al. 2015) and microglia, scavenger cells found throughout the tissue with fewer observed in the granule cell zone (Figure 3G; Fiske and Brunjes 2000; Okere and Kaba 2000).
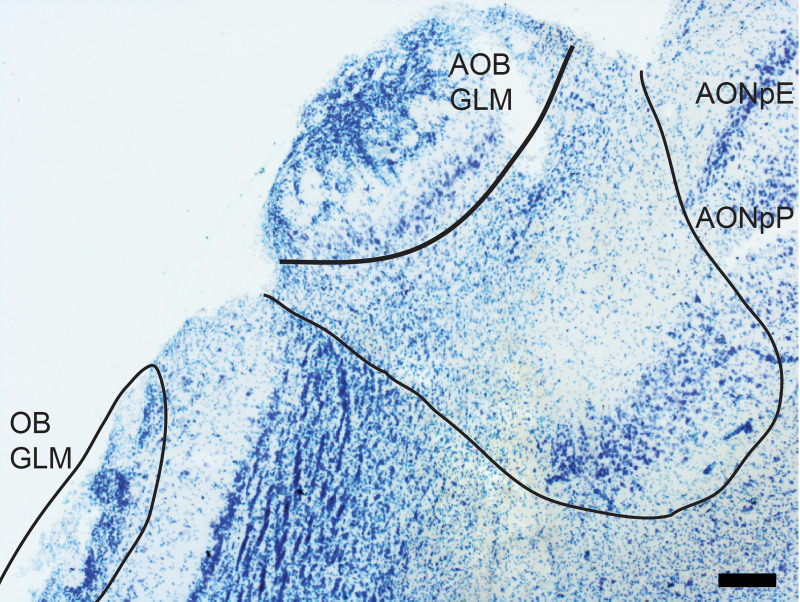
In the caudal OB, the MCL thins and then disappears on the dorsal surface of the bulb. The accessory OB becomes visible at the dorsal-medial edge of this region (Figure 4; the approximate location is also marked by an arrow in the much more caudal section shown in Figure 5). The AOB is organized in a similar fashion as the OB with glomeruli on the external surface. The external plexiform and MCLs are combined in a large single zone which overlies the densely packed GCL (Salazar et al. 2000).
Figure 4.
The accessory OB. This structure receives sensory input from the vomeronasal organ via the vomeronasal nerve, and is located on the dorsomedial surface of the caudal OB. The structure can be found just medial to the region in which the olfactory nerve and glomerular layer thin and then disappear. Medial to the AOB, the 2 regions that form the AON (AONpE) and AONpP emerge. Scale bar = 30 µm.
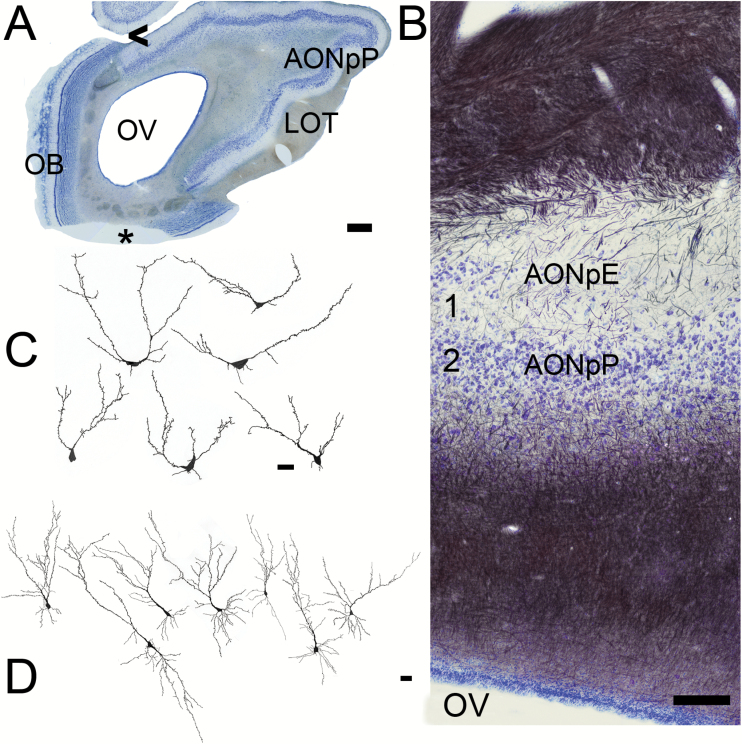
Figure 5.
Sections from the AON. (A) Low magnification picture (scale bar = 1mm). The OB is still present on the medial (left) side of the olfactory peduncle. The LOT is visible on the right (lateral) side. AONpP fills the remainder of the region on the lateral side. OV = olfactory ventricle. Asterisk = missing portion. (B) Nissl (blue)/myelin (black) staining. Superficial at top, the OV at bottom. The top of the section contains myelinated fibers and collaterals from the LOT. They thin toward the ventral side, indicating the beginning the Layer 1 (1A) of the AONpP. Under the cell poor Layer 1 is the cellular region, Layer 2. Beneath Layer 2 is a second large region of fibers that includes the axons of AON projection neurons and afferents from higher brain centers. Within Layer 1 AONpE can also be seen as a thin band of cells at the left side of the figure. Arrowhead = area where AOB is found in more rostral sections. Scale bar = 200 µm. (C, D) Camera lucida drawings of Golgi-stained cells. Scale bars = 50 µm. (C) AONpE cells. These characteristic cells have only a few apically directed dendrites arising from the cell body. (D) AONpP pyramidal cells. There neurons have a single apically directed dendrite (at top) and several basilar ones.
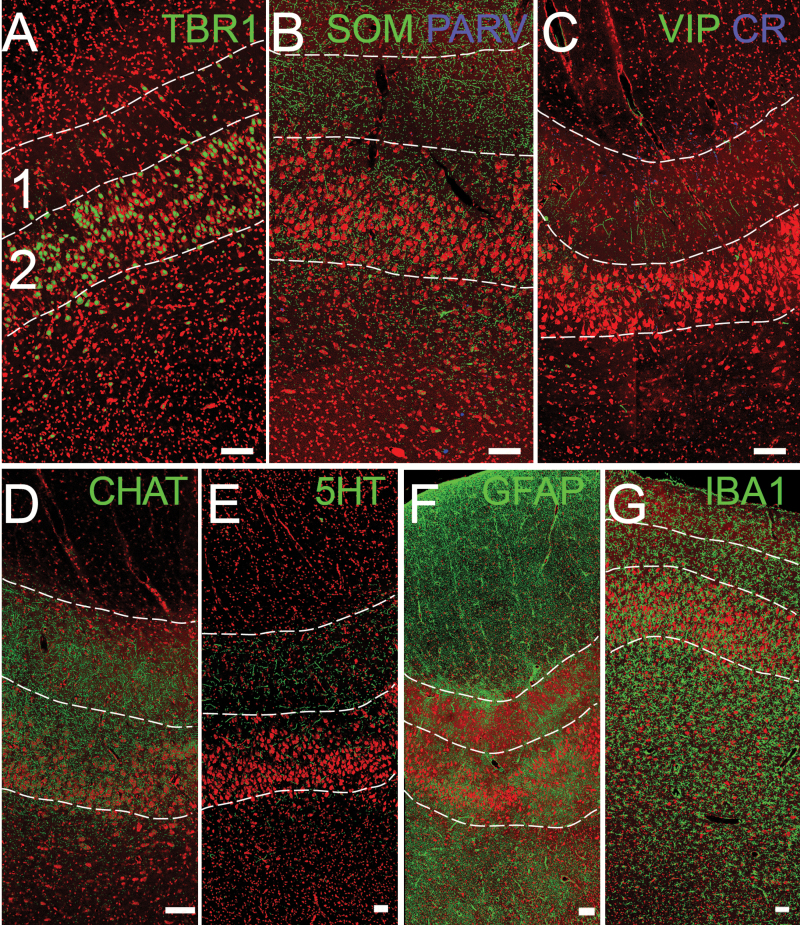
The splitting of the ring of mitral cells on the dorsal side also indicates the beginning of the “olfactory peduncle”: the stalk by which the OB is connected to the rest of the telencephalon. The medial OB extends quite far into the peduncle and thus in coronal sections is still obvious long after it has been replaced on the lateral side. The axons of the mitral and tufted cells exit the posterior OB to form the lateral olfactory tract (LOT). By convention, the regions innervated by the mitral and tufted cells are known as the portions of the “olfactory cortex” (Mori, 2014). The peduncle has 4 regions of olfactory cortex. Two are small, have received relatively little attention and are found more caudally than the region shown in Figure 4: the tenia tecta (also known as the ventral hippocampal rudiment, which is found on the medial side) and the dorsal peduncular cortex, found near where the peduncle merges with the neocortex. The other two comprise most of the peduncle and are collectively are known as the AON (Brunjes et al. 2005). The AON has 2 subdivisions. The first, pars externa (AONpE), is a narrow ribbon of cells found in the rostral peduncle. It forms at the edges of the gap left by the splitting of the MCL (Figure 5A, B). It is characterized by cells with a small number of apical dendrites and no basal processes (Figure 5C, Brunjes and Kenerson 2010). These cells receive a topographic map of the activity in the OB and relay it across the anterior commissure to the contralateral OB (Yan et al. 2008; Kikuta et al. 2010). The second, much larger structure is AONpP. This structure is often divided into subregions (pars dorsalis, pars lateralis, pars ventroposterior, and pars medialis) based on differences in organization and projections (Haberly and Price 1978; Brunjes et al. 2005). It has a simple, 2-layered cortical organization with an outer plexiform layer (Layer 1) and deeper neuronal layer (Layer 2, Figure 5B). Layer 1 is divided into Layer 1a, containing axon collaterals from OB projection neurons and the apical dendrites of Layer 2 neurons, and Layer 1b, containing association axons from olfactory cortical regions and sparse interneurons (Haberly and Price 1978). Layer 2 contains pyramidal cells, projection neurons that are a characteristic of forebrain cortices, which are immunoreactive for TBR1 (Figure 6A). In the pig these neurons are much larger than those of lab rodents. Pyramidal cells in the pig AONpP have 50% more dendritic branches and twice the total dendritic length as those of the rat or mouse (Table 2). AONpP has been shown to contain a number of different kinds of interneurons (Kay and Brunjes 2014) and varieties expressing somatostatin, parvalbumin, VIP, and CR were observed in the pig tissue (Figure 6B, C). Dense cholinergic staining was observed in both layers (Figure 6D): serotonergic staining was more modest and favored layer 1(Figure 6E). Both glial markers were also observed throughout the region, with the least dense staining observed in Layer 2 (Figure 6E, F).
Figure 6.
Confocal images of AONpP. The superficial side (pial) is toward the top, the olfactory ventricle to the bottom. The numbers 1 and 2 in (A) and dotted lines delineate the approximate boundaries of layers 1 and 2 for orientation (Figure 5B). (A) TBR1 staining (green) labels projection neurons: pyramidal cells. (B, C) Interneurons stained for SOM, PARV, VIP, and CR. (D, E) Neuromodulatory inputs from higher brain regions, including cholinergic (CHAT) and serotonergic (5-HT) fibers. (F, G) Glial cells, including astrocytes (GFAP) and microglia (IBA-1). Red = Nissl stain. Scale bar = 100 µm.
Table 2.
Comparative analysis of pyramidal cell dendrites from AONpP
| Mean number of branches | Total dendritic length | |||
|---|---|---|---|---|
| Apical | Basilar | Apical | Basilar | |
| Mousea | 20 | 15 | 705 | 383 |
| Ratb | 19 | 18 | 992 | 550 |
| Pig | 35 | 29 | 2256 | 1395 |
aData from Brunjes et al. (2011).
bData from Brunjes and Kenerson (2010).
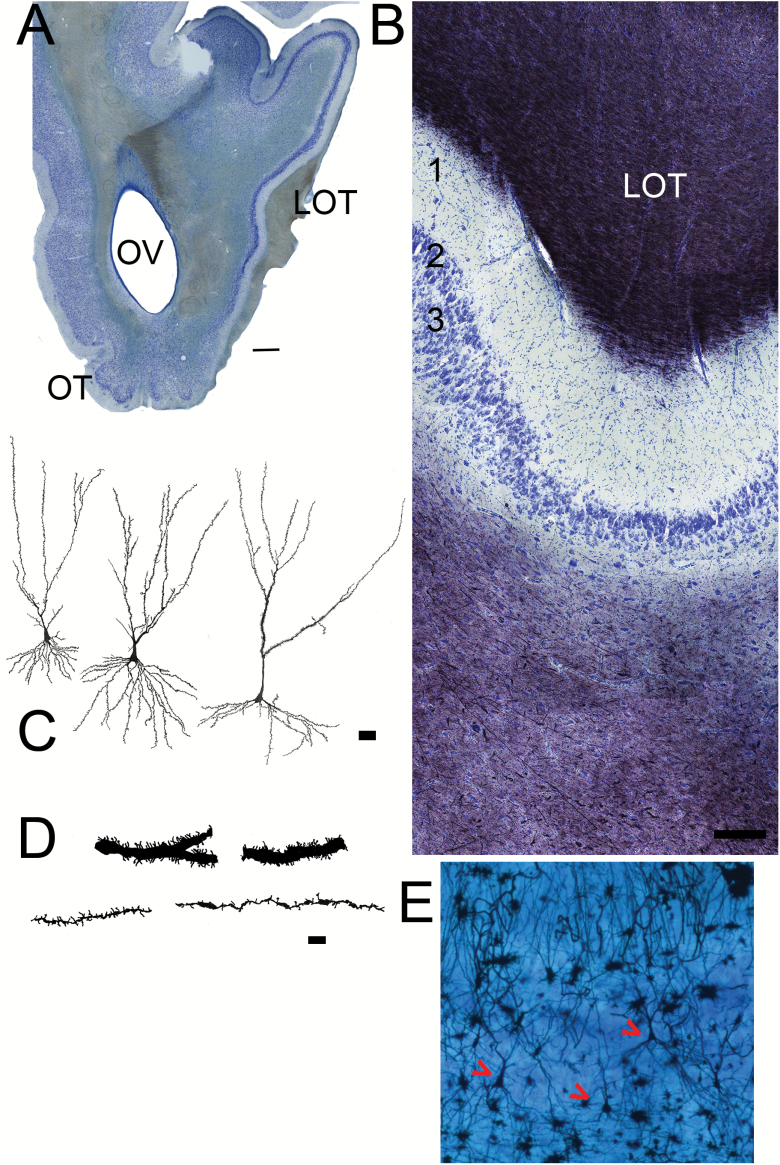
Two portions of the olfactory cortex are found just caudal to the olfactory peduncle (Figure 7). On the medial side is the olfactory tubercle, the route through which olfactory information enters into the ventral striatum (Payton et al. 2012). On the lateral side the AONpP merges with the much larger PC that extends most of the length of the forebrain to the entorhinal cortex (for an overview of the PC see Ekstrand et al. 2001; Wilson and Sullivan 2011; Mori 2014). Layer 1 of PC is similar to that seen in the AON; it is a superficial plexiform zone with the same subdivisions (Layer 1a and b) that encircles the LOT (Figure 7A, B). Unlike the AONpP, the PC contains 2 cellular layers. The superficial region, Layer 2, is thin and densely packed. It can be subdivided the superficial Layer 2A and deeper 2B, with the latter zone having a higher packing density. The deepest portion, Layer 3, is broader with more scattered and larger cells (Haberly and Price 1978). A number of subdivisions have been described in the PC of laboratory rodents. The primary division is into the anterior and posterior piriform cortices as they differ on the basis of their cytology (e.g., APC has a thinner Layer 3, receives a stronger input from the OB and is the source of more commissural projections; Haberly and Price 1978; Ekstrand et al. 2001; Mori 2014) and probably their function (e.g., the APC may be more involved in odor identification and the PPC in determining what perceptual category or categories the stimuli should be assigned; Kadohisa and Wilson 2006; Gottfried 2010; Mori 2014). APC has been further subdivided into several zones (Ekstrand et al. 2001; Mori 2014).
Figure 7.
Sections from the anterior PC. (A) Low magnification picture (scale bar = 1mm). The olfactory tubercle has emerged on the ventral side of the olfactory peduncle. The LOT is visible on the right (lateral) side. The APC occupies the entire lateral side of the peduncle. (B) Nissl (blue)/myelin (black) staining. Superficial at top. As in Figure 5, the top of the section contains myelinated fibers and collaterals from the LOT that thin toward the deeper regions indicating the beginning the Layer 1 (1A) of the APC. Under the cell poor Layer 1 are cellular layers 2 and 3. Scale bar = 200 µm. (C) Camera lucida drawings of pyramidal neurons from the APC. Scale bar = 50 µm. (D) Higher magnification drawings of sections of apical dendrites from APC pyramidal neurons. Some cells have large caliber dendrites with many spines (top), others have much finer processes with fewer spines (bottom). Scale bar = 10 µm. (E) Photomicrograph of Golgi/Nissl section showing three pyramidal neurons (red arrows).
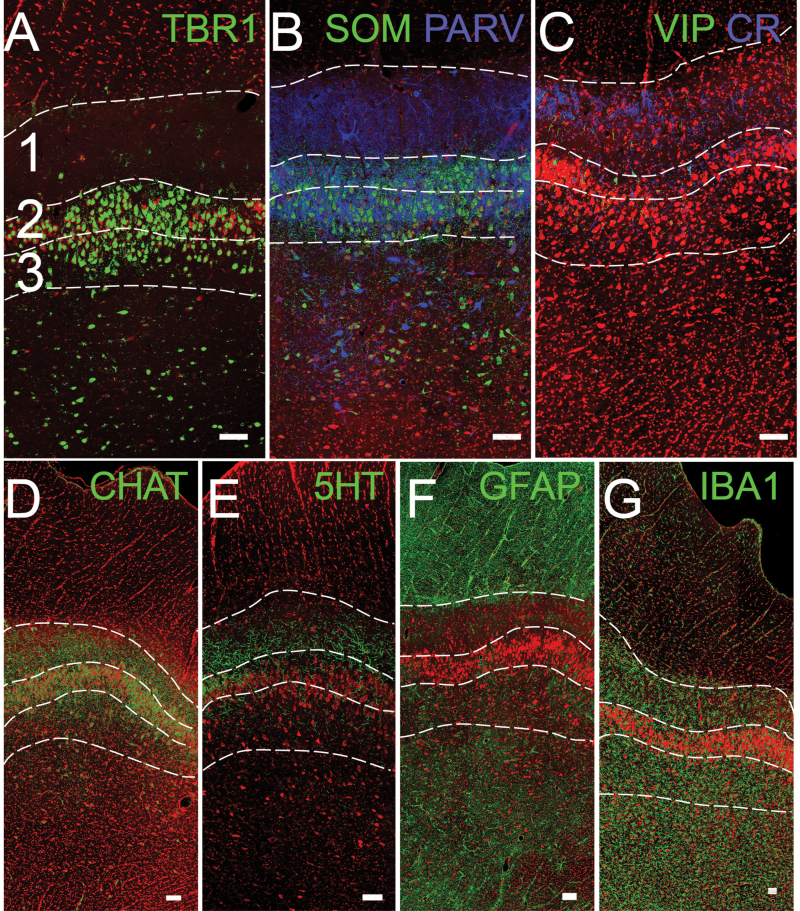
Both Layer 1 and 2 contain pyramidal-shaped projection neurons (Figure 7C, E) that can be identified with antibodies to TBR1 (Figure 8A). Subclasses of these neurons exist, which is obvious in Golgi-stained material as some have larger caliber dendrites that are more densely spined (Figure 7D). All 3 layers contain a variety of interneurons (Figure 8B, C; Bekkers and Suzuki 2013). The distribution of fibers from both the cholinergic (Figure 8D) and serotonergic (Figure 8E) systems are similar to that observed in AONpP. Astrocytes (Figure 8E) were found to be densest in the LOT and deep structures (Figure 8E), while microglia were more prevalent in layers 1 and 3 (Figure 8F). At levels more caudal than the 3 regions outlined in Figure 1 lie several other portions of the olfactory cortex including the posterior PC, cortical amygdaloid nuclei (nucleus of the LOT, anterior cortical amygdaloid nucleus, and posterolateral cortical amygdaloid nucleus), and lateral entorhinal area.
Figure 8.
Confocal images of the anterior PC. The superficial side (pial) is toward the top. The numbers 1, 2, and 3 in panel (A) and dotted lines delineate the approximate borders of layers 1–3 for orientation (Figure 7B). (A) TBR1 staining (green) labels projection neurons: pyramidal cells. (B, C) Interneurons stained for SOM, PARV, VIP, and CR. (D, E) Neuromodulatory inputs from higher brain regions, including cholinergic (CHAT) and serotonergic (5-HT) fibers. (F, G) Glial cells including astrocytes (GFAP) and microglia (IBA-1). Red = Nissl stain. Scale bars = 100 µm.
Discussion
The data presented above provide a description of the general organization of regions of the pig’s brain devoted to the initial processing of odor stimuli. The olfactory areas are quite large and well organized, doubtlessly due to the central role that sense of smell plays in the life of S. scrofa. Compared with total body weight, pig brains are smaller (0.05%) than humans (2.0%; Pond and Houpt 1978) but even a superficial perusal of gross brain morphology indicates that olfactory system structures of pigs are much more prominent. We observed that the OB accounts for approximately 7% of brain size, whereas in humans it is only about 0.01% (Kavoi and Jameela 2011). Results presented above indicate that there are approximately 11000 olfactory glomeruli/OB in the pig. Nguyen et al. (2012) reported that there are 1113 functional olfactory receptor genes in the species, indicating that there are about 10 glomeruli/gene. The estimate is much higher than that reported for mice [3 to 1: 3600 glomeruli (Richard et al. 2010) and 1200 genes (Zhang et al. 2007)] but not as high as estimates for people (16/1: 5500 glomeruli and 350 genes; Maresh et al., 2008). However, the human olfactory system seems much different than many other mammals in that there are very large numbers of pseudogenes and sequence variations (Maresh et al. 2008). Finally, the results of a quantitative Golgi analysis of the dendritic extent and complexity of AONpP pyramidal cells (Table 2) indicates that neuronal size is also larger in the pig than in laboratory rodents. These observations follow general neuronal/body size scaling rules previously observed (Purves and Lichtman 1985).
The methods employed in the present paper did not uncover any unusual specializations in the olfactory regions observed: the organization of the OB and olfactory cortices are quite similar to what is encountered in many mammalian species. The similarities include the general organizational patterns observed in Nissl and myelin sections, as well as similar varieties of projection and interneurons, neuromodulatory afferents and glia. Nevertheless, as one of the first detailed examination of a member of the Suidae family, the findings are an important step toward an understanding of the phylogeny of olfaction.
Funding
This work was supported by National Institutes of Health/National Institute on Deafness and Other Communication Disorders [DC000338].
Acknowledgment
This research was conducted in the absence of any commercial or financial relationships that could be construed as a potential conflict of interest.
References
- Amaral AJ, Ferretti L, Megens HJ, Crooijmans RP, Nie H, Ramos-Onsins SE, Perez-Enciso M, Schook LB, Groenen MA. 2011. Genome-wide footprints of pig domestication and selection revealed through massive parallel sequencing of pooled DNA. PLoS One. 6(4):e14782. [DOI] [PMC free article] [PubMed] [Google Scholar]
- Baldwin BA. 1980. Operant studies and preference tests on the role of olfaction and taste in the ingestive behaviour of pigs and ruminants. Fortschr Tierphysiol Tierernahr. (11):36–42. [PubMed] [Google Scholar]
- Bekkers JM, Suzuki N. 2013. Neurons and circuits for odor processing in the piriform cortex. Trends Neurosci. 36(7):429–438. [DOI] [PubMed] [Google Scholar]
- Booth W, Signoret J. 1992. Olfaction and reproduction in ungulates. Oxf Rev Reprod Biol. 14:263–301. [PubMed] [Google Scholar]
- Booth WD, Baldwin BA. 1980. Lack of effect on sexual behaviour or the development of testicular function after removal of olfactory bulbs in prepubertal boars. J Reprod Fertil. 58(1):173–182. [DOI] [PubMed] [Google Scholar]
- Booth WD, Baldwin BA, Poynder TM, Bannister LH, Gower DB. 1981. Degeneration and regeneration of the olfactory epithelium after olfactory bulb ablation in the pig: a morphological and electrophysiological study. Q J Exp Physiol. 66(4):533–540. [DOI] [PubMed] [Google Scholar]
- Brunjes PC. 2012. The mouse olfactory peduncle. 2. The anterior limb of the anterior commissure. Front Neuroanat. 6:51. [DOI] [PMC free article] [PubMed] [Google Scholar]
- Brunjes PC, Kenerson MC. 2010. The anterior olfactory nucleus: quantitative study of dendritic morphology. J Comp Neurol. 518(9):1603–1616. [DOI] [PMC free article] [PubMed] [Google Scholar]
- Brunjes PC, Kay RB, Arrivillaga JP. 2011. The mouse olfactory peduncle. J Comp Neurol. 519(14):2870–2886. [DOI] [PMC free article] [PubMed] [Google Scholar]
- Brunjes PC, Illig KR, Meyer EA. 2005. A field guide to the anterior olfactory nucleus (cortex). Brain Res Brain Res Rev. 50(2):305–335. [DOI] [PubMed] [Google Scholar]
- Brunjes PC, Osterberg SK. 2015. Developmental markers expressed in neocortical layers are differentially exhibited in olfactory cortex. PLoS One. 10(9):e0138541. [DOI] [PMC free article] [PubMed] [Google Scholar]
- Dorries KM, Adkins-Regan E, Halpern BP. 1997. Sensitivity and behavioral responses to the pheromone androstenone are not mediated by the vomeronasal organ in domestic pigs. Brain Behav Evol. 49(1):53–62. [DOI] [PubMed] [Google Scholar]
- Eccles R. 1978. The domestic pig as an experimental animal for studies on the nasal cycle. Acta Otolaryngol. 85(5–6):431–436. [DOI] [PubMed] [Google Scholar]
- Eccles R, Maynard RL. 1975. Proceedings: studies on the nasal cycle in the immobilized pig. J Physiol. 247(1):1P. [PMC free article] [PubMed] [Google Scholar]
- Ekstrand JJ, Domroese ME, Johnson DM, Feig SL, Knodel SM, Behan M, Haberly LB. 2001. A new subdivision of anterior piriform cortex and associated deep nucleus with novel features of interest for olfaction and epilepsy. J Comp Neurol. 434(3):289–307. [DOI] [PubMed] [Google Scholar]
- Ennis M, Holy T. 2015. Anatomy and neurobiology of the main and accessory olfactory bulbs. In: Doty R, editor. Handbook of olfaction and gustation. 3rd ed New York: Wiley; p. 157. [Google Scholar]
- Fiske BK, Brunjes PC. 2000. Microglial activation in the developing rat olfactory bulb. Neuroscience. 96(4):807–815. [DOI] [PubMed] [Google Scholar]
- Giuffra E, Kijas JM, Amarger V, Carlborg O, Jeon JT, Andersson L. 2000. The origin of the domestic pig: independent domestication and subsequent introgression. Genetics. 154(4):1785–1791. [DOI] [PMC free article] [PubMed] [Google Scholar]
- Glaser EM, Van der Loos H. 1981. Analysis of thick brain sections by obverse-reverse computer microscopy: application of a new, high clarity Golgi–Nissl stain. J Neurosci Methods. 4(2):117–125. [DOI] [PubMed] [Google Scholar]
- Gottfried JA. 2010. Central mechanisms of odour object perception. Nat Rev Neurosci. 11(9):628–641. [DOI] [PMC free article] [PubMed] [Google Scholar]
- Gracia-Llanes FJ, Blasco-Ibáñez JM, Nácher J, Varea E, Liberia T, Martínez P, Martínez-Guijarro FJ, Crespo C. 2010. Synaptic connectivity of serotonergic axons in the olfactory glomeruli of the rat olfactory bulb. Neuroscience. 169(2):770–780. [DOI] [PubMed] [Google Scholar]
- Groenen MA, Archibald AL, Uenishi H, Tuggle CK, Takeuchi Y, Rothschild MF, Rogel-Gaillard C, Park C, Milan D, Megens HJ, et al. 2012. Analyses of pig genomes provide insight into porcine demography and evolution. Nature. 491(7424):393–398. [DOI] [PMC free article] [PubMed] [Google Scholar]
- Guillery RW, Herrup K. 1997. Quantification without pontification: choosing a method for counting objects in sectioned tissues. J Comp Neurol. 386(1):2–7. [DOI] [PubMed] [Google Scholar]
- Guiraudie G, Pageat P, Cain AH, Madec I, Nagnan-Le Meillour P. 2003. Functional characterization of olfactory binding proteins for appeasing compounds and molecular cloning in the vomeronasal organ of pre-pubertal pigs. Chem Senses. 28(7):609–619. [DOI] [PubMed] [Google Scholar]
- Haberly LB, Price JL. 1978. Association and commissural fiber systems of the olfactory cortex of the rat. II. Systems originating in the olfactory peduncle. J Comp Neurol. 181(4):781–807. [DOI] [PubMed] [Google Scholar]
- Hajjar E, Perahia D, Débat H, Nespoulous C, Robert CH. 2006. Odorant binding and conformational dynamics in the odorant-binding protein. J Biol Chem. 281(40):29929–29937. [DOI] [PubMed] [Google Scholar]
- Hinds JW. 1968. Autoradiographic study of histogenesis in the mouse olfactory bulb. I. Time of origin of neurons and neuroglia. J Comp Neurol. 134(3):287–304. [DOI] [PubMed] [Google Scholar]
- Jiao Y, Sun Z, Lee T, Fusco FR, Kimble TD, Meade CA, Cuthbertson S, Reiner A. 1999. A simple and sensitive antigen retrieval method for free-floating and slide-mounted tissue sections. J Neurosci Methods. 93(2):149–162. [DOI] [PubMed] [Google Scholar]
- Kadohisa M, Wilson DA. 2006. Separate encoding of identity and similarity of complex familiar odors in piriform cortex. Proc Natl Acad Sci U S A. 103(41):15206–15211. [DOI] [PMC free article] [PubMed] [Google Scholar]
- Kavoi B, Jameela H. 2011. Comparative morphometry of the olfactory bulb, tract and stria in the human, dog and goat. Int J Morphol. 29(3):939–946. [Google Scholar]
- Kay RB, Brunjes PC. 2014. Diversity among principal and GABAergic neurons of the anterior olfactory nucleus. Front Cell Neurosci. 8:111. [DOI] [PMC free article] [PubMed] [Google Scholar]
- Kikuta S, Sato K, Kashiwadani H, Tsunoda K, Yamasoba T, Mori K. 2010. Neurons in the anterior olfactory nucleus pars externa detect right or left localization of odor sources. Proc Natl Acad Sci U S A. 107(27):12363–12368. [DOI] [PMC free article] [PubMed] [Google Scholar]
- Kirkwood RN, Forbes JM, Hughes PE. 1981. Influence of boar contact on attainment of puberty in gilts after removal of the olfactory bulbs. J Reprod Fertil. 61(1):193–196. [DOI] [PubMed] [Google Scholar]
- Koba Y, Tanida H. 2001. How do miniature pigs discriminate between people? Discrimination between people wearing coveralls of the same colour. Appl Anim Behav Sci. 73(1):45–58. [DOI] [PubMed] [Google Scholar]
- Kornguth S, Juhl U, Knobeloch L, Sunderland E, Johnson T, Scott G. 1976. Isolation of dendrodendritic synapses from swine olfactory bulbs. Brain Res. 105(3):423–435. [DOI] [PubMed] [Google Scholar]
- Kristensen HH, Jones RB, Schofield CP, White RP, Wathes CM. 2001. The use of olfactory and other cues for social recognition by juvenile pigs. Appl Anim Behav Sci. 72(4):321–333. [DOI] [PubMed] [Google Scholar]
- Leshin LS, Kineman RD, Crim JW, Rampacek GB, Kraeling RR. 1991. Immunocytochemical localization of luteinizing hormone-releasing hormone within the olfactory bulb of pigs. Biol Reprod. 44(2):299–304. [DOI] [PubMed] [Google Scholar]
- Liberia T, Blasco-Ibáñez JM, Nácher J, Varea E, Lanciego JL, Crespo C. 2015. Synaptic connectivity of the cholinergic axons in the olfactory bulb of the cynomolgus monkey. Front Neuroanat. 9:28. [DOI] [PMC free article] [PubMed] [Google Scholar]
- Macleod N, Reinhardt W, Ellendorff F. 1979. Olfactory bulb neurons of the pig respond to an identified steroidal pheromone and testosterone. Brain Res. 164:323–327. [DOI] [PubMed] [Google Scholar]
- Maresh A, Rodriguez GD, Whitman M, Greer C. 2008. Principles of glomerular organization in the human olfactory bulb—implications for odor processing. PLoS One. 3(7):e2640. [DOI] [PMC free article] [PubMed] [Google Scholar]
- Martin LJ, Katzenelson A, Koehler RC, Chang Q. 2013. The olfactory bulb in newborn piglet is a reservoir of neural stem and progenitor cells. PLoS One. 8(11):e81105. [DOI] [PMC free article] [PubMed] [Google Scholar]
- McGlone JJ. 1985. Olfactory cues and pig agonistic behavior: evidence for a submissive pheromone. Physiol Behav. 34(2):195–198. [DOI] [PubMed] [Google Scholar]
- McGlone JJ, Anderson DL. 2002. Synthetic maternal pheromone stimulates feeding behavior and weight gain in weaned pigs. J Anim Sci. 80(12):3179–3183. [DOI] [PubMed] [Google Scholar]
- McLean JH, Shipley MT. 1987. Serotonergic afferents to the rat olfactory bulb: I. origins and laminar specificity of serotonergic inputs in the adult rat. J Neurosci. 7(10):3016–3028. [DOI] [PMC free article] [PubMed] [Google Scholar]
- Meese G, Baldwin B. 1975. The effects of ablation of the olfactory bulbs on aggressive behvarior in pigs. Appl Anim Ethol. 1:251. [Google Scholar]
- Meese GB, Conner DJ, Baldwin BA. 1975. Ability of the pig to distinguish between conspecific urine samples using olfaction. Physiol Behav. 15(1):121–125. [DOI] [PubMed] [Google Scholar]
- Meiri M, Huchon D, Bar-Oz G, Boaretto E, Horwitz LK, Maeir AM, Sapir-Hen L, Larson G, Weiner S, Finkelstein I. 2013. Ancient DNA and population turnover in southern levantine pigs—signature of the sea peoples migration? Sci Rep. 3:3035. [DOI] [PMC free article] [PubMed] [Google Scholar]
- Mori K. 2014. The olfactory system: from odor molecules to motivational behaviors. Japan: Springer. [Google Scholar]
- Morrow-Tesch J, McGlone JJ. 1990. a. Sensory systems and nipple attachment behavior in neonatal pigs. Physiol Behav. 47(1):1–4. [DOI] [PubMed] [Google Scholar]
- Morrow-Tesch J, McGlone JJ. 1990. b. Sources of maternal odors and the development of odor preferences in baby pigs. J Anim Sci. 68(11):3563–3571. [DOI] [PubMed] [Google Scholar]
- Nagnan-Le Meillour P, Vercoutter-Edouart AS, Hilliou F, Le Danvic C, Levy F. 2014. Proteomic analysis of pig (Sus scrofa) olfactory soluble proteome reveals O-linked-N-acetylglucosaminylation of secreted odorant-binding proteins. Front Endocrinol (Lausanne). 5:202. [DOI] [PMC free article] [PubMed] [Google Scholar]
- Nguyen DT, Lee K, Choi H, Choi MK, Le MT, Song N, Kim JH, Seo HG, Oh JW, Lee K, et al. 2012. The complete swine olfactory subgenome: expansion of the olfactory gene repertoire in the pig genome. BMC Genomics. 13:584. [DOI] [PMC free article] [PubMed] [Google Scholar]
- Okere CO, Kaba H. 2000. Heterogenous immunohistochemical expression of microglia-specific ionized calcium binding adaptor protein (Iba1) in the mouse olfactory bulb. Brain Res. 877(1):85–90. [DOI] [PubMed] [Google Scholar]
- Oostindjer M, Bolhuis JE, Simon K, van den Brand H, Kemp B. 2011. Perinatal flavour learning and adaptation to being weaned: all the pig needs is smell. PLoS One. 6(10):e25318. [DOI] [PMC free article] [PubMed] [Google Scholar]
- Parfet KA, Gonyou HW. 1991. Attraction of newborn piglets to auditory, visual, olfactory and tactile stimuli. J Anim Sci. 69(1):125–133. [DOI] [PubMed] [Google Scholar]
- Park C, Choi S, Joo HG, Ahn M, Taniguchi K, Shin T. 2012. Galectin-3 immunohistochemistry in the vomeronasal organ of the domestic pig, Sus scrofa . Acta Histochem. 114(7):713–718. [DOI] [PubMed] [Google Scholar]
- Paudel Y, Madsen O, Megens HJ, Frantz LA, Bosse M, Crooijmans RP, Groenen MA. 2015. Copy number variation in the speciation of pigs: a possible prominent role for olfactory receptors. BMC Genomics. 16:330. [DOI] [PMC free article] [PubMed] [Google Scholar]
- Payton CA, Wilson DA, Wesson DW. 2012. Parallel odor processing by two anatomically distinct olfactory bulb target structures. PLoS One. 7(4):e34926. [DOI] [PMC free article] [PubMed] [Google Scholar]
- Petilla Interneuron Nomenclature Group , Ascoli GA, Alonso-Nanclares L, Anderson SA, Barrionuevo G, Benavides-Piccione R, Burkhalter A, Buzsaki G, Cauli B, Defelipe J, et al. 2008. Petilla terminology: nomenclature of features of GABAergic interneurons of the cerebral cortex. Nat Rev Neurosci. 9(7):557–568. [DOI] [PMC free article] [PubMed] [Google Scholar]
- Petzold GC, Albeanu DF, Sato TF, Murthy VN. 2008. Coupling of neural activity to blood flow in olfactory glomeruli is mediated by astrocytic pathways. Neuron. 58(6):897–910. [DOI] [PMC free article] [PubMed] [Google Scholar]
- Pond W, Houpt K. 1978. The biology of the pig. Ithaca, NY: Comstock. [Google Scholar]
- Price SA, Bininda-Emonds OR, Gittleman JL. 2005. A complete phylogeny of the whales, dolphins and even-toed hoofed mammals (Cetartiodactyla). Biol Rev Camb Philos Soc. 80(3):445–473. [DOI] [PubMed] [Google Scholar]
- Purves D, Lichtman JW. 1985. Geometrical differences among homologous neurons in mammals. Science. 228(4697):298–302. [DOI] [PubMed] [Google Scholar]
- Reinhardt W, Konda N, MacLeod N, Ellendorff F. 1981. Electrophysiology of olfacto-limbic-hypothalamic connections in the pig. Exp Brain Res. 43(1):1–10. [DOI] [PubMed] [Google Scholar]
- Rekwot PI, Ogwu D, Oyedipe EO, Sekoni VO. 2001. The role of pheromones and biostimulation in animal reproduction. Anim Reprod Sci. 65(3–4):157–170. [DOI] [PubMed] [Google Scholar]
- Richard MB, Taylor SR, Greer CA. 2010. Age-induced disruption of selective olfactory bulb synaptic circuits. Proc Natl Acad Sci U S A. 107(35):15613–15618. [DOI] [PMC free article] [PubMed] [Google Scholar]
- Roux L, Madar A, Lacroix MM, Yi C, Benchenane K, Giaume C. 2015. Astroglial connexin 43 hemichannels modulate olfactory bulb slow oscillations. J Neurosci. 35(46):15339–15352. [DOI] [PMC free article] [PubMed] [Google Scholar]
- Salazar I, Lombardero M, Cifuentes JM, Sánchez Quinteiro P, Alemañ N. 2003. Morphogenesis and growth of the soft tissue and cartilage of the vomeronasal organ in pigs. J Anat. 202(6):503–514. [DOI] [PMC free article] [PubMed] [Google Scholar]
- Salazar I, Sánchez Quinteiro P, Lombardero M, Aleman N, Fernández de Trocóniz P. 2004. The prenatal maturity of the accessory olfactory bulb in pigs. Chem Senses. 29(1):3–11. [DOI] [PubMed] [Google Scholar]
- Salazar I, Sanchez-Quinteiro P, Lombardero M, Cifuentes JM. 2000. A descriptive and comparative lectin histochemical study of the vomeronasal system in pigs and sheep. J Anat. 196(Pt 1):15–22. [DOI] [PMC free article] [PubMed] [Google Scholar]
- Salcedo E, Tran T, Ly X, Lopez R, Barbica C, Restrepo D, Vijayaraghavan S. 2011. Activity-dependent changes in cholinergic innervation of the mouse olfactory bulb. PLoS One. 6(10):e25441. [DOI] [PMC free article] [PubMed] [Google Scholar]
- Shepherd G, Chen W, Greer C. 2004. Olfactory bulb. In: Shepherd G, editor. The synaptic organization of the brain. 5th ed New York: Oxford; p. 165–216. [Google Scholar]
- Signoret JP. 1970. Reproductive behaviour of pigs. J Reprod Fertil Suppl. 11(Suppl 11):105+. [PubMed] [Google Scholar]
- Søndergaard LV, Holm IE, Herskin MS, Dagnæs-Hansen F, Johansen MG, Jørgensen AL, Ladewig J. 2010. Determination of odor detection threshold in the Gottingen minipig. Chem Senses. 35(8):727–734. [DOI] [PMC free article] [PubMed] [Google Scholar]
- Sorensen PW. 1996. Biological responsiveness to pheromones provides fundamental and unique insight into olfactory function. Chem Senses. 21(2):245–256. [DOI] [PubMed] [Google Scholar]
- Steinfeld R, Herb JT, Sprengel R, Schaefer AT, Fukunaga I. 2015. Divergent innervation of the olfactory bulb by distinct raphe nuclei. J Comp Neurol. 523(5):805–813. [DOI] [PMC free article] [PubMed] [Google Scholar]
- Venneman W, Van Nie CJ, Tibboel D. 1982. Developmental abnormalities of the olfactory bulb: a comparative teratological and experimental study of the pig and chick embryo. Teratology. 26(1):65–70. [DOI] [PubMed] [Google Scholar]
- Vieuille-Thomas C, Signoret JP. 1992. Pheromonal transmission of an aversive experience in domestic pig. J Chem Ecol. 18(9):1551–1557. [DOI] [PubMed] [Google Scholar]
- Watson L. 2004. The whole hog. Washington: Smithsonian Books. [Google Scholar]
- Wilson DA, Sullivan RM. 2011. Cortical processing of odor objects. Neuron. 72(4):506–519. [DOI] [PMC free article] [PubMed] [Google Scholar]
- Yan Z, Tan J, Qin C, Lu Y, Ding C, Luo M. 2008. Precise circuitry links bilaterally symmetric olfactory maps. Neuron. 58(4):613–624. [DOI] [PubMed] [Google Scholar]
- Zhang X, Zhang X, Firestein S. 2007. Comparative genomics of odorant and pheromone receptor genes in rodents. Genomics. 89(4):441–450. [DOI] [PMC free article] [PubMed] [Google Scholar]


