ABSTRACT
Galectin-1 (Gal-1) has been described to promote tumor growth by inducing angiogenesis and to contribute to tumor immune escape by promoting apoptosis of activated T cells. We had previously identified upregulation of Gal-1 in preclinical models of aggressive neuroblastoma (NB), a solid tumor of childhood. However, the clinical and biological relevance of Gal-1 in this tumor entity is unclear. Here, the effect of Gal-1 on the immune system and tumorigenesis was assessed using modulation of Gal-1 expression in immune effector cells and in a transgenic NB model, designated TH-MYCN. The fraction of CD4+ T cells was decreased in tumor-bearing TH-MYCN mice compared to tumor-free littermates, while both CD4+ T cells as well as CD8+ T cells were less activated, compatible with a reduced immune response in tumor-bearing mice. Tumor incidence was not significantly altered by decreasing Gal-1/LGALS1 gene dosage in TH-MYCN mice, but TH-MYCN/Gal-1−/− double transgenic mice displayed impaired tumor angiogenesis, splenomegaly, and impaired T cell tumor-infiltration with no differences in T cell activation and apoptosis rate. Additionally, a lower migratory capacity of Gal-1 deficient CD4+ T cells toward tumor cells was observed in vitro. Transplantation of TH-MYCN-derived tumor cells into syngeneic mice resulted in significantly reduced tumor growth and elevated immune cell infiltration when Gal-1 was downregulated by shRNA. We therefore conclude that T cell-derived Gal-1 mediates T cell tumor-infiltration, whereas NB-derived Gal-1 promotes tumor growth. This opposing effect of Gal-1 in NB should be considered in therapeutic targeting strategies, as currently being developed for other tumor entities.
KEYWORDS: Galectin-1, neuroblastoma, tumor–host interaction
Introduction
NB is an embryonal tumor with a broad clinical spectrum ranging from spontaneous regression to rapid progression and infaust outcome. Most strikingly, no current regimen is established to treat NB relapse with curative intent, although recent reports indicate involvement of RAS in NB at recurrence.1,2 Therefore, the main current goal is to preserve the disease-free interval following first-line therapy. Several studies reported beneficial effects of consolidation therapy including treatment with an antibody directed against the NB-specific antigen, GD2,3 while recent evidence also suggests the usefulness of GD2 as an antigen for the production of clinically relevant chimeric antigen receptors (CARs).4 However, little is known about host factors modulating the immune response to NB cells.
MYCN amplification is the most powerful predictor determining poor prognosis of NB and is often accompanied by expression of the neurotrophin receptor NTRK2, while expression of the related neurotrophin receptor, NTRK1, is restricted to low-stage NBs, which are characterized by a good patient prognosis. NTRK1 expression was shown to correlate with an increased immunogenicity of NB cells in line with a less-malignant tumor phenotype.5 While the mechanisms by which oncogenic MYCN contributes to shaping and maintaining properties of the tumor cell itself are well characterized, much less is known about the role of MYCN in regulating the host immune response. In embryonal tumors as well as in other cancer types, a precise role for MYC proteins on regulating the tumor–immune interaction remains to be elucidated. For example, results obtained so far suggest a context-dependent pattern of MYC in regulating MHC class I expression: while in medulloblastoma tissue a strong correlation of c-MYC expression with MHC class I was observed,6 NB cells with high MYCN levels lack MHC class I expression.7 Thus, there is clearly a need to better understand the role of MYC proteins on host-immune factors.
Overexpression and untimely activation of MYCN is sufficient to cause oncogenic transformation in vitro8 and in transgenic animals.9,10 Moreover, ectopic expression of MYCN in pluripotent precursor cells of the neural crest resulted in a transformed phenotype.8 These findings have established a causal role for MYCN in tumor development as well as in maintenance of the malignant phenotype. We have recently shown that conditional MYCN overexpression (LSL-MYCN) in dopamine β-hydroxylase (DBH) expressing cells also gives rise to murine NB in DBH-iCre/LSL-MYCN transgenics.11 Both, tumors from TH-MYCN mice, in which MYCN is constitutively active in tyrosine hydroxylase (TH)-positive cells, as well as tumors arising from DBH-iCre/LSL-MYCN mice not only present with histological characteristics of NB but also show chromosomal aberrations typical of the human disease. Thus, both models are highly suited for the analyses of pathomechanisms of NB.
A proteomic screen to detect targets differentially regulated by NTRK2 and NTRK1 in NB cells led to the identification of Gal-1, which is encoded by the LGALS1 gene (both termed Gal-1 hereafter).12 In vitro, expression and activation of NTRK2 caused upregulation of Gal-1 protein expression.13 Gal-1 enhanced aggressive properties of NB cells and downregulation of Gal-1 inhibited the migratory and invasive capacity in vitro. In a broader context, Gal-1 has been described as an important modulator of the tumor–host interaction and of T cell responses to tumor cells. It has been suggested that targeting Gal-1 reduces cancer-associated immunosuppression as well as tumor angiogenesis.14,15 In physiological settings, Gal-1 is thought to play an important role in balancing T cell immune responses by acting as a mediator of immune suppression induced by regulatory T cells (Tregs).16 It is well established that Gal-1 may induce apoptosis of activated T cells17 and a shift toward a Th2 immune response. This corroborates analyses revealing a hyper-Th1 response upon antigenic stimulation in Gal-1 deficient mice.18 Enhanced T cell activation upon Gal-1 downregulation has also been described in syngenic grafts of NB cells,19 however, a role for Gal-1 in tumor development and modulation of the immune response in NB remains to be explored.
Although many studies have been undertaken to characterize the molecular features of TH-MYCN-driven tumors, the interaction of these tumors with the host immune response has been largely neglected. We here phenotypically characterized the immune response in tumor-bearing and tumor-free TH-MYCN mice and evaluated the impact of Gal-1 on tumor formation, angiogenesis and tumor–host interaction by cross-breeding Gal-1−/− mice to TH-MYCN mice. We identified specific alterations of the immune compartment in tumor-bearing TH-MYCN mice compared to controls, and here describe the impact of Gal-1 in modulating the immune response to tumor cells in vitro and in vivo.
Results
Tumor-bearing TH-MYCN mice present with a reduced cellular immune response
As little is known about the immune compartment of TH-MYCN mice and the adaptive host immune response to tumors in this model, we first characterized the T cell populations in the spleen of tumor-bearing TH-MYCN mice. The fraction of CD45+ cells in the spleen of tumor-bearing mice was reduced compared to tumor-free control mice (Fig. 1A). Specifically, CD4+ and CD8+ T cells were found at lower frequency in the spleen of tumor-bearing mice, while this effect was significant only for CD4+ T cells (p = 2 × 10⁻⁴, Fig. 1B). These CD4+ and CD8+ T cells presented with a significant higher CD62L expression (p = 5 × 10⁻⁴ and 1 × 10⁻⁴ for CD4+ and CD8+ cells, respectively, Fig. 1C, D), reduced expression of CD43 and IFNγ (Figs. S1A, B) and a lower proliferative activity as indicated by Ki67 staining, although this did not reach statistical significance. Thus, tumor-bearing animals seem to have suppressed T cell phenotype. However, the fraction of Treg cells as measured by FoxP3 expression on CD4+ T cells was unaltered between tumor-bearing mice and controls (Fig. S1C). No differences between tumor-bearing and tumor-free animals were found with respect to spleen-derived antigen-presenting CD11c+ dendritic cells or MHC class II and CD86 expression on CD11c+ dendritic cells (Fig. S2). These findings are in line with a reduced cellular immune response in tumor-bearing TH-MYCN mice.
Figure 1.
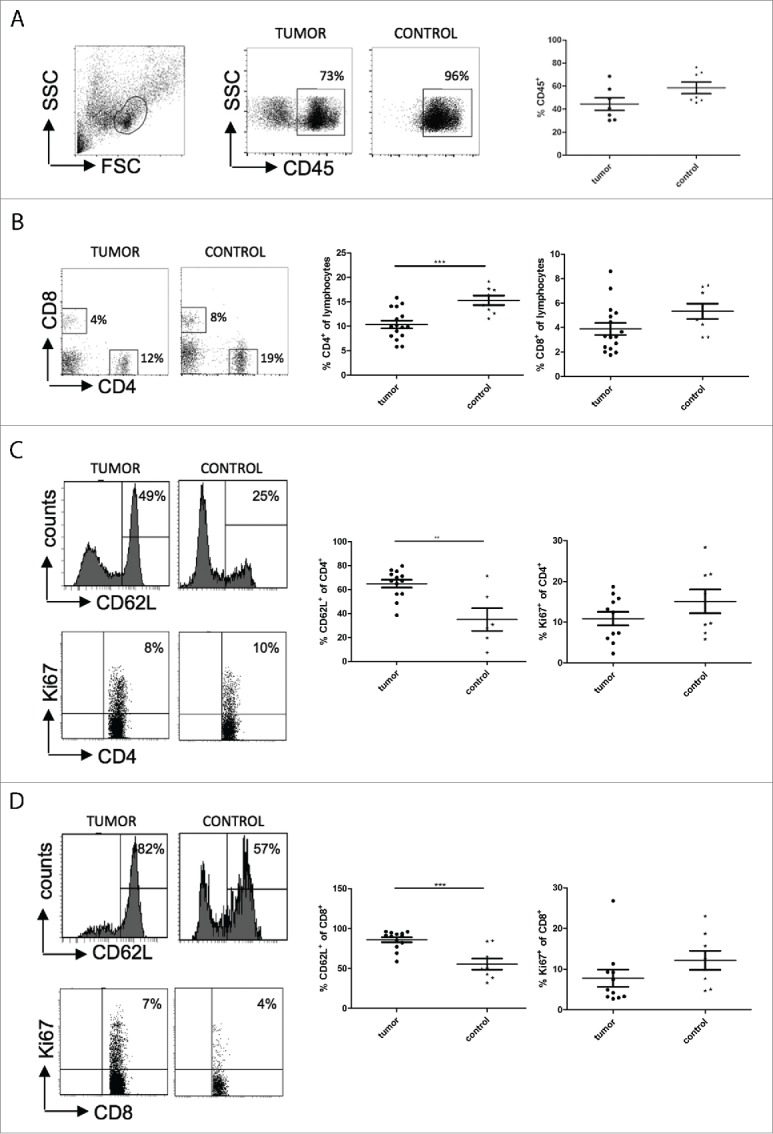
Tumor-bearing TH-MYCN mice have a reduced immune response when compared to tumor-free controls. The amount of immune cells was measured by staining the cells isolated from the spleen of tumor-bearing mice and tumor-free controls with anti-CD45 (A), anti-CD4+ and anti-CD8+ (B). Phenotypes of CD4+ T cells (C) and CD8+ T cells (D) were analyzed using CD62L as activation marker and Ki67 as proliferation marker. **, p < 0.01; ***, p < 0.001 (Student's t test).
Gal-1 gene dosage does not affect tumor incidence or gene expression profiles of tumors in TH-MYCN mice
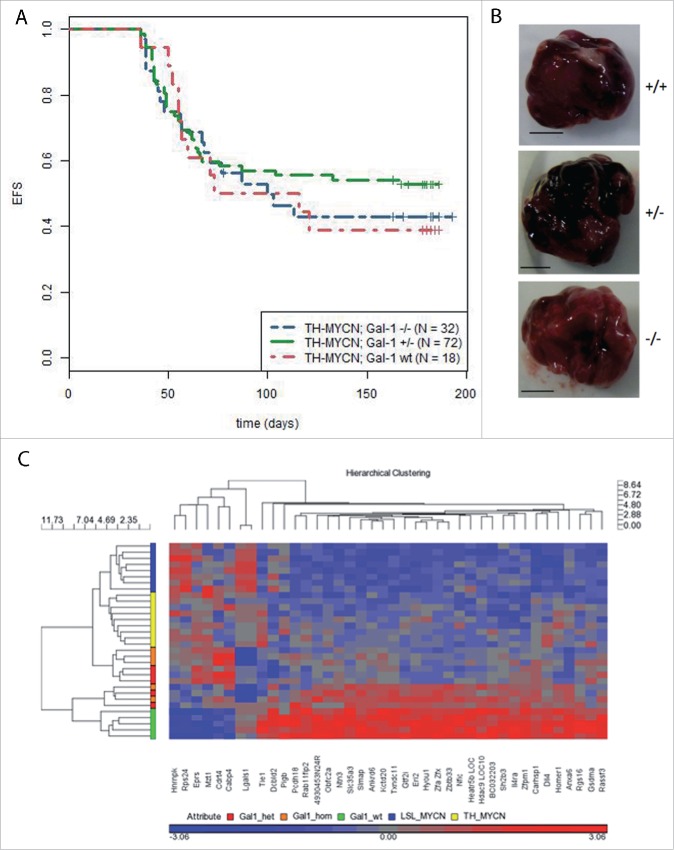
Next, we generated double transgenic mice (TH-MYCN/Gal-1−/−) to analyze the impact of Gal-1 on NB pathogenesis in the TH-MYCN model. Reduced Gal-1 gene dosage did not significantly alter tumor incidence (Fig. 2A) or macroscopic appearance (Fig. 2B). On mRNA level, array analyses were performed to identify potential targets depending on Gal-1 dosage. Comparison of our experimental cohort to publicly available data from TH-MYCN tumors20 and also to a second MYCN-driven model of NB, DBH-iCre/LSL-MYCN11 revealed that deletion of Gal-1 expression did not affect global tumor expression profiles. Hierarchical clustering recovered the experimental groups of the different cohorts, but only identified expression of the LGALS1 (coding for Gal-1) probe sets to be significantly different between tumors having normal or reduced Gal-1 gene dosage (Fig. 2C).
Figure 2.
(A) Kaplan–Meier survival analyses of TH-MYCN mice depending on Gal-1 gene dosage. Time to detection of a palpable tumor was defined as event-free survival (EFS) and is shown for TH-MYCN/Gal-1wt/wt (red curve), TH-MYCN/Gal-1wt/– (green curve) and TH-MYCN/Gal-1−/− mice (blue curve). (B) Macroscopically, no differences were detectable between tumors with different Gal-1 genotypes (+/+: TH-MYCN/Gal-1wt/wt, +/−: TH-MYCN/Gal-1wt/–, –/–: TH-MYCN/Gal-1−/−). (C) Expression profiling of tumors revealed no global differences in the transcriptomes of TH-MYCN tumors with different Gal-1 genotypes. Note that the most prominent change on mRNA levels affects the coding gene for Gal-1, LGALS1.
Reduced Gal-1 gene dosage correlates with reduced tumor angiogenesis and splenomegaly in tumor-bearing mice
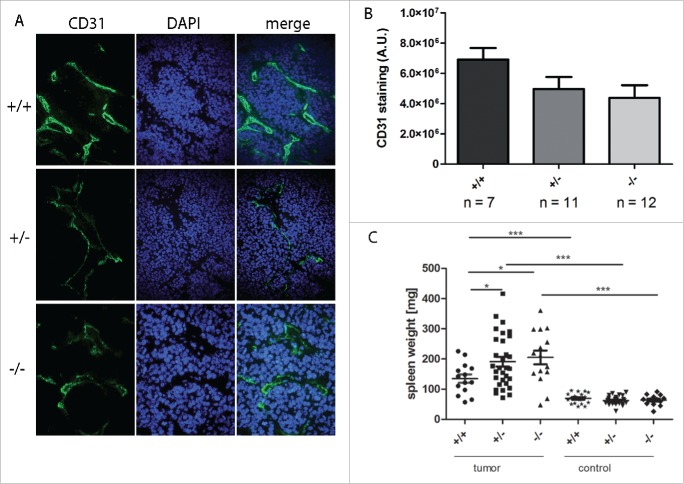
As Gal-1 is described to play a role in tumor angiogenesis, cryosections of tumor tissue were stained with CD31 as a surrogate marker for angiogenesis (Figs. 3A, B). In line with previous reports in other tumor models, reduced Gal-1 gene dosage correlated with reduced tumor angiogenesis. Furthermore, spleen weight was significantly higher in tumor-bearing mice compared to tumor-free control mice. Interestingly, spleen weight was even more elevated in tumor-bearing mice when both Gal-1 alleles were inactivated (p < 0.05, Fig. 3C). Thus, tumor-bearing TH-MYCN mice develop splenomegalies that are more pronounced in the absence of the gene coding for Gal-1.
Figure 3.
Reduced Gal-1 gene dose correlated with reduced tumor angiogenesis and splenomegaly. (A) Representative CD31-specific immunohistological staining (green) as a surrogate marker for angiogenesis using frozen tumor tissue of TH-MYCN mice depending on Gal-1 status (+/+: TH-MYCN/Gal-1wt/wt, +/−: TH-MYCN/Gal-1wt/–, –/–: TH-MYCN/Gal-1–/–). Nuclei were counterstained using DAPI. (B) Fluorescence intensity was quantified and background-corrected using ImageJ (A.U. = arbitrary units). (C) Weight of spleens isolated either from tumor-bearing mice or from tumor-free controls. Spleens of tumor-bearing mice were significantly enlarged compared to the spleens of tumor-free mice (Student's t test ***p < 0.001) and spleen weights were even higher in tumors of mice deficient for a functional Gal-1 gene (p < 0.05). Data are shown as mean ± SEM (standard error of the mean).
Tumor infiltration by T cells is impaired in TH-MYCN mice deficient for Gal-1
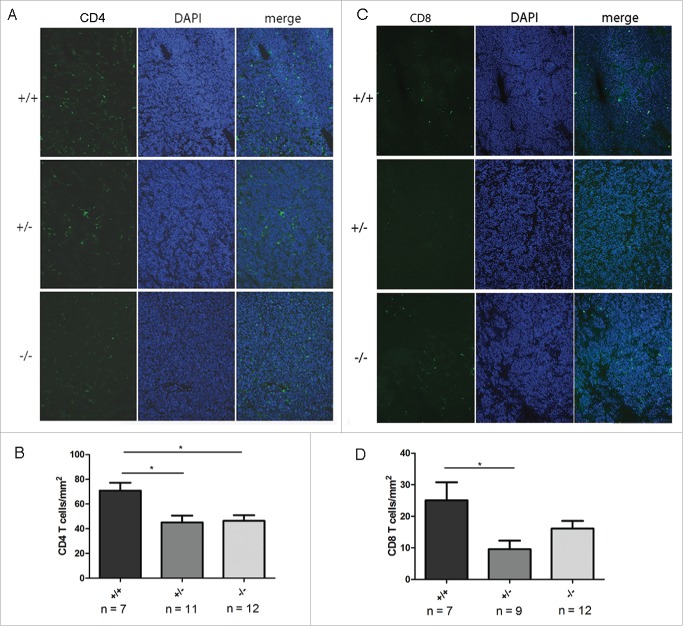
In order to analyze whether reduced tumor angiogenesis in tumor-bearing Gal-1 deficient mice affects immune cell infiltration, we next determined the immune cell content in tumors of TH-MYCN/Gal-1 mice as a function of the Gal-1 gene dosage. Interestingly, both T cell subsets, CD4+ and CD8+ T cells, were significantly reduced in tumors presenting with lower Gal-1 gene dosage, while in the absence of Gal-1 this was only significant for CD4+ cells (Fig. 4). No difference was found for expression of the activation marker CD62L, proliferation or apoptosis of both CD4+ and CD8+ T cells (Figs. 5 A–C). However, due to high variations in the apoptosis rate of intratumoral CD8+ T cells in wt animals, we could not exclude that CD8+ T cell death might be influenced by Gal-1 deficiency. Moreover, tumor infiltration by CD4+ FoxP3+ Treg cells (Fig. S3A), CD11b+ macrophages (Fig. S3B) or CD335+ NK cells (Fig. S3C) was not affected by Gal-1 gene dosage. In vitro, a transwell migration assay revealed reduced migratory activity of CD4+ T cells from Gal-1−/− mice toward TH-MYCN-derived NHO2A NB cells compared to CD4+ T cells (Fig. 5D), while both wt and Gal-1−/− CD4+ T cells were able to migrate toward the positive control (SDF-1β). Thus, impaired immune cell infiltration in tumors as a function of Gal-1 gene dosage specifically affects T cells, which might be caused by deficient migration rather than proliferative defects or enhanced apoptosis of these cells.
Figure 4.
Reduced Gal-1 gene dosage correlated with decreased infiltration of CD4+ and CD8+ T cells. (A) Representative CD4+-specific immunohistological staining (green) using frozen tumor tissue of TH-MYCN mice depending on Gal-1 status (+/+: TH-MYCN/Gal-1wt/wt, +/−: TH-MYCN/Gal-1wt/–, –/–: TH-MYCN/Gal-1−/− ). Nuclei were counterstained using DAPI. (B) CD4+ T cells were counted and quantified in representative tumor areas and plotted as a function of the Gal-1 genotype. Data are shown as mean ± SEM. (C) Representative CD8+-specific immunohistological staining (green) using frozen tumor tissue of TH-MYCN mice depending on Gal-1 status as shown in (A). (D) CD8+ T cells were counted and quantified in representative tumor areas and plotted as a function of the Gal-1 genotype. Data are shown as mean ± SEM.
Figure 5.
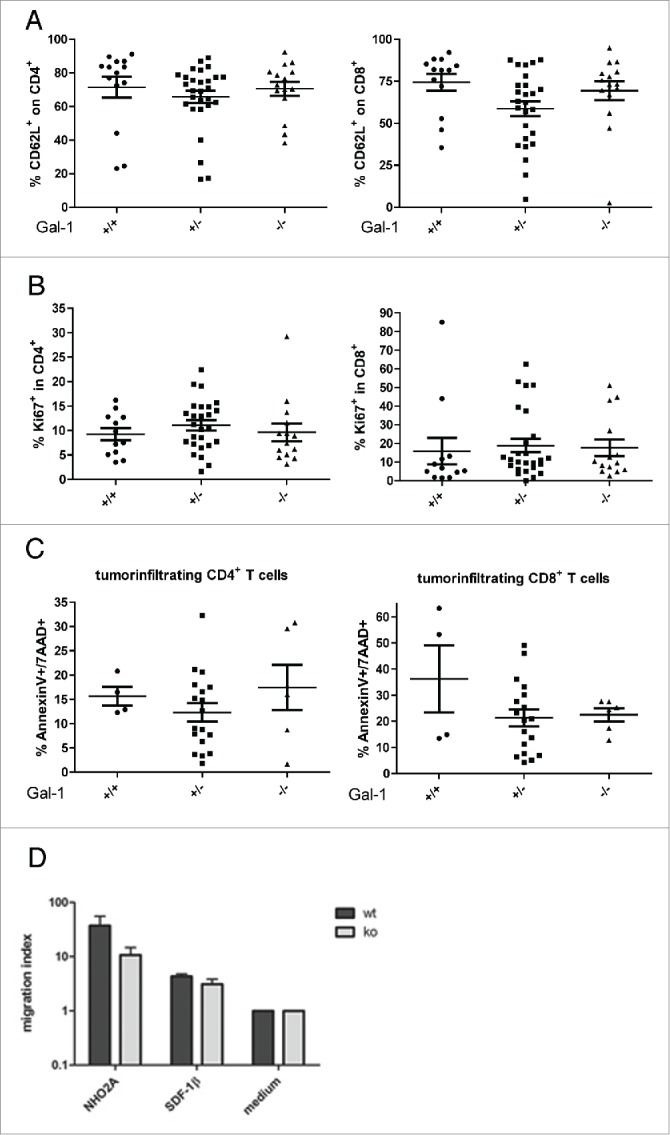
Characterization of tumor-infiltrating CD4+ and CD8+ T cells and migratory capacity of CD4+ T cells from wt or Gal-1 mice. (A) CD62L expression was analyzed as a surrogate marker for activation of tumor-infiltrating CD4+ and CD8+ T cells. Proliferation and apoptosis were evaluated by Ki-67 staining (B) or Annexin V/ 7-AAD staining, respectively (C), and data are presented for all Gal-1 genotypes (+/+: TH-MYCN/Gal-1wt/wt, +/−: TH-MYCN/Gal-1wt/–, –/–: TH-MYCN/Gal-1−/−; mean ± SEM). (D) Migration of freshly isolated CD4+ T cells from Gal-1−/− mice or wt mice toward NB tumor cells or recombinant SDF-1β as positive control. The migration index was calculated as a ratio to basal migratory capacity in the presence of medium only. Results from four independent experiments are depicted as mean ± SEM.
Downregulation of Gal-1 in mouse neuroblastoma cells results in significantly impaired tumor growth and correlates with enhanced immune cell infiltration
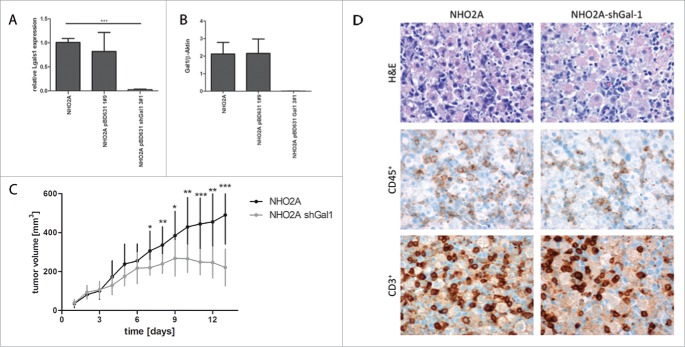
As Gal-1 is described to enhance aggressive properties of NB cells, the effects of downregulating Gal-1 in mouse NB cells NHO2A were evaluated in vivo. For this purpose, stable expression of a Gal-1 directed shRNA was established in NHO2A cells (NHO2A-shGal-1) and resulted in significantly reduced Gal-1 mRNA (Fig. 6A, p < 1 × 10⁻⁴) and protein levels (Fig. 6B). Subcutaneous grafts of NHO2A tumor cells transfected with shGal-1 or control transfected cells in 129/Sv mice resulted in significantly impaired tumor growth and eventually tumor shrinkage in the mice receiving NHO2A-shGal-1 cells (Fig. 6C). In these tumors, reduced Gal-1 expression in shGal-1 transfected cells was maintained on mRNA (Figs. S4A, D) and protein level (Fig. S4B–C). Immunohistochemical analyses revealed enhanced immune cell infiltration and necrosis in NHO2A-shGal-1 induced tumors compared to controls (Fig. 6D), which phenotypically resulted in reduced tumor growth. The number of CD45+ immune cells and CD3+ T cells was higher in tumors with low Gal-1 expression, although this did not reach statistical significance (Fig. 6D). FACS analyses revealed no significant changes in CD4+, CD4+CD25+ or CD4+Foxp3+ T cells depending on Gal-1 status, while NHO2A-induced tumors with low Gal-1 expression had an increased infiltration with CD11c+ cells indicating higher relative numbers of dendritic cells (Fig. S5).
Figure 6.
Downregulation of Gal-1 in mouse neuroblastoma cells derived from a TH-MYCN tumor. Stable expression of a Gal-1 directed shRNA results in significantly reduced Gal-1 mRNA (A) and protein levels (B). Subcutaneous grafting of NHO2A tumor cells transfected either with empty vector or with shGal-1 results in significantly slower tumor growth in mice receiving NHO2A-shGal-1 cells (C). Immunohistochemistry revealed higher contents of tumor cells and low immune cell infiltration in parental NHO2A cells, while tumors with downregulation of Gal-1 (NHO2A shGal1) presented with higher infiltration of immune cells (D, upper panel, hematoxylin-eosin [H&E] staining, middle panel, CD45 staining, lower panel CD3 staining).
Discussion
A better understanding of tumor–immune interactions is presently regarded as a prerequisite for targeted therapies of solid tumors. Activation of the host immune compartment toward a tumor can be achieved by different strategies including activation of antibody-dependent cell-mediated cytotoxicity (ADCC) or neutralization of immune checkpoints such as PD-1. In NB, engagement of the immune system is currently explored by using anti-GD2 antibody during consolidation therapy, but little is known about the modulation of the immune response by NB master regulators, MYCN and the NTRK-receptors. Here, we set out to phenotypically characterize the adaptive immune response toward NB in transgenic TH-MYCN mice and to explore the role of the NTRK2-target, Gal-1, in the same model. TH-MYCN mice resemble human NB in many features including acquisition of genetic aberrations in regions that are syntenic to the human genome.21 By contrast, little is known about immunological processes during tumor development in TH-MYCN mice. Therefore, we first investigated changes in the immune cell population in the spleen of tumor-bearing mice compared to tumor-free control mice. Our results not only suggested that the fraction of CD4+ T cells was decreased in spleens of tumor mice, but that this was accompanied by a reduced immune response in tumor-bearing mice, as the activity of CD4+ T cells and CD8+ T cells—at least with regard to CD62L expression—was suppressed compared to control mice. This is in line with a previous report on a decreased proportion of intratumoral T cells during tumor development in the same model.22
As we had previously identified Gal-1 in vitro as an down-stream effector of NTRK2, a marker for unfavorable disease course,12 we here set out to investigate the role of Gal-1 in modulating tumor-host interaction and T cell responses in TH-MYCN mice. We therefore crossbred TH-MYCN mice prone to develop NB with Gal-1 deficient mice (Gal-1−/−). Our results imply that Gal-1 expression is not essential for the onset of tumor formation as we did not observe changes in tumor incidence or the gene expression profile when Gal-1 gene dosage was decreased. However, we found that reduced tumor angiogenesis is correlated to Gal-1 deficiency as has also been reported in other model systems.23 This corroborates findings that blocking Gal-1 function by a neutralizing peptide was sufficient to block tumor angiogenesis in experimental cancer models,24 also demonstrating that absence of functional Gal-1 does not necessarily involve transcriptional reprogramming of tumor cells toward an anti-angiogenic phenotype. In our model, reduced vessel density was accompanied by a reduction in the fraction of CD4+ and CD8+ T cells within the tumor, while infiltration by macrophages and NK cells remained unaltered. These results imply that reduced tumor angiogenesis in Gal-1 deficient TH-MYCN mice does not affect immune cell infiltration in general. Thus, we here confirm a role for Gal-1 in modulating the immune phenotype and angiogenesis in TH-MYCN mice.
We anticipate that fine mapping of the function of tumor-derived and host-derived Gal-1 in this model could be achieved by conditional and tissue-specific deletion of Gal-1, which is currently not available. In the absence of these model systems, we analyzed the impact of Gal-1 produced by either immune cell or tumor cells to carve out possible different Gal-1-functions depending on the producing cells. For this purpose, we investigated the activity, proliferation, apoptosis rates and the migratory capability of Gal-1 deficient CD4+ T cells. While we did not detect a difference in phenotype, proliferation or apoptosis rates, we observed impaired migration of Gal-1 deficient CD4+ T cells toward NB tumor cells. Gal-1 dependent migration has also been described for other non-transformed cells such as myofibroblasts during wound healing, suggesting a widespread function of Gal-1 in migratory processes.25 Altered migratory capacity is in line with the finding that tumor-bearing TH-MYCN/Gal1−/− mice present with significantly enlarged spleens. However, no relative changes are observed in splenic T cell fractions implying additional mechanisms other than migration that contribute to the observed phenotype. Taken this into account, strategies blocking Gal-1 functions should be carefully evaluated for impairment of host-derived T cell migration and function.
Analysis of the role of tumor-derived Gal-1 was accomplished by establishing TH-MYCN-derived tumor cell lines with a reduced Gal-1 expression (NHO2A-shGal1). In allograft transplantation experiments, Gal-1 knockdown in NHO2A-shGal1 cells interfered with tumor growth and was accompanied by increased infiltration of tumors by immune cells. Similar findings were obtained in a different mouse NB model, NXS2 cells, when downregulation of Gal-1 by shRNA resulted in reduction of primary tumor growth and prevention of metastases.19 Additionally, Dalotto-Moreno et al. reported that inhibition of Gal-1 in preclinical models of breast cancer was accompanied by reversion of immunosuppression and thus less metastasis.26
In summary, our findings imply different effects of tumor-produced and immune cell-produced Gal-1 during tumor growth, unraveling a new aspect of the role of Gal-1 in tumor progression and the tumor immune escape.
Materials and methods
Breeding of TH-MYCN, LGALS1 double transgenic animals
TH-MYCN mice10 were obtained from Per Kogner (Karolinska Institutet, Stockholm, Sweden). These mice express the human oncogene MYCN under the control of the TH promotor and spontaneously develop neuroblastic tumors, closely resembling human NB. Gal-1−/− mice27 were provided by Scripps Research Institute, La Jolla, USA and backcrossed for at least six generations to obtain a 129x1/Sv background, as TH-MYCN tumor frequency is highest in this strain. TH-MYCN mice and Gal-1−/− mice were crossed to receive double transgenics representing all possible Gal-1 genotypes and mice heterozygous for the TH-MYCN oncogenic driver allele. Mice were maintained under specific pathogen-free conditions at the Animal Facility of the University Hospital Essen.
Tumor monitoring and harvesting
Genotyping of TH-MYCN transgenic mice was performed as previously described.28 Tumor formation was checked for palpation of the abdomen from d21 3 or 4 times a week on until mice were at 6 mo of age. Once tumors were palpated, tumor growth was closely monitored until a tumor volume of 2 cm3 had been reached. Tumor-bearing mice were sacrificed by cervical dislocation when tumor volume exceeded 2 cm3 or mice showed signs of discomfort. Aliquots of tumors were used either directly for flow cytometry analyses, stored at −80 °C or fixed in 4% paraformaldehyde for subsequent immunohistochemistry. All animal experiments were performed in accordance with government and institute guidelines and regulations. Animal procedures were approved by the state authorities for Ethics in Animal Experiments of NorthRhine Westphalia, Germany.
Cells and transfection
The murine NB cell line NHO2A was cultivated in RPMI1640 medium supplemented with 10 % FCS, penicillin (100 U/mL) and streptomycin (100 µg/mL) and maintained at 37 °C in a humidified 5% CO2 incubator. To generate NHO2A Gal-1 knock-down cells, shRNA against Gal-1 (forward: 5′-GATCCCACCTGTGCCTACACTTCAATTCAAGAGATTGAAGTGTAGGCACAGGTTTTTTTGGAAA-3′, reverse: 5′- GGTGGACACGGATGTGAAGTTAAGTTCTCT AACTTCACATCCGTGTCCAAAAAAACCTTTTCGA-3′) was cloned into the pBD631 vector (kindly provided by D. Biard, CEA, France), which was subsequently introduced into NHO2A cells by electroporation. As a negative control, NHO2A cells were transfected with the empty vector pBD631. Transfected cells were selected with 300 mg/mL Hygromycin B (Invitrogen, #10687-010) and single cell clones were obtained by ring cloning.
RNA isolation and quantitative real-time PCR
Total mRNA was isolated from cells or small tumor tissue slices using High Pure RNA Isolation Kit (Roche, #11828665001) according to the manufacturer's protocol. Of each preparation, 1 µg RNA was reverse transcribed using Transcriptor First Strand cDNA Synthesis Kit (Roche, #04896866001). Real-time PCR was performed in a StepOnePlusTM Real-Time PCR System (Applied Biosystems) using Fast SYBR® Green Master Mix (Roche, #04913914001). LGALS1 mRNA expression was normalized to murine GAPDH or β-actin expression and the fold change was calculated using the ΔΔ-Ct method.
mRNA expression profiling
Total RNA was isolated from abdominal tumors arising in TH-MYCN mice with different Gal-1 gene dosage, processed and hybridized to Affymetrix MG-430_2.0 oligonucleotide microarrays according to the manufacturer's protocol. Array results were compared to published data sets of MYCN-induced NB.11,20 Normalization of array data, detection of differentially expressed genes and hierarchical clustering analyses was achieved using Partek Genomics Suite (Partek, Michigan, MI).
Protein blotting
Cells or up to 30 mg of tissue slices were lysed on ice in RIPA buffer (50 mM HEPES, 10 mM NaCl2, 1% NP-40, 0.1% SDS and 1 % Triton X-100) supplemented with complete Protease Inhibitor Cocktail Tablets (Roche, #11697498001) and PhosSTOP Phosphatase Inhibitor Cocktail Tablets (Roche, #04906837001). Protein separation by SDS-PAGE, transfer to nitrocellulose membranes and incubation with antibodies against Gal-1 (1:200, R&D Systems, #AF1152) or β-actin (1:2,000, Sigma-Aldrich, #A5441) as loading control were performed as described.13
Flow cytometry
Lymphocytes from spleen or tumor tissue were isolated and stained using anti-mouse CD45 (30-F11, BioLegend, #103132), CD4 (RM4-5, BD, #558107), CD8 (53-6.7, BD, #553035), CD62L (MEL-14, BD, #553149), CD11c (HL3, BD, #550261), I-A/I-E (2G9, BD, #558623), CD86 (GL1, BD, #553690) as PB, FITC, APC or PE conjugates. Detection of intracellular Ki67 (SolA15, eBioscience, #25-5698-80) was performed using Foxp3 staining kit (eBioscience, #00-5523-00) according to manufacturer's recommendations. Flow cytometry analyses were performed using a LSRII and DIVA software (BD Bioscience).
Immunohistochemistry
Cryosections (7 µm) were stained using rat anti-CD31 (MEC13.3, 1:1,500, BD, #550274), rat anti-CD4 (H129.19, 1:10, BD, #550278), rat anti-CD8 (53-6.7, 1:10, BD, #550281), rat anti-CD335 (29A1.4, 1:25, BioLegend, #137602), rat anti-Gr1 (RB6-8C5, 1:10, BD, #550291) or AF594 anti-CD11b (M1/70, 1:100, BioLegend, #101254). As secondary antibody, goat-anti-rat AF488 (1:500, Life Technologies, #A11006) was used. Nuclei were stained using DAPI (Carl Roth, #6335.2). Quantification of CD31-staining was measured on three sections per tumor using ImageJ. Quantification of individual cell populations (CD4+, CD8+, CD335+, CD11b+, Gr1+) per mm2 was calculated using three sections per tumor as described.
Immunohistochemistry of fixed paraffin-embedded sections was performed as previously described. In brief, tumors were fixed in 4% paraformaldehyde for at least 24 h and 4 µm sections were cut from paraffin blocks and stained with haematoxylin and eosin (H&E), anti-CD45 (5C16, 1:500, Novus Biologicals, NB110-93609) or anti-CD3 (A0452, 1:50, DAKO).29 Pictures were recorded using NanoZoomer 2.0HT (Hamamatsu Photonics Deutschland GmbH).
Assessment of migration of CD4+ T cells
Splenocytes were isolated from Gal-1−/− mice or wt mice and CD4+ T cells were isolated using the CD4+ T cell isolation kit (Miltenyi Biotec, #130-095-248) according to manufacturer's recommendations. Migration assays were performed using transwell chambers with 5 µm polycarbonate filters (Corning). Tumor cells (2 × 10⁵ cells per well) were seeded into the lower chamber and 12 h later, transwell inserts containing 1 × 10⁶ CD4+ T cells from either Gal-1−/− or wt mice were added to the upper chamber. Migration of these cells was allowed for 4 h at 37°C and then stopped by adding 10 µL 0.5 M EDTA. Cells that migrated to the lower chamber were collected and counted as described.30 As a positive control, 50 ng/mL SDF-1β (PeproTech, #300-28A) in culture medium was added to the lower chamber.
Tumor cell transplantation
For syngeneic transplantation of tumor cells, 6–8-week old 129/Sv mice were inoculated s.c. with 4 × 10⁷ NHO2A cells in 200 µL Matrigel (Corning, #356231). NHO2A cells were transfected with either a vector control or a vector stably expressing a shRNA directed against Gal-1 as described above. Tumor volume (length × width × height × 1/2) was measured daily.
Statistical analyses
Results are expressed as mean ± SEM. Statistical significance between experimental groups were determined by Student's t test or, when means of three or more groups were compared, by one-way ANOVA followed by Bonferroni's correction for multiple testing. Data analysis was performed with Prism 5.0 software (GraphPad). Different survival between experimental groups was calculated using the log-rank test. Time-dependent survival was visualized using Kaplan–Meier plots. Data analysis was performed with R (www.r-project.org). p values < 0.05 were considered statistically significant.
Supplementary Material
Disclosure of potential conflicts of interest
No potential conflicts of interest were disclosed.
Funding
AS and WH acknowledge the funding of the German Cancer Aid, grant no. 109983, KB and AS are supported by the Deutsche Forschungsgemeinschaft in the context of the graduate school GRK1739, TP9.
References
- 1.Eleveld TF, Oldridge DA, Bernard V, Koster J, Daage LC, Diskin SJ, Schild L, Bentahar NB, Bellini A, Chicard M et al.. Relapsed neuroblastomas show frequent RAS-MAPK pathway mutations. Nat Genet 2015; 47(8):864-71; PMID:26121087; http://dx.doi.org/10.1038/ng.3333. [DOI] [PMC free article] [PubMed] [Google Scholar]
- 2.Schramm A, Köster J, Assenov Y, Althoff K, Peifer M, Mahlow E, Odersky A, Beisser D, Ernst C, Henssen AG et al.. Mutational dynamics between primary and relapse neuroblastomas. Nat Genet 2015; 47(8):872-7.; PMID:26121086; http://dx.doi.org/10.1038/ng.3349.20879881 [DOI] [PubMed] [Google Scholar]
- 3.Yu AL, Gilman AL, Ozkaynak MF, London WB, Kreissman SG, Chen HX, Smith M, Anderson B, Villablanca JG, Matthay KK et al.. Anti-GD2 antibody with GM-CSF, interleukin-2, and isotretinoin for neuroblastoma. N Engl J Med 2010; 363(14):1324-34; PMID:20879881; http://dx.doi.org/ 10.1056/NEJMoa0911123 [DOI] [PMC free article] [PubMed] [Google Scholar]
- 4.Sun J, Huye LE, Lapteva N, Mamonkin M, Hiregange M, Ballard B, Dakhova O, Raghavan D, Durett AG, Perna SK et al.. Early transduction produces highly functional chimeric antigen receptor-modified virus-specific T-cells with central memory markers: a Production Assistant for Cell Therapy (PACT) translational application. J Immunotherapy Cancer 2015; 3:5; PMID:25734008; http://dx.doi.org/ 10.1186/s40425-015-0049-1 [DOI] [PMC free article] [PubMed] [Google Scholar]
- 5.Pajtler KW, Rebmann V, Lindemann M, Schulte JH, Schulte S, Stauder M, Leuschner I, Schmid KW, Köhl U, Schramm A et al.. Expression of NTRK1/TrkA affects immunogenicity of neuroblastoma cells. International journal of cancer. J Int du Cancer 2013; 133(4):908-19; PMID:23400852; http://dx.doi.org/ 10.1002/ijc.28096 [DOI] [PubMed] [Google Scholar]
- 6.Smith C, Santi M, Rushing EJ, Cornelison R, MacDonald TJ, Vukmanovic S. Characterization of signaling function and expression of HLA class I molecules in medulloblastoma. J Neuro-oncol 2011; 103(2):197-206; PMID:20811766; http://dx.doi.org/ 10.1007/s11060-010-0378-3 [DOI] [PMC free article] [PubMed] [Google Scholar]
- 7.Versteeg R, van der Minne C, Plomp A, Sijts A, van Leeuwen A, Schrier P. N-myc expression switched off and class I human leukocyte antigen expression switched on after somatic cell fusion of neuroblastoma cells. Mol Cell Biol 1990; 10(10):5416-23; PMID:2204814; http://dx.doi.org/ 10.1128/MCB.10.10.5416 [DOI] [PMC free article] [PubMed] [Google Scholar]
- 8.Schulte JH, Lindner S, Bohrer A, Maurer J, De Preter K, Lefever S, Heukamp L, Schulte S, Molenaar J, Versteeg R.et al. MYCN and ALKF1174L are sufficient to drive neuroblastoma development from neural crest progenitor cells. Oncogene 2013; 32(8):1059-65; PMID:22484425; http://dx.doi.org/ 10.1038/onc.2012.106 [DOI] [PubMed] [Google Scholar]
- 9.Swartling FJ, Savov V, Persson AI, Chen J, Hackett CS, Northcott PA, Grimmer MR, Lau J, Chesler L, Perry A et al.. Distinct neural stem cell populations give rise to disparate brain tumors in response to N-MYC. Cancer Cell 2012; 21(5):601-13; PMID:22624711; http://dx.doi.org/ 10.1016/j.ccr.2012.04.012 [DOI] [PMC free article] [PubMed] [Google Scholar]
- 10.Weiss WA, Aldape K, Mohapatra G, Feuerstein BG, Bishop JM. Targeted expression of MYCN causes neuroblastoma in transgenic mice. EMBO J 1997; 16(11):2985-95; PMID:9214616; http://dx.doi.org/ 10.1093/emboj/16.11.2985 [DOI] [PMC free article] [PubMed] [Google Scholar]
- 11.Althoff K, Beckers A, Bell E, Nortmeyer M, Thor T, Sprüssel A, Lindner S, De Preter K, Florin A, Heukamp LC et al.. A Cre-conditional MYCN-driven neuroblastoma mouse model as an improved tool for preclinical studies. Oncogene. 2015 Jun; 34(26):3357-68; PMID:25174395; http://dx.doi.org/10.1038/onc.2014.269. [DOI] [PMC free article] [PubMed] [Google Scholar]
- 12.Sitek B, Apostolov O, Stühler K, Pfeiffer K, Meyer HE, Eggert A, Schramm A. Identification of dynamic proteome changes upon ligand activation of Trk-receptors using two-dimensional fluorescence difference gel electrophoresis and mass spectrometry. Mol Cell Proteomics 2005; 4(3):291-9; PMID:15654083; http://dx.doi.org/19363525 10.1074/mcp.M400188-MCP200 [DOI] [PubMed] [Google Scholar]
- 13.Cimmino F, Schulte JH, Zollo M, Koster J, Versteeg R, Iolascon A, Eggert A, Schramm A. Galectin-1 is a major effector of TrkB-mediated neuroblastoma aggressiveness. Oncogene 2009; 28(19):2015-23; PMID:19363525; http://dx.doi.org/ 10.1038/onc.2009.70 [DOI] [PubMed] [Google Scholar]
- 14.Liu F, Rabinovich GA. Galectins as modulators of tumour progression. Nature reviews. Cancer 2005; 5(1):29-41; PMID:15630413; http://dx.doi.org/10.1038/nrc1527 [DOI] [PubMed] [Google Scholar]
- 15.Rubinstein N, Alvarez M, Zwirner NW, Toscano MA, Ilarregui JM, Bravo A, Mordoh J, Fainboim L, Podhajcer OL, Rabinovich GA. Targeted inhibition of galectin-1 gene expression in tumor cells results in heightened T cell-mediated rejection; A potential mechanism of tumor-immune privilege. Cancer Cell 2004; 5(3):241-51; PMID:15050916; http://dx.doi.org/ 10.1016/S1535-610-8(04)00024-8 [DOI] [PubMed] [Google Scholar]
- 16.Garín MI, Chu C, Golshayan D, Cernuda-Morollón E, Wait R, Lechler RI. Galectin-1: a key effector of regulation mediated by CD4+CD25+ T cells. Blood 2007; 109(5):2058-65; PMID:17110462; http://dx.doi.org/7501023 10.1182/blood-2006-04-016451 [DOI] [PubMed] [Google Scholar]
- 17.Perillo NL, Pace KE, Seilhamer JJ, Baum LG. Apoptosis of T cells mediated by galectin-1. Nature 1995; 378(6558):736-9; PMID:7501023; http://dx.doi.org/ 10.1038/378736a0 [DOI] [PubMed] [Google Scholar]
- 18.Toscano MA, Bianco GA, Ilarregui JM, Croci DO, Correale J, Hernandez JD, Zwirner NW, Poirier F, Riley EM, Baum LG et al.. Differential glycosylation of TH1, TH2 and TH-17 effector cells selectively regulates susceptibility to cell death. Nat Immunol 2007; 8(8):825-34; PMID:17589510; http://dx.doi.org/ 10.1038/ni1482 [DOI] [PubMed] [Google Scholar]
- 19.Soldati R, Berger E, Zenclussen AC, Jorch G, Lode HN, Salatino M, Rabinovich GA, Fest S. Neuroblastoma triggers an immunoevasive program involving galectin-1-dependent modulation of T cell and dendritic cell compartments. International journal of cancer. J Int du Cancer 2012; 131(5):1131-41; PMID:22020795; http://dx.doi.org/ 10.1002/ijc.26498 [DOI] [PubMed] [Google Scholar]
- 20.Cazes A, Lopez-Delisle L, Tsarovina K, Pierre-Eugène C, De Preter K, Peuchmaur M, Nicolas A, Provost C, Louis-Brennetot C, Daveau R et al.. Activated Alk triggers prolonged neurogenesis and Ret upregulation providing a therapeutic target in ALK-mutated neuroblastoma. Oncotarget 2014; 5(9):2688-702; PMID:24811913; http://dx.doi.org/ 10.18632/oncotarget.1883 [DOI] [PMC free article] [PubMed] [Google Scholar]
- 21.Weiss WA, Godfrey T, Francisco C, Bishop JM. Genome-wide screen for allelic imbalance in a mouse model for neuroblastoma. Cancer Res 2000; 60(9):2483-7; PMID:10811128 [PubMed] [Google Scholar]
- 22.Carlson L, Rasmuson A, Idborg H, Segerström L, Jakobsson PJ, Sveinbjörnsson B, Kogner P. Low-dose aspirin delays an inflammatory tumor progression in vivo in a transgenic mouse model of neuroblastoma. Carcinogenesis 2013; 34(5):1081-8; PMID:23349014; http://dx.doi.org/ 10.1093/carcin/bgt009 [DOI] [PubMed] [Google Scholar]
- 23.Verschuere T, Toelen J, Maes W, Poirier F, Boon L, Tousseyn T, Mathivet T, Gerhardt H, Mathieu V, Kiss R et al.. Glioma-derived galectin-1 regulates innate and adaptive antitumor immunity. International journal of cancer. J Int du Cancer 2014; 134(4):873-84; PMID:23929302; http://dx.doi.org/ 10.1002/ijc.28426 [DOI] [PubMed] [Google Scholar]
- 24.Thijssen VL, Barkan B, Shoji H, Aries IM, Mathieu V, Deltour L, Hackeng TM, Kiss R, Kloog Y, Poirier F et al.. Tumor cells secrete galectin-1 to enhance endothelial cell activity. Cancer Res 2010; 70(15):6216-24; PMID:20647324; http://dx.doi.org/ 10.1158/0008-5472.CAN-09-4150 [DOI] [PubMed] [Google Scholar]
- 25.Lin Y, Chen J, Wu M, Hsieh IS, Liang CH, Hsu CL, Hong TM, Chen YL. Galectin-1 accelerates wound healing by regulating the neuropilin-1/Smad3/NOX4 pathway and ROS production in myofibroblasts. J Investig Dermatol 2015; 135(1):258-68; PMID:25007042; http://dx.doi.org/ 10.1038/jid.2014.288 [DOI] [PubMed] [Google Scholar]
- 26.Dalotto-Moreno T, Croci DO, Cerliani JP, Martinez-Allo VC, Dergan-Dylon S, Méndez-Huergo SP, Stupirski JC, Mazal D, Osinaga E, Toscano MA et al.. Targeting galectin-1 overcomes breast cancer-associated immunosuppression and prevents metastatic disease. Cancer Res 2013; 73(3):1107-17; PMID:23204230; http://dx.doi.org/ 10.1158/0008-5472.CAN-12-2418 [DOI] [PubMed] [Google Scholar]
- 27.Poirier F, Robertson EJ. Normal development of mice carrying a null mutation in the gene encoding the L14 S-type lectin. Development (Cambridge, England) 1993; 119(4):1229-36; PMID:8306885 [DOI] [PubMed] [Google Scholar]
- 28.Haraguchi S, Nakagawara A. A simple PCR method for rapid genotype analysis of the TH-MYCN transgenic mouse. PloS one 2009; 4(9):e6902; PMID:19730731; http://dx.doi.org/ 10.1371/journal.pone.0006902 [DOI] [PMC free article] [PubMed] [Google Scholar]
- 29.Ahlfeld J, Favaro R, Pagella P, Kretzschmar HA, Nicolis S, Schuller U. Sox2 requirement in sonic hedgehog-associated medulloblastoma. Cancer Res 2013; 73(12):3796-807; PMID:23596255; http://dx.doi.org/ 10.1158/0008-5472.CAN-13-0238 [DOI] [PubMed] [Google Scholar]
- 30.Hansen W, Hutzler M, Abel S, Alter C, Stockmann C, Kliche S, Albert J, Sparwasser T, Sakaguchi S, Westendorf AM et al.. Neuropilin 1 deficiency on CD4+Foxp3+ regulatory T cells impairs mouse melanoma growth. J Exp Med 2012; 209(11):2001-16; PMID:23045606; http://dx.doi.org/ 10.1084/jem.20111497 [DOI] [PMC free article] [PubMed] [Google Scholar]
Associated Data
This section collects any data citations, data availability statements, or supplementary materials included in this article.


