Abstract
Background
Post-traumatic osteoarthritis (PTOA) is common after intra-articular fractures of the tibial plafond. An objective CT-based measure of fracture severity was previously found to reliably predict whether PTOA developed following surgical treatment of such fractures. However, the extended time required obtaining the fracture energy metric and its reliance upon an intact contralateral limb CT limited its clinical applicability. The objective of this study was to establish an expedited fracture severity metric that provided comparable PTOA predictive ability without the prior limitations
Methods
An expedited fracture severity metric was computed from the CT scans of 30 tibial plafond fractures using textural analysis to quantify disorder in CT images. The expedited method utilized an intact surrogate model to enable severity assessment without requiring a contralateral limb CT. Agreement between the expedited fracture severity metric and the Kellgren-Lawrence (KL) radiographic OA score at two-year follow-up was assessed using concordance. The ability of the metric to differentiate between patients that did or did not develop PTOA was assessed using the Wilcoxon Ranked Sum test.
Results
The expedited severity metric agreed well (75.2% concordance) with the KL scores. The initial fracture severity of cases that developed PTOA differed significantly (p = 0.004) from those that did not. Receiver operating characteristic analysis showed that the expedited severity metric could accurately predict PTOA outcome in 80% of the cases. The time required to obtain the expedited severity metric averaged 14.9 minutes/ case, and the metric was obtained without using an intact contralateral CT
Conclusion
The expedited CT-based methods for fracture severity assessment present a solution to issues limiting the utility of prior methods. In a relatively short amount of time, the expedited methodology provided a severity score capable of predicting PTOA risk, without needing to have the intact contralateral limb included in the CT scan. The described methods provide surgeons an objective, quantitative representation of the severity of a fracture. Obtained prior to the surgery, it provides a reasonable alternative to current subjective classification systems. The expedited severity metric offers surgeons an objective means for factoring severity of joint insult into treatment decision-making.
Introduction
Post-traumatic osteoarthritis (PTOA) is a debilitating disorder resulting from trauma to an articular joint. PTOA most predictably develops after an articular fracture. Treatment of these fractures involves trying to restore the fragmented articular surface.1 The severity of the fracture correlates highly with the risk of PTOA,1 so treating surgeons evaluate fracture severity as part of their treatment decision-making. However, conventional systems for classifying the severity of the initial injury are highly subjective and have poor reliability,2,3 thus making it difficult to distinguish PTOA risk associated with the initial injury from that influenced by the treatment.
A CT-based method for assessing fracture severity was previously developed, with the goal of providing an objective, quantifiable measure.4 Relying upon fracture mechanics theory, the fracture severity assessment methodology used measures of interfragmentary surface area to infer the amount of energy absorbed during fracture,5,6 the amount of comminution in the resulting fracture, and the dispersion/displacement of the fracture fragments. Combining these components into a single overall severity score produced a reliable metric for objective assessment of fracture severity.4
However, the fracture severity assessment methods presented serious practical limitations for clinical use. The greatest limitations of the prior methodology were the time and manual effort required to obtain a severity score. The roughly 8 to 10 hours of dedicated analyst time before a surgeon could get a score to assist in treatment planning was too long for routine clinical use. The method was further limited by requiring that a contralateral intact limb be included in the CT scan, which presents a challenge in the routine clinical setting. For the severity metric to ever be applied clinically the time required to obtain a severity score must be significantly reduced and the need for a CT of the contralateral limb must be eliminated.
To address these limitations, an expedited approach for severity assessment has been developed.7 The expedited approach builds upon the prior fracture mechanics methods, but it utilizes a textural analysis of CT images from the fractured bone to capture the disruption in the spatial distribution of CT intensities associated with an intact bone being fractured, in lieu of direct measurement of interfragmentary surface area. This approach leverages the fact that intact bone appears as contiguous similar intensity regions, and then following fracture there is a disruption in the ordered pattern with more dissimilar intensity regions in contiguity. The focus of this paper is to describe and implement an expedited fracture severity methodology that can be used more broadly. The specific objective was to establish how well the expedited fracture severity metric could predict two-year PTOA risk in patients with fractures of the tibial plafond.
Methods
The same inclusion criteria were used for patient eligibility as in the prior study4: an isolated closed or open fracture treated using a splint or a spanning external fixator to return the limb to normal length and alignment, and a CT scan covering the entire length of the fracture One significant difference was that the expedited metric did not require the inclusion of an intact contralateral limb in the CT image, making it possible to include additional patients in the analysis. An Institutional Review Board approved the protocol used in this study, and informed consent was obtained from all patients.
Based upon preliminary evaluations of several candidate methods, an expedited fracture severity metric was computed from CT scans using the heterogeneity of the gray level co-occurrence matrix (GLCM) to quantify the order vs. disorder of each CT image slice. The GLCM is a well-established method for characterizing the texture of an image by counting how often specific intensity values occur near one another and then extracting statistical measures from this matrix.8,9 The heterogeneity, a GLCM-based statistical measure, was judged to be the most appropriate to use in this context because it best captured the interfragmentary surface area of the fractured bone (Figure 1). When comparing the heterogeneity value of a fractured limb to the limb before fracture, the fractured limb contains the same neighboring pixel relationships except for along interfragmentary surfaces, where the previous bone-to-bone relationships of the intact limb are replaced by bone-tosoft tissue relationships in the fractured limb. All of the expedited fracture severity analysis was programmed in MATLAB (The MathWorks, Inc., Natick, MA).
Figure 1.
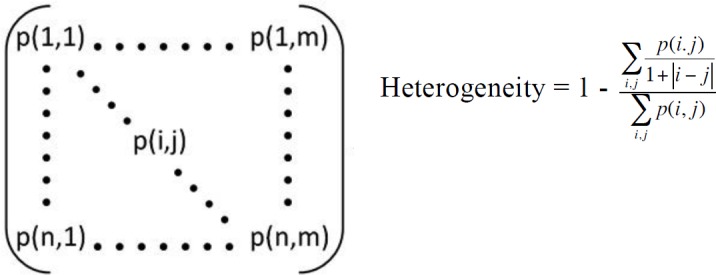
The GLCM (left) is shown along with the heterogeneity equation. The p(i,j) term represents the value in the ith row and jth column of the GLCM. The heterogeneity increases when entries in the GLCM are further off the diagonal, i.e. when i and j differ substantially (as when bone and soft tissue, with disparate CT intensities, are in close proximity along fracture edges).
Prior to performing textural analysis of the CT image data, the portion surrounding just the tibia had to be identified. This process involved segmenting the tibia (i.e., identifying the tibia bone and fragments on CT slices) so as to exclude extraneous soft tissue, plaster casts, noise, and other bones from analysis. This was done using an existing 3D watershed-based segmentation method,10 supplemented with occasional limited manual intervention. The articular surface was then identified at the distal end of the tibia to provide an appropriate and repeatable landmark for the expedited fracture severity analysis. The differences between heterogeneity values from the fractured and intact contralateral limbs, when compared to the interfragmentary surface area along the fractured length of the tibia, generally correlated with each other (Figure 2), engendering confidence in this approach. However, in order for this methodology to truly be clinically useful, a method for analyzing these data in the absence of a CT scan from the contralateral limb is essential.
Figure 2.
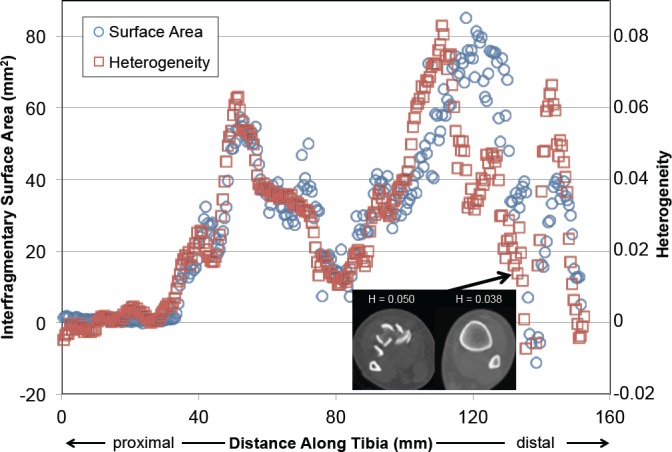
The interfragmentary surface area and the heterogeneity are plotted here along the length of the fractured tibia. Heterogeneity values are the difference between those of the fractured bone vs. its intact contralateral.
A patient-specific method of normalization was therefore developed to serve as a surrogate for having CT data from the actual intact contralateral limb.11 The surrogate was developed utilizing the 20 cases for which intact contralateral CT data were available, but it does not require that data for subsequent use. The normalization method accounted for patient height and weight, as well as for differences in CT scan settings (in-plane spatial resolution, slice thickness/spacing, and CT convolution kernels). The differences in CT scan settings presented a practical reality that needed to be accommodated in this work, and broader clinical utility is assured by reducing dependence upon any specific set of CT settings. A simple bi-linear surrogate model of the intact heterogeneity data and its dependence on these CT and patient-specific parameters was derived and saved for use later in the severity component calculations.7
A comprehensive fracture severity score that included the same severity components as in the prior full severity metric was derived using expedited methods. The components of fracture energy, fragment dispersion, and articular comminution were modeled after those of the prior full metric components, but derived only from the GLCM and heterogeneity. The expedited severity metric included a surrogate of the fracture energy by subtracting the intact heterogeneity surrogate from the fractured heterogeneity, summed over the length of the fracture. The expedited severity metric also included a surrogate for fragment dispersion by quantifying the amount of soft tissue-like CT intensities interspersed between fragments (Figure 3). The third and final component of the expedited severity metric was a surrogate for articular comminution, which was calculated from the fragment dispersion within 9 mm of the articular surface at the distal end of the tibia.
Figure 3.
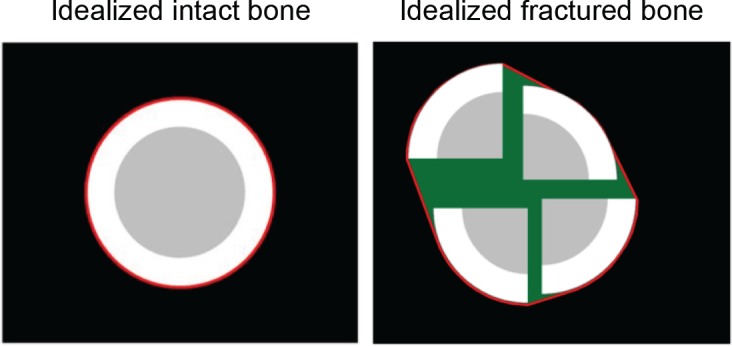
These idealized models show soft tissue-soft tissue neighboring relationships (green) within the circumscribing convex hull (red line) for the intact and fractured bones. The volumes of these green regions are summed over the length of the fractured tibia to reflect fragment dispersion.
The final step in determining a severity score for the expedited metric was to combine the three components (fracture energy, fragment dispersion, and articular comminution) into a single comprehensive severity metric that best predicted ptoa risk. to do this, each component was normalized so that all computed values ranged from 0 to 100. Their relative contributions to the combined metric were then evaluated at different weightings ranging from 0% to 100%. The expedited fracture severity approach was used to analyze the pre-operative CT scans of 30 patients with tibial plafond fractures (18 male and 12 female). In addition to the 20 patients previously analyzed using the full fracture severity assessment methods, an additional 10 patients were analyzed for the expedited severity metric. These cases could not be analyzed before as contralateral pre-operative CT scans were not obtained.
Expedited fracture severity metric values (a continuous measure) were compared to Kellgren-Lawrence (KL) OA scores of joint degeneration obtained from radiographs at a two-year follow-up exam.12 The radiographs were examined and assigned a score by an experienced trauma fellowship-trained orthopedic surgeon. Due to the ordinal nature of the KL scores, concordance was used to evaluate the agreement between severity and KL scores.
The best weightings of individual components to produce a combined expedited fracture severity metric predictive of PTOA were determined among the 30 cases analyzed, and concordance values were calculated by comparing the combined values to their KL scores. The essential purpose of the metric is to be able to predict PTOA risk, thus differentiating between patients that do not develop PTOA (defined here as KL scores of 0 or 1) from those that do (KL score ≥ 2). Therefore, additional analyses were done to determine how much the expedited severity values varied between these groups, in addition to measuring the ability of the metric to predict binary PTOA risk. A Wilcoxon Ranked Sum test was used to test for significant differences between the cases with and without PTOA. A receiver operating characteristic (ROC) analysis was then performed on the expedited severity data to measure threshold-discriminative ability between cases developing or not developing PTOA.
Results
The age of the 30 patients enrolled in the study was 38.1±12.7 years (mean ± standard deviation). The heights were 173.8±10.2 cm and weights 89.0±25.7 kg. All of the patient demographics and CT acquisition parameters are shown in Table I
Table I.
Patient demographics and specific CT image reconstruction parameters for each case.
| Case | Age | Sex | Height (cm) | Weight (kg) | Resolution (mm) | Slice Thickness (mm) | Convolution Kernel |
|---|---|---|---|---|---|---|---|
| 1 | 26 | F | 160 | 61.4 | 0.47 | 0.50 | FC01 |
| 2 | 42 | F | 160 | 69.4 | 0.35 | 0.30 | B31s |
| 3 | 40 | F | 170.2 | 170.5 | 0.66 | 0.30 | B80s |
| 4 | 23 | F | 160 | 69.6 | 0.28 | 1.00 | FC01 |
| 5 | 55 | F | 162.5 | 72.7 | 0.43 | 0.30 | B80s |
| 6 | 49 | F | 152.4 | 59.9 | 0.41 | 0.50 | FC01 |
| 7 | 28 | M | 190.5 | 70.0 | 0.39 | 0.30 | B80s |
| 8 | 29 | M | 188 | 97.0 | 0.33 | 0.50 | FC01 |
| 9 | 21 | M | 179 | 87.2 | 0.49 | 0.50 | FC01 |
| 10 | 20 | M | 175.3 | 55.0 | 0.51 | 1.00 | FC01 |
| 11 | 37 | F | 162.5 | 79.5 | 0.33 | 0.50 | FC01 |
| 12 | 48 | F | 162.5 | 62.0 | 0.55 | 0.50 | FC01 |
| 13 | 57 | F | 158.8 | 89.8 | 0.41 | 0.50 | FC03 |
| 14 | 36 | F | 170.2 | 72.3 | 0.68 | 0.50 | FC01 |
| 15 | 41 | M | 180.3 | 95.3 | 0.46 | 0.30 | B80f |
| 16 | 54 | M | 181 | 80.4 | 0.36 | 0.50 | FC01 |
| 17 | 40 | M | 180 | 84.1 | 0.68 | 0.50 | FC01 |
| 18 | 24 | M | 177.8 | 80.9 | 0.66 | 0.50 | FC01 |
| 19 | 57 | F | 180.3 | 86.2 | 0.63 | 0.50 | FC01 |
| 20 | 25 | M | 170 | 90.9 | 0.28 | 0.50 | FC01 |
| 21 | 64 | M | 178 | 95.0 | 0.25 | 0.50 | FC01 |
| 22 | 26 | M | 175 | 120.5 | 0.33 | 0.30 | FC01 |
| 23 | 21 | M | 190.5 | 113.6 | 0.59 | 0.50 | FC01 |
| 24 | 41 | F | 167.6 | 75.0 | 0.33 | 0.50 | FC01 |
| 25 | 42 | M | 177.8 | 109.0 | 0.24 | 0.50 | FC01 |
| 26 | 40 | M | 177.8 | 86.2 | 0.39 | 0.50 | FC01 |
| 27 | 26 | M | 180.3 | 110.0 | 0.29 | 0.50 | FC01 |
| 28 | 34 | M | 180 | 83.0 | 0.24 | 0.50 | FC01 |
| 29 | 42 | M | 184 | 89.3 | 0.41 | 0.30 | B31s |
| 30 | 56 | M | 182.9 | 154.2 | 0.78 | 0.50 | FC01 |
The concordance between each component and the KL scores for all 30 cases was found to be 68.3%, 68.9%, and 68.3% for the fracture energy, overall fragment dispersion, and articular dispersion, respectively. The best combination of individual weightings for constituent elements in a combined severity metric were determined to be 33% fracture energy, 61% fragment dispersion, and 6% articular dispersion. For this set of weightings, the combined expedited severity metric scores showed a moderate predictive capability, having a 75.2% concordance with the KL scores (Figure 4).
Figure 4.
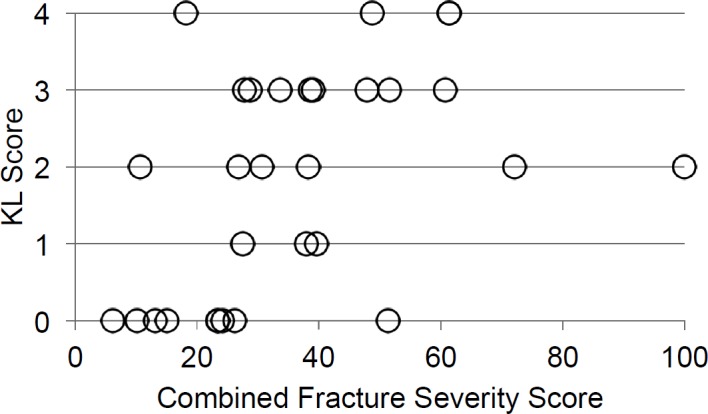
Comparison between the combined scores of the expedited fracture severity metric and the KL scores are plotted here for the 30 cases that were analyzed.
The cases that did not develop PTOA differed significantly (p < 0.05) from those that did for two of the three components of fracture severity (Figure 5). The most significant difference was in fragment dispersion (p = 0.021). The differences in articular comminution were the next most significant (p = 0.024). The only component whose values did not significantly differ was fracture energy (p = 0.079). When the components were assembled into a combined severity score, a significant difference was found between the cases in terms of OA development, with p = 0.004 using the Wilcoxon Ranked Sum test (Figure 5).
Figure 5.
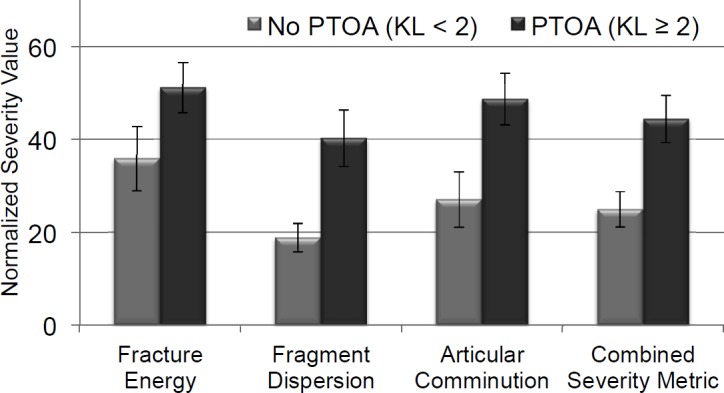
The expedited fracture severity constituent values and the combined severity metric values are shown here for those cases without OA (KL<2) vs. those with OA (KL≥2).
The ROC analysis varied the severity threshold values and then developed contingency tables for sensitivity and specificity (Figure 6). The expedited severity metric showed a good ability to predict PTOA outcome with the best results presented at a threshold value of 27.75 (represented by the green point on the ROC curve in Figure 6). This severity threshold predicted the true outcome in 80% of the cases.
Figure 6.
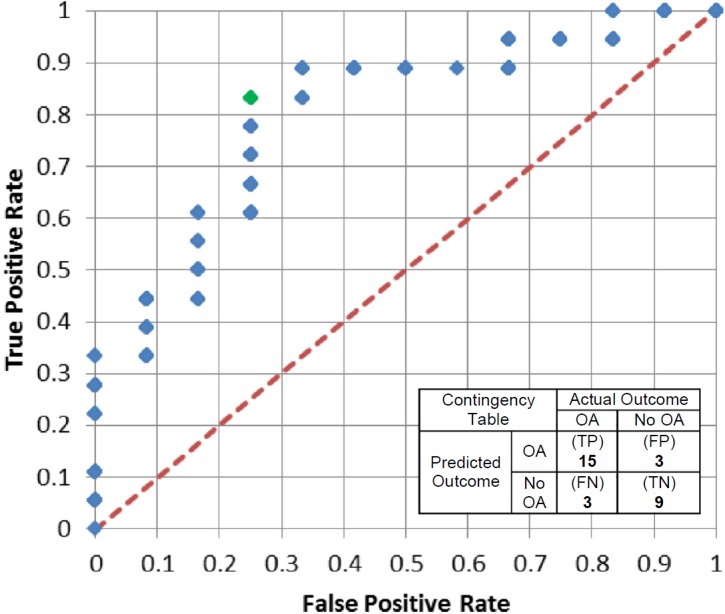
Receiver Operating Characteristic (ROC) curve for varying severity thresholds of the expedited severity metric. The green data point is for a severity threshold of 27.75, which corresponds to the inset contingency table showing an 80% success rate in predicting whether or not PTOA will ensue within two years following IAF.
The average time to obtain a severity score using the expedited analysis methods was just under 15 minutes (14.9 minutes). The amount of user intervention time averaged roughly 12 minutes (range: 3 to 25 minutes), or 80%, of the total analysis time. The majority of that time was spent segmenting the fractured tibia from the CT scan data. Of the 30 cases analyzed, 10 required some form of adjustment to the initial automated segmentation.
Discussion
The prior full fracture severity metric had been used to analyze tibial plafond fractures from 20 patients.4 The fracture severity metric strongly predicted PTOA, showing an 88% concordance with two-year follow-up KL scores. The expedited fracture severity metric described here showed a 75.2% concordance with KL scores for a larger series of 30 patients with tibial plafond fractures. It is important to understand that perfect concordance with KL radiographic OA scores is not necessarily to be expected; chronic mechanical factors such as residual surface incongruity also influence the outcome of the joint.
Given its ability to predict PTOA outcome, the greatly reduced processing time, and its lack of reliance upon a CT scan of the contralateral limb, the expedited fracture severity assessment methodology is likely to be much more amenable to clinical application compared to the prior full fracture severity metric. This provides surgeons with an objective, quantitative representation of the overall severity of the fracture. Because it can be obtained prior to the surgery, there is potential for it to replace the current subjective classification systems (AO/OTA, Rüedi and Allgöwer), which have been shown to unreliably assess severity.2, 13, 14 The existing categorical classification systems, while undeniably useful in guiding treatment, poorly predict the risk of PTOA in patients with tibial plafond fractures. With the expedited metric in place, a surgeon would have an objective numerical score to determine severity of joint insult.
The expedited fracture severity metric possesses several attributes that make it more practical for clinical application than the prior full fracture severity metric. The first, and most significant, is the calculation time required to obtain a severity score. At about 15 minutes, this is significantly less time than the 8 hours required for the prior severity metric. Although not here presented, inter-user variability testing showed high reliability of the severity analysis methods, and new users were quickly able to learn how to use the software.7 An analyst is onlyrequired to have basic anatomical knowledge to successfully perform the analysis. Another significant advantage of the expedited metric is that it provides a severity score that reliably predicts PTOA development without the need of an intact contralateral limb CT scan. This is an important step in developing a clinically applicable expedited metric, because a CT scan of the contralateral limb may not be routinely obtained. Additionally, retrospective clinical analyses in situations where there is no scan of the intact contralateral limb can be performed.
A limitation of the expedited metric is the small number of cases analyzed to date. Adding more cases (the focus of ongoing work) will further assess the ability of the metric to predict PTOA. Another limitation of the expedited metric is the limited number of cases used in constructing the intact surrogate model used for the expedited fracture energy assessment. While the curve shows a good relationship between cases, further work will be needed to more definitively establish its value. A final limitation is that the expedited severity metric in its current manifestation is only designed to analyze fractures of the tibial plafond. However, the metric has potential to be applied to other joints also subject to PTOA development, such as the knee or the wrist.
Conclusion
The ability to reliably assess the severity of articular fractures is critical to prognosticating the eventual fate of the joint. An assessment method that distinguishes the relative PTOA risk attributable to damage from the initial trauma versus other factors is needed. A previously developed objective CT-based fracture severity assessment methodology provided a reliable and valuable measure of severity for fractures of the tibial plafond. However, the amount of time and resources required made its clinical use impractical. The expedited CT-based methods for evaluating fracture severity presents a solution to the issues limiting the usefulness of previous fracture severity metrics. In a relatively short amount of time, the expedited methodology provides a severity score capable of predicting PTOA risk without needing to have the intact contralateral limb included in the CT scan.
Acknowledgments
The research reported in this paper was supported by the National Institute of Arthritis and Musculoskeletal and Skin Diseases of the National Institutes of Health under award numbers P50AR48939 and P50AR055533. The content is solely the responsibility of the authors and does not necessarily represent the official views of the National Institutes of Health. The Orthopaedic Research and Education Foundation and the Arthritis Foundation provided additional funding.
References
- 1.Marsh JL, Buckwalter J, Gelberman R, Dirschl D, Olson S, Brown T, et al. Articular fractures: Does an anatomic reduction really change the result? J Bone Joint Surg [Am] 2002;84A(7):1259–1271. [PubMed] [Google Scholar]
- 2.Dirschl DR, Adams GL. A critical assessment of factors influencing reliability in the classification of fractures, using fractures of the tibial plafond as a model. J Orthop Trauma. 1997;11(7):471–476. doi: 10.1097/00005131-199710000-00003. [DOI] [PubMed] [Google Scholar]
- 3.Martin JS, Marsh JL, Bonar SK, DeCoster TA, Found EM, Brandser EA. Assessment of the AO/ ASIF fracture classification for the distal tibia. J Orthop Trauma. 1997;11(7):477–483. doi: 10.1097/00005131-199710000-00004. [DOI] [PubMed] [Google Scholar]
- 4.Thomas TP, Anderson DD, Mosqueda TV, Van Hofwegen CJ, Hillis SL, Marsh JL, et al. Objective CT-based metrics of articular fracture severity to assess risk for posttraumatic osteoarthritis. J Orthop Trauma. 2010;24(12):764–769. doi: 10.1097/BOT.0b013e3181d7a0aa. [DOI] [PMC free article] [PubMed] [Google Scholar]
- 5.Beardsley CL, Anderson DD, Marsh JL, Brown TD. Interfragmentary surface area as an index of comminution severity in cortical bone impact. J Orthop Res. 2005;23(3):686–90. doi: 10.1016/j.orthres.2004.09.008. [DOI] [PMC free article] [PubMed] [Google Scholar]
- 6.Beardsley C, Marsh JL, Brown T. Quantifying comminution as a measurement of severity of articular injury. Clin Orthop Relat Res. 2004;423:74–8. doi: 10.1097/01.blo.0000131637.04391.40. [DOI] [PubMed] [Google Scholar]
- 7.Kilburg AT. Development of an expedited objective fracture severity assessment methodology. Iowa City, IA, U.S.A.: The University of Iowa; 2012. [Google Scholar]
- 8.Haralick R, Shanmugam K, Dinstein I. Texture features for image classification. IEEE Trans Systems Man Cybernetics. 1973;SMC-3:610–621. [Google Scholar]
- 9.Sutton RN, Hall EL. Texture measures for automatic classification of pulmonary disease. IEEE Trans Computers. 1972;c-21(7):667–676. [Google Scholar]
- 10.Thomas TP, Anderson DD, Willis AR, Liu P, Marsh JL, Brown TD. ASB Clinical Biomechanics Award Paper 2010: Virtual pre-operative reconstruction planning for comminuted articular fractures. Clin Biomech. 2011;26(2):109–15. doi: 10.1016/j.clinbiomech.2010.12.008. [DOI] [PMC free article] [PubMed] [Google Scholar]
- 11.Thomas TP, Anderson DD, Willis AR, Liu P, Marsh JL, Brown TD. A method for the estimation of normative bone surface area to aid in objective CT-based fracture severity assessment. Iowa Orthop J. 2008;28:9–13. [PMC free article] [PubMed] [Google Scholar]
- 12.Kellgren JH, Lawrence JS, Gallagher EJ. Radiological assessment of osteo-arthrosis. Ann Rheum Dis. 1957;16(4):464–502. doi: 10.1136/ard.16.4.494. [DOI] [PMC free article] [PubMed] [Google Scholar]
- 13.Swiontkowski MF, Sands AK, Agel J, Diab M, Schwappach JR, Kreder HJ. Interobserver variation in the AO/OTA fracture classification system for pilon fractures: is there a problem? J Orthop Trauma. 1997;11(7):467–470. doi: 10.1097/00005131-199710000-00002. [DOI] [PubMed] [Google Scholar]
- 14.Dirschl DR, Ferry ST. Reliability of classification of fractures of the tibial plafond according to a rankorder method. J Trauma. 2006;61(6):1463–1466. doi: 10.1097/01.ta.0000202484.23607.ce. [DOI] [PubMed] [Google Scholar]
- 15.Thomas TP, Anderson DD, Mosqueda TV, Van Hofwegen Van Hofwegen, Hillis SL, Marsh JL, et al. Objective CT-based metrics of articular fracture severity to assess risk for posttraumatic osteoarthritis. J Orthop Trauma. 2010;24(12):764–769. doi: 10.1097/BOT.0b013e3181d7a0aa. [DOI] [PMC free article] [PubMed] [Google Scholar]


