Abstract
Collective cell migration in morphogenesis and cancer progression often involves the coordination of multiple cell types. How reciprocal interactions between adjacent cell populations lead to new emergent behaviours remains unknown. Here we studied the interaction between Neural Crest (NC) cells, a highly migratory cell population, and placodal cells, an epithelial tissue that contributes to sensory organs. We found that NC cells “chase” placodal cells by chemotaxis, while placodal cells “run” when contacted by NC. Chemotaxis to Sdf1 underlies the chase, while repulsion involving PCP and N-Cadherin signalling is responsible for the run. This “chase-and-run” requires the generation of asymmetric forces, which depend on local inhibition of focal adhesions. The cell interactions described here are essential for correct NC migration and for segregation of placodes in vivo and are likely to represent a general mechanism of coordinated migration.
Introduction
Cell migration is a fundamental process in morphogenesis1, 2 and cancer metastasis3, 4, and often involves the coordinated movement of different cell types. However, how such coordinated behaviour is achieved remains unknown. Here we investigate this problem in two embryonic cell types: neural crest (NC) and placodes. NC is a highly migratory cell population5, 6 likened to cancer7, 8; while placodes are epithelial and contribute to sensory organs9, 10. Their derivatives interact to form several cephalic structures11–14; their precursors lie adjacent to each other and are already typical epithelial and mesenchymal tissues. Interaction of these precursors has not been investigated, but may provide a robust model to study cellular properties emerging through mutual interaction of tissues with different migratory capabilities, like epithelial cancer and mesenchymal stromal fibroblast15.
Here we show that placodes form by local cell rearrangements within the epithelium in response to migrating NC. Surprisingly, NC and placode cells engage in a “chase-and-run” behaviour, with NC cells “chasing” placode by chemotaxis, while placode cells “run” as they are contacted by NC. We establish the molecular mechanisms underlying these behaviours and demonstrate the importance of this process for the coordinated morphogenesis of the neural crest and placodes in vivo.
Results
Interaction between neural crest and placode cells
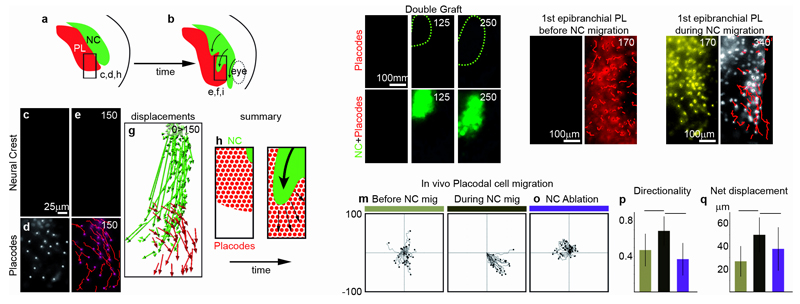
To study the interaction between placode and NC cells, we focused on cephalic NC and epibranchial placode precursors9, which are in direct apposition (Fig. 1a,b; Supplementary Fig. 1a-h). Analyzing their movements by time-lapse cinematography in embryos with fluorescently labelled NC and placodes, we found that both populations undergo directional migration (Fig. 1c-i; Supplementary Fig. 1i-l). Double labelling revealed that gaps within the placode region formed precisely where NC cells migrated suggesting that placodes (Fig. 1j, red) move away from NC (Fig. 1j, green; Supplementary Movies 1 and 2). Indeed, further cell tracking revealed that placode cells move randomly before NC migration (Fig. 1k,m) with a low directionality and poor net displacement (Fig. 1p,q, brown bars). However, as NC cells arrive, placodal cells switch to directional migration (Fig. 1l,n) with a net increase of directionality and displacement (Fig. 1p,q, black bars, Supplementary Movie 3). Directional migration is lost when NC are ablated (Fig. 1o-q, purple bars; Supplementary Movie 3), suggesting that this interaction is crucial for placode cell behaviour.
Figure 1. Neural Crest cell migration triggers directional movement of placodal cells.
(a-b) NC and placodes are located into adjacent domains (diagram made after Snail2 and Eya1 expression patterns at stages 16 and 21). The region monitored in time-lapse movies is delimited by a square and corresponds to the precursors of the first epibranchial placode located ventrally to the second NC stream. (c-f) In vivo cell migration of NC from the second stream (c, e) and placodal from the first epibranchial placode (d, f). Cells were labelled with nuclear-mCherry prior to the graft. (g) Displacement maps of the cells shown in c to f. (h-i) Diagram proposing that placodal cells (red) move away when NC cells (green) migrate ventrally. (j) Stills from an in vivo time-lapse movie showing that NC migration (green) actually leads to the formation of gaps in the placodal region (red). (k-l) Stills from time-lapse movies showing the movement of placodes before (k) and during NC migration (l). (m-o) Tracks of placodal cells from time-lapse movies before NC migration, during NC migration or after NC ablation. (p-q) Directionality and net displacement extracted from tracks shown in f (n=3 independent experiments, one-way ANOVA, P<0.0001; individual comparisons **, p<0.01, error bars: sd). Time is in minutes.
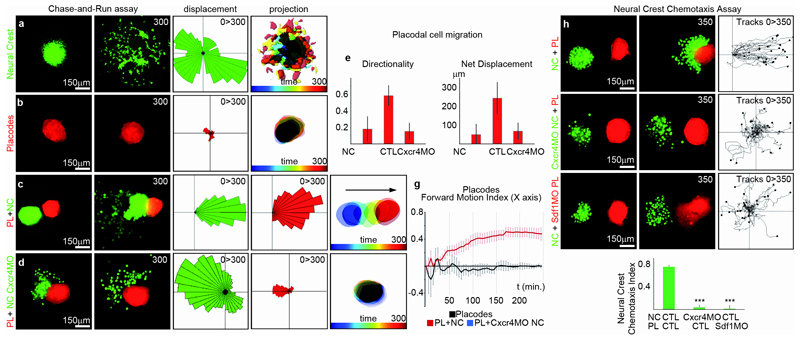
To analyse NC-placode interaction in the absence of surrounding tissues, we set up an in vitro system where NC and placodes are cultured next to each other. Surprisingly, NC and placodal cells engage in a “chase-and-run” behaviour (Supplementary Movie 4). When cultured separately, NC cells move randomly (Fig. 2a) whereas placode cells hardly move (Fig. 2b). However, like in vivo (Fig. 1a-j), in the presence of NC placodes switch to directional migration, away from the NC (Fig. 2c; Supplementary Movie 4). Conversely, NC cells appear to be attracted by placodes, which express Sdf1 (Supplementary Fig. 2a-e) a cytokine previously implicated in NC chemoattraction16–20. Indeed, normal NC chemotaxis towards placodes placed at a distance was inhibited by morpholinos (MOs) against Sdf1 or its receptor20 (Fig. 2h-k, Supplementary Movie 5). Sdf1 is only required in tissues surrounding the NC (Supplementary Fig. 2h,i), and inhibiting Sdf1/Cxcr4 expression or blocking placode development using an Eya1 MO21 equally blocked NC migration. Thus, NC migration requires both placodes and Sdf1 (Supplementary Fig. 2f,g) and blocking chemotaxis impairs the chase-and-run behaviour (Fig. 1d-f, Supplementary Movie 4). Interestingly, inhibition of chemotaxis by CXCR4 MO leads to transient contact between NC and placodes (Fig. 2d), which is however insufficient to promote directional placode movement (Fig. 2g, blue line), suggesting that continued contact between these two cell populations is required. To test if chemotaxis alone accounts for the “chase-and-run” behaviour, we placed NC cells next to non-placodal ectoderm expressing endogenous Sdf1 (Supplementary Fig. 3; Movie 6). NC cells were attracted to the ectoderm, but invaded it and no ectodermal “run” behaviour was observed. Together, these results identify placode precursors as the source of Sdf1 in vivo and establish a “chase-and-run” interaction between NC and placodes during which NC cells actively chase Sdf1-positive placode precursors and simultaneously repel them.
Figure 2. Chase-and-run: Neural Crest and Placodes undergo Sdf1-dependent coordinated collective migration.
(a) Control NC explants cultured on Fibronectin. (b) Control placodal cells cultured on Fibronectin. (c) Co-culture of control NC and placodes. (d) Co-culture of placodes and Cxcr4MO-NC cells. (a-d) Displacement maps and time projection are shown for each culture condition. (e-f) Placodal cell migration: directionality and net displacement (n=3 independent experiments, one-way ANOVA, P<0.0001, individual comparisons; **, p<0.01; error bars: sd). (g) Placode directionality along the x axis plotted against time; nPL+NC=10 independent experiments; nPL= 5 independent experiments; nPL+Cxcr4MO NC= 9 independent experiments; error bars: sem). (h-k) Neural Crest chemotaxis assay with control NC (h), Cxcr4MO-NC cells (i) and Sdf1MO-NC cells (j). Tracks from 3 independent experiments (one-way ANOVA P<0.0001; individual comparisons ***, p<0.001; error bars: sd).
Cell adhesion complex between neural crest and placodes
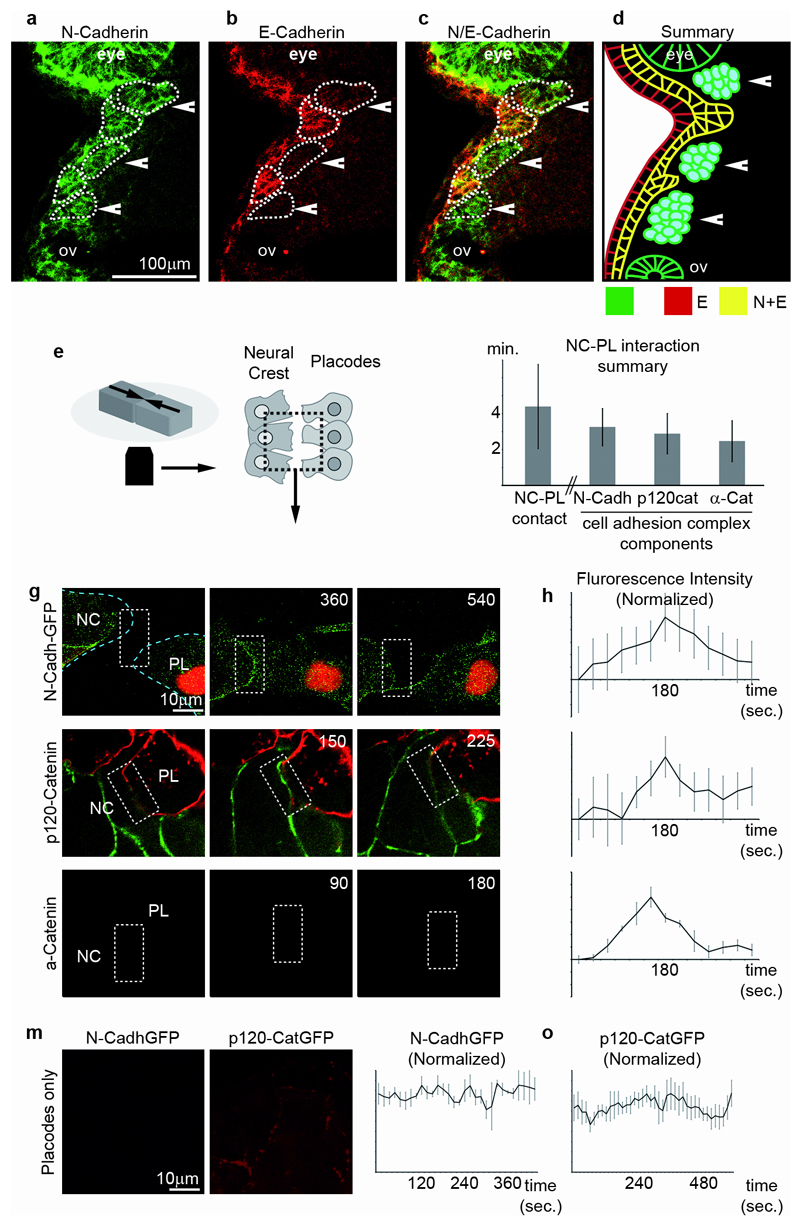
What is the molecular nature of NC-placode interface? Both NC and placodes express N-Cadherin while E-Cadherin is only found in placodes (Fig. 3a-d). In vitro, NC and placodes make repeated transient contacts lasting on average 4 minutes (Fig. 3e,f, first column, Supplementary Movie 7), during which N-Cadherin, p120-Catenin and alpha-Catenin accumulate at the junction (Fig. 3f-l; Supplementary Movie 8). This indicates the formation of transient cell-cell adhesion complexes and contrasts to the stable accumulation of N-Cadherin and p120-Catenin between placode cells (Fig. 3m-o). To assess if these transient NC-placode junctions were functional and able to transmit force we used traction-force microscopy to measure the tension produced at the NC-placodes interface22. Indeed a net force of 12nN±2.25 is generated between the two explants. Together, these results show that NC and placodes form transient, but functional, cell-cell adhesion complexes.
Figure 3. Neural Crest and placodes form transient, but functional, adherens junctions.
(a-d) Double immunostatining for N- and E-Cadherin on histological sections through the cephalic regions of Xenopus embryos at stage 25. N-Cadherin (a) is expressed in NC (arrowheads) and epibranchial placodes (asterisks) as well as the eye and the otic vesicle (ov). E-Cadherin (b) is expressed only in epibranchial placodes and the superficial ectoderm. (c) Merged picture of the green and red channels. (d) Summary of cadherins distribution in NC and placodes. (e) Diagram representing the experimental set-up. (f) From left to right: duration of individual NC-placodes contact at the interface between the two tissues during the chase-and-run; duration of N-Cadherin, p120-catenin and alpha-catenin accumulations during NC-placodes physical contacts (data collected from 3 independent experiments, error bars: sd). (g-l) Dynamics of the formation of transient adherens junctions between NC and placodes. (g, i, k) Confocal images. (g) NC and placodes express N-Cadherin-GFP. (i) NC cells express p120-Catenin-GFP, placodes are labelled with membrane-mCherry. (k) NC cells express alpha-Catenin-GFP, placodes are labelled with membrane-mCherry. (h, j, l) Variation of fluorescence intensity over time of GFP-bound molecules shown in (g, i, k); after background subtraction and normalization. Average from 5 independent cell-cell junctions (error bars: sem). (m-o) Localization and dynamics of N-Cadherin-GFP (m-n) and p120-Catenin-GFP (m, o) between placodal cells. Average from from 4 independent cell-cell junctions, error bars: sem.
Asymmetric distribution of forces and focal adhesions at the neural crest-placode interface
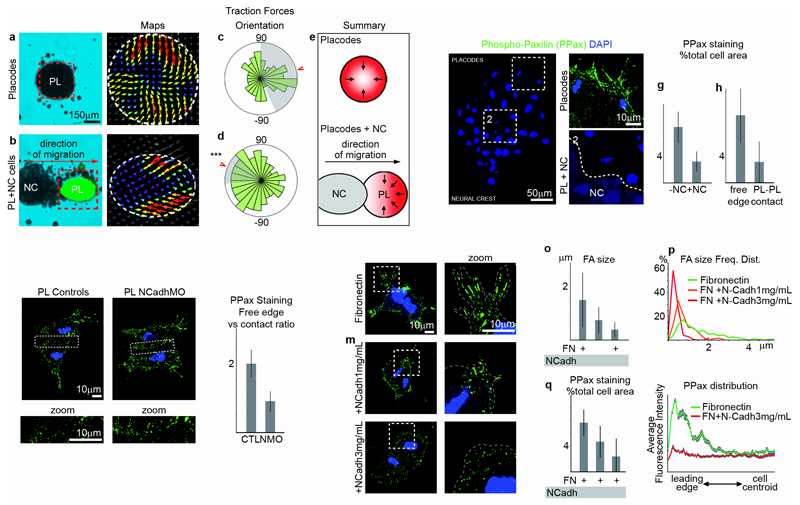
To assess whether local effects at the NC-placode interface promote a break of symmetry that could explain directional placode cell migration, we analysed the distribution of traction forces generated by the placode explant (Fig. 4a-d). When cultured alone, placode cells show radial distribution of traction forces pointing inwards (Fig. 4a,c,e), whereas, when co-cultured with NC cells, their traction forces are mostly aligned with the direction of migration and point towards the NC (Fig. 4b,d,e). This asymmetric distribution of traction forces in placodes is consistent with the direction of its migration. Traction forces require adhesion to the substrate and the size of the focal adhesions (FA) correlates with the force generated23. Thus, to explain how the asymmetric forces are generated we analysed the distribution of FAs using phospho-Paxillin (PPax) antibodies (Fig. 4f-r). Indeed, FAs were dramatically reduced where placodes contact NC cells (Fig. 4f-h) or other placode cells (Fig. 4i), generating asymmetric FA distribution in relation to the cell contact. This process is N-Cadherin dependent: FA asymmetry is lost in the presence of N-Cadherin MOs (Fig. 4j,k). To test if exposure to N-Cadherin alone mimics the effect of placode-NC or placode-placode interaction on FA distribution, we plated placodes on Fibronectin (Fn) or Fn containing N-Cadherin. On Fn, placode cells formed normal protrusions with large FAs (Fig. 4l), whereas on Fn+N-Cadherin the average FA size is dramatically reduced, especially at the leading edge of cells, and their contact-dependent distribution is abolished (Fig. 4m-r). These observations suggest that N-Cadherin interferes with FA maturation rather than their formation. Together, our results show that N-Cadherin-dependent cell-cell contacts between placode cells and between placode and NC cells locally inhibit placode adhesion to the matrix and maturation of FAs. This results in the restriction of traction forces to the free edge of the placode population. Additionally, contact between NC and placodes leads to restriction of FAs to the opposite side of the placode cluster, generating traction forces in the direction of placode movement.
Figure 4. Neural Crest-Placodal interaction leads to asymmetric traction forces and inhibition of focal adhesions.
(a-e) Traction forces in placodal cells alone (a, n=3 independent experiments) or in contact with NC cells (b; n=4 independent experiments; placodes are identified by green fluorescence). (c-d) Overall orientation of traction forces in placodal cells alone (c, n= 3210 angles from 3 independent experiments) or in contact with NC cells (d, n= 2925 angles from 4 independent experiments). Arrowhead indicates mean angle, grey shows the standard deviation. Orientation of forces in placodes in contact with NC cells is significantly different than a uniform circular distribution (Rayleigh’s, plot c, P= 0.338; plot d, P= 0.0059(***)). (e) Summary of a-d. (f) PhosphoPaxillin (PPax) immunostaining (green) on NC (Red) and placodal cells, nuclei are blue (DAPI). Dotted lines mark the areas that are magnified (Inset 1: border opposite to the contact; Inset 2: contact with NC). (g-h) PPax staining as a percentage of the total cell area (panel g, n=4 independent experiments, Mann-Whitney test, p= 0.0095(**), error bars: sd; panel h, n=3 independent experiments; Mann-Whitney test: p<0.0001(***), error bars: sd). (i-k) PPax immunostaining in control placodes and NCadhMO placodes, n=6 independent experiments; Mann-Whitney test: p=0.0012(**), error bars: sd. (l-n) PPax immunostaining (green) in placodal cells cultured on Fn (l), Fn+1μg/mL of N-Cadherin (m) or Fn+3μg/mL of N-Cadherin (n). Nuclei are in blue (DAPI). Dotted lines mark the regions that are magnified (second column). (o) Average size of the focal adhesions (n=3 independent experiments; non-parametric ANOVA (Kruskal-Wallis), p<0.0001; individual comparisons; ***, p<0.001; error bars: sd). (p) Frequency distribution of the sizes of focal adhesion shown in o (542 focal adhesions from 3 independent experiments). (q) Quantification of PPax staining shown in f. Total area of PPax staining as a percentage of the total cell area (n=5 independent experiments; ANOVA, p<0.0001; individual comparisons; *, p<0.05; **, p<0.01; error bars: sd). (r) Distribution of the average fluorescence intensity of PPax staining in placodal cells on Fn (ncells=8; 4 series of 50 measurements per cell) and Fn+3μg/mL of N-Cadherin (ncells=9, 4 series of 50 measurements per cell). Error bars: sem.
Contact with neural crest promotes collapse of cell protrusions in placodes
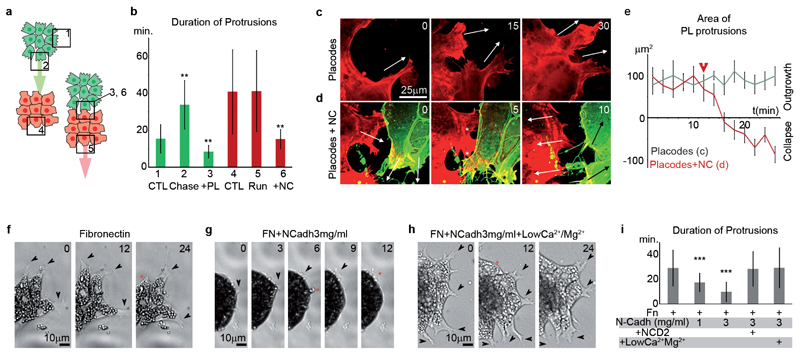
Placode cells only move directionally after contact with NC cells suggesting that direct contact somehow polarizes the entire placode cluster and may promote the formation or stabilization of protrusions away from the contact region. We compared the formation and stability of cell protrusion between NC and placode clusters in control conditions and during the chase-and-run (Fig. 5a,b). NC cells facing placodes have stable protrusions (Fig. 5a,b; bars 1 and 2) due to a local increase of Rac1 activity downstream of Cxcr4 in NC cells20. Importantly, no difference in protrusion stability was observed in placode cells away from NC cells or during the chase-and-run (Fig 5a,b; bars 4 and 5). This indicates that, contrary to collective migration of border cells in Drosophila or of lateral line in zebrafish24, 25, directional migration of placodes is not initiated by stabilizing or promoting protrusions at the front. However, upon contact with one another both NC and placode cell protrusions were dramatically affected in the region of contact (Fig. 5a,b; bars 3 and 6). We confirmed this observation by monitoring the dynamics of protrusive areas in placode cells. Placodal protrusions are stable or growing if untouched (Fig. 5c,e, grey line) but quickly collapse if contacted by NC cells (Fig. 5d; asterisks mark collapsing protrusions; Fig. 5e, arrowhead indicates the contact with NC cells, Supplementary Movie 9). Finally, we tested whether N-Cadherin is sufficient to mimic the effect of NC cells on placode cell protrusions. Indeed, on Fn+N-Cadherin protrusions of placode cells were less stable than those cultured on Fn alone; this effect is rescued by pre-incubating placode cells with N-Cadherin blocking antibody (NCD2) or by culturing cells in a calcium-free medium (Fig. 5f-i; Supplementary Movie 10). Together, these results show that a physical contact between NC and placodal cells locally destabilizes placode cell protrusions.
Figure 5. N-Cadherin-dependent contacts lead to cell protrusion instability.
(a-b) Duration of protrusions in NC and placodal cells cultured alone or in contact with each other. Numbers shown for each bar in b correspond to the different regions indicated by numbered squares in a (Green bars, n=3 independent experiments, ANOVA NC cells, P<0.0001; individual comparisons, **, p<0.01. Red bars, n=5 independent experiments, ANOVA PL cells; P<0.0001, individual comparisons, **, p<0.01; error bars: sd). (c-d) Stills from time-lapse movies performed on a spinning disk confocal microscope. Placodal cells are labelled with lifeAct-mCherry. NC cells are labelled with lifeAct-mCherry and membrane-GFP. Arrows indicate the direction of protrusions when growing or collapsing. Asterisks mark the protrusions that collapse after contact between NC and placodal cells. (e) Over-time variation of protrusion area in placodal cells with or without contact with NC cells (ncells=5, nprotrusions/cell=5 for 12 timepoints each; error bars, sd). Arrowhead indicates the moment of contact between NC and placodal cells. (f-h) Stills from time-lapse movies of placodal cells on Fn (f), Fn+N-Cadherin (g), Fn+N-Cadherin in low Calcium/Magnesium solution (h). Arrowheads indicate stable or growing protrusions. Red asterisks mark collapsing protrusions. (i) Duration of protrusion in placodal cells (n=6 independent experiments; non-parametric ANOVA (Kruskal-Wallis), P<0.0001, individual comparisons, ***, p<0.001). NCD2, blocking antibody against N-Cadherin. Error bars in b, e and s show standard deviation. Time is in minutes.
Contact inhibition of locomotion between neural crest and placodes
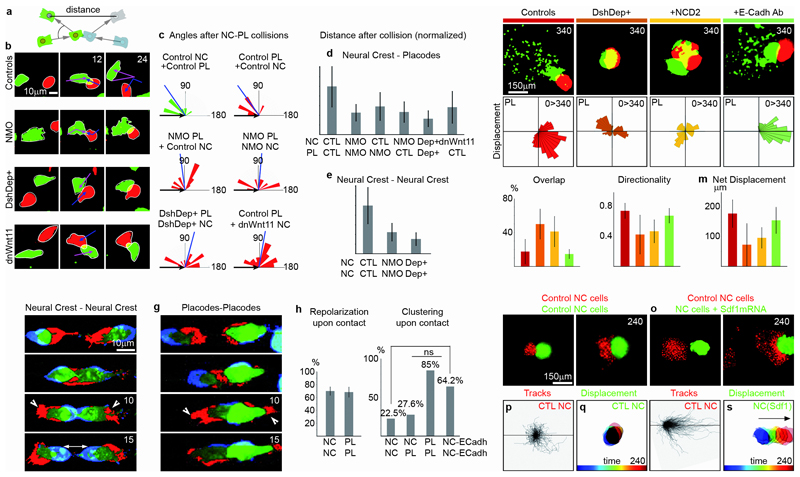
To promote directional migration, the interaction of NC and placodes should not only trigger the destabilization of protrusions, but also repolarize them away from the cell contact, as described for Contact Inhibition of Locomotion (CIL)26, 27. This repolarization significantly biases the movement of cells away from the region of cell-cell interactions and thus may account for the placode cell behaviour observed after contact with NC cells. While NC cells exhibit CIL for each other20, 28, this behaviour has not been assessed in placode cells. We analysed CIL in collision assays between isolated NC and placodal cells and measured the angle between the directions of migration before and after collision and the average distance between two colliding cells after a given time (Fig. 6a). We used NC-NC collisions as an internal control for a typical CIL response (Fig. 6c, green angles and 6e). NC and placodal cells establish only transient contact upon collision and move away from each other. After collision the new directionality is biased away from the site of contact (Fig. 6b,c; NC response: green angles; placode response: red angles; Supplementary Movie 11). As a consequence the distance between NC and placodes increases (Fig. 6b, controls; 6d, CTL bar). Interestingly, placodes also exhibit CIL when colliding with each other but fail to separate after repolarization (Fig. 6-h, Supplementary Movies 11 and 12). This failure in placode separation seems to be due to the expression of E-cadherin, which is absent in NC. Consistently, when E-cadherin expression is forced into NC, cells remain attached to each other as observed for placode cells (Fig. 6i). CIL between NC cells requires N-Cadherin20; this is consistent with our observations that N-Cadherin, present in both NC and placodes, becomes localized to the cell-cell contact, and that inhibition of placode protrusions is N-Cadherin dependent.
Figure 6. Coordinated migration of NC and Placodal cells requires contact-inhibition of locomotion.
(a-e) Collisions between single cells. The angle of repolarization (α) and the distance between the two cells are retrieved from the collisions. (b) Collisions between NC cells (green) and placodal cells (red) in control conditions, after blocking N-Cadherin expression (NMO) or Wnt/PCP (DshDep+, dnWnt11). (c) Repolarization angles in all conditions, n=6 independent experiments, Rayleigh’s test pNC=0.00015(***), pPL=0.00028(***), pPLNMO=0.2, pPLNMO+NCNMO=0.2, pPLDep+=0.1085, pPL+NCdnWnt11=0.347, blue bars: mean angle. (d-e) Distance between cell centroids 30 minutes after collision; d, n=6 independent experiments; one-way ANOVA, P<0.0001; individual comparisons; **, p<0.01; error bars: sd; e, n=3 independent experiments; one-way ANOVA: P<0.0001, individual comparisons; **, p<0.01; error bars: sd. (f-g) Collision between two NC cells (f) or two placodes (g). Consecutive frames were subtracted and colour-coded such that protrusions appear red whereas retractions appear blue. (h) Cells repolarizing upon collision (n=360 collisions from 3 independent experiments, error bars: sd). Parametric approach for percentages, two-sided test: T=0.10, α>0.05 (not significant). (i) Cell clustering upon collision (n=142 collisions from 2 independent experiments). Parametric approach for percentages, two-sided test: NC-NC vs NC-PL, T= 0.23, α>0.05 (not significant); NC-NC vs PL-PL, T=21.21, =0.001(***); PL-PL vs NC-Ecadh-NC-ECadh, T=2.99, α>0.05 (not significant); NC-NC vs NC-ECadh-NC-ECadh, T=15.91, α=0.001(***). (j) “Chase-and-run” assay with control NC and placodal cells, after blocking Wnt/PCP (DshDep+), N-Cadherin (NCD2) or E-Cadherin (n=68 chase-an-run assays from 4 independent experiments). Displacements maps show the overall placodal directionality for each condition. (k) Overlap between NC and placodal cells. One-way ANOVA: P<0.005; individual comparisons, **, p<0.01; error bars: sd. (l) Directionality of placodal cells. One-way ANOVA: P<0.01; individual comparisons, *, p<0.05; **, p<0.01; error bars: sd. (m) Net displacement of placodal cells. One-way ANOVA: P<0.01; individual comparisons, *, p<0.05; **, p<0.01; error bars: sd. (n-s) Co-culture of NC explants. (n, p-q) Two control NC explants. (o, r-s) One control explant (green), one overexpressing Sdf1 (red). 10 chase-an-run assays from 2 independent experiments. Tracks from representative examples are provided for the red cells and time projections from representative examples are shown for the green cells. Time is in minutes.
In addition, non-canonical Wnt/PCP signalling mediated by Dishevelled and Wnt11 has been implicated in CIL of NC29–33. Thus, we tested the role of N-Cadherin and Wnt/PCP in CIL of placode cells. Cells injected with N-Cadherin MOs (NMO) or with a dominant negative form of Dsh (DshDep+) to inhibit PCP signalling remain in close contact (Fig. 6d) and exhibit random angles of migration after collision as compared to the systematic reorientation in controls (Fig. 6b,c; Supplementary Movie 13). Placodes express the Wnt receptor Fz434 while migratory NC cells express the PCP ligand Wnt11 (Supplementary Fig. 4a-c), which is known to localize at cell-cell contacts to promote Wnt/PCP signalling and CIL between NC35, 36. Blocking Wnt11 in NC cells using a dominant negative form is sufficient to randomize the response of placode cells to a collision with NC cells in vitro (Fig. 6b,c, Supplementary Movie 13). We then analysed a possible link between N-Cadherin and Wnt/PCP and find that while cell-cell contacts are required for PCP signalling, they are not sufficient to trigger it (Supplementary Fig. 4d-m).
These results show that placode cells are repolarized by N-Cadherin-Wnt/PCP-dependent CIL when colliding with NC suggesting that CIL causes placode cell movement away from NC cells during the “chase-and-run” behaviour.
To test this possibility we performed “chase-and-run” assays and analyzed the effect of blocking N-Cadherin and Wnt/PCP (Fig. 6j, Supplementary Movie 14). Both treatments dramatically impair the “chase-and-run” behaviour (Fig. 6j, DshDep+, NCD2). Inhibition of N-Cadherin or Wnt/PCP leads to invasion of placode cells by NC cells as evidenced by the increased overlap between both cell populations (Fig. 6k). Blocking N-Cadherin and Wnt/PCP also abolishes the overall response of placodes to NC cells. Placodes move randomly (Fig. 6j, displacement maps), with reduced directionality (Fig. 6l) and do not escape from NC cells (Fig. 6m). Blocking E-Cadherin, however has no impact on NC-placode interactions (Fig. 6j-m, green bars). These data show that coordinated migration of NC and placode cells relies on CIL mediated by N-Cadherin and Wnt/PCP.
Moreover, our data indicate that both chemotaxis and CIL are required for coordinated migration to emerge. Since NC cells have CIL for each other, we tested whether overexpression of Sdf1 in one NC explant co-cultured with a control NC explant reproduces the chase-and-run behaviour (Fig. 6n-s, Supplementary Movie 15). While control NC cells remain in close proximity and progressively disperse (Fig. 6n,p,q), Sdf1 overexpression in one of the NC explants sustains coordinated migration of both groups for several hours (Fig. 6o,r,s) in a behaviour akin to NC-placode interaction.
Chase-and-run is required in vivo for neural crest migration and placode patterning
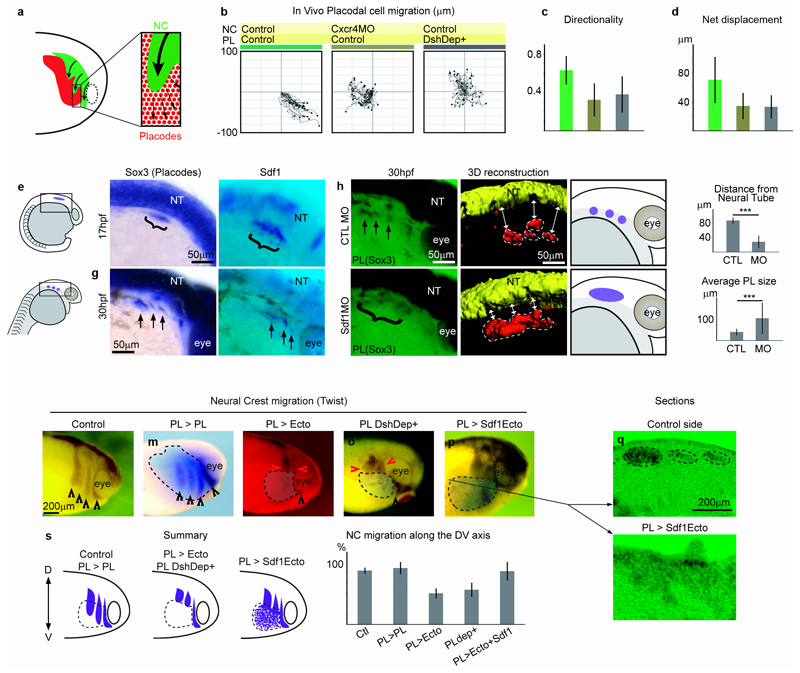
To test the importance of the NC-placode interaction in vivo, we performed time-lapse movies of placode cells in control conditions (Fig. 7a,b) and after blocking Sdf1 chemotaxis in NC cells (Fig. 7b, Cxcr4MO) or Wnt/PCP in placode cells (Fig. 7b, DshDep+). Cell tracking (Fig. 7b) shows that, while control cells undergo directional migration, this is abolished under experimental conditions as seen by a loss of directionality (Fig. 7c, Supplementary Movie 16) and lower net displacement (Fig. 7d). Placode cells later segregate into discrete domains9, 37; inhibition of their directional migration prevents this segregation and the formation of discrete placodes (Supplementary Fig. 5). To confirm that the interdependence of NC and placodes is not Xenopus-specific, we turned to zebrafish (Fig. 7e-k). Sdf1 expressed by the pharyngeal arch endoderm is known to drive late phases of cranial NC cell migration, when these cells colonize the ventral-most region of the face18. Like in Xenopus, Sdf1 is expressed in the pre-placodal region located at the border of the neural plate before the onset of NC cell migration as shown by the co-expression of the pre-placodal marker Sox3 and Sdf1 (Fig. 7f, parentheses). Later Sdf1 is found in small discrete domains corresponding to individual placodes (Fig. 7g, arrows). Normal segregation of placodes is observed in embryos injected with a control MO (Fig. 7h, arrows), but this is impaired in embryos injected with Sdf1 MO18. Placode cells remain in a broad domain with no apparent boundaries (Fig. 7i, parentheses) as clearly visible in a 3D reconstruction of Sox3+ placode region obtained from a confocal stack (Fig. 7h,i, Supplementary Movie 17). Importantly, in embryos injected with Sdf1MO the placodal region is located in more dorsally, close to the neural tube when compared to controls (Fig. 7j) indicating that ventral placode cell movements are disrupted. In addition, the placode region is enlarged when compared to individual placodes observed in controls (Fig. 7k) confirming the lack of subdivision.
Figure 7. Interaction between NC and Placodes via CIL and chemotaxis is required for placode and Neural Crest migration in vivo.
(a-b) Cell tracking analysis of placodal cells in vivo in controls, after inhibition of chemotaxis in NC cells (Cxcr4MO) or Wnt/PCP in placodal cells (DshDep+) from 3 independent experiments. (c-d) Directionality, (One-way ANOVA: P<0.0001, individual comparisons, **, p<0.01; error bars: sd) and net displacement (One-way ANOVA: P<0.0001, individual comparisons, **, p<0.01; error bars: sd) of placodal cells extracted from the tracks shown in b. (e-k) Zebrafish embryos. (e) Diagrams of the two stages of zebrafish development shown hereafter. (f-g) Sdf1 is expressed in placodal cells (Sox3). (h-i) Placodal cell distribution in an embryo injected with a control MO (h) or Sdf1MO (i) to block NC cell migration (14 animals analyzed, 65% showed a fusion of Placodes). A 3D reconstruction of Sox3 staining in h and i is provided and summarized in diagram. Dotted lines indicate the placodes. White arrows highlight the distance between the placodes and the neural tube. (j) Distance between placodal cells and the neural tube, 19 animals from 3 independent experiments were analyzed; Student’s T-test (two-tailed): ***, p= 9×10⁻⁷; errors bars: sd. (k) Average size of the individual placodal domains, 42 animals from 3 independent experiments were analyzed; ***, Student’s T-test (two-tailed): p= 0.0023; errors bars: sd. (l-t) NC cell migration after interfering with placodes. (l) Control embryo provided for reference. (m) A homotypic, homochronic graft of control placodes. (n) Placodes replaced by a non-placodal Sdf1-negative ectoderm. (o) Placodes replaced by placodes expressing Dsh-Dep+. (p) Placodes replaced by a non-placodal Sdf1-positive ectoderm. Black arrowheads indicate the NC streams migrating normally, the red arrowheads mark NC stream that stopped prematurely. (q-r) Sections of an embryo with a graft similar to that presented in p. (s) Summary of the different treatments presented in l-p. (t) Ratio of NC migration along the dorso-ventral axis on the grafted side versus the control side for l-p, 44 animals from 3 independent experiments were analyzed; one-way ANOVA: P<0.0001; all conditions compared to the first column; **, p<0.01; errors bars: sd.
Finally, since interfering with CIL in placodal cells affected NC cell invasion (See Fig. 6j-m), whereas blocking chemotaxis abolished directional NC migration (See Fig. 2), we analyzed the consequence of both treatments on NC migration in vivo using different strategies. Control embryos or embryos with a homotypic-homochronic graft of control placodes show normal NC migration (Fig. 7l-m). In contrast, when placodes are replaced by a non-placodal Sdf1-negative ectoderm (Fig. 7n) or by placodes expressing Dsh-Dep+ (Fig. 7o) NC migration was clearly inhibited (Fig. 7s, t). When placodes are replaced by non-placodal Sdf1-positive ectoderm, NC cells migrate ventrally but are not organized into streams (Fig. 7p-t). These results show that CIL between NC and placodal cells favours directional NC cell migration in vivo. However, in absence of chemotaxis, CIL does not promote NC cell migration whereas chemotaxis in absence of CIL is not sufficient to pattern NC migration.
Discussion
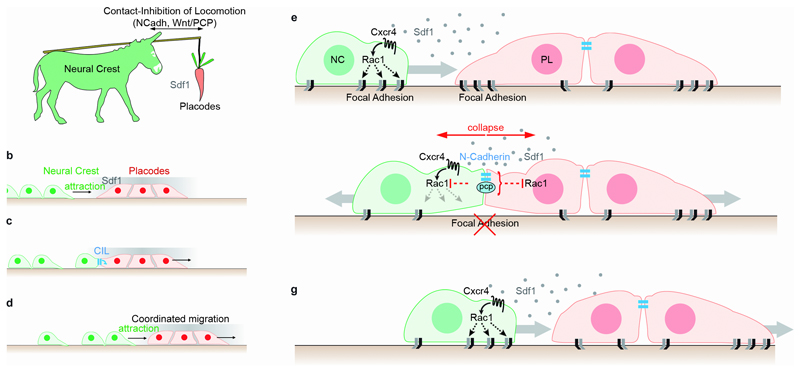
Our results show that NC cells “chase” placode cells by chemotaxis in an SDF1 dependent manner, while placodal cells “run” as they are contacted by NC, in a mechanism that involves PCP and N-Cadherin signalling. This interdependence between NC and placode cells is reminiscent of the popular image of the donkey and a carrot (Fig. 8a). Placodes produce a NC cell chemoattractant (Fig. 8b). Physical NC-placode contact directly controls the direction of placodal cell displacement by locally inhibiting cell protrusions (Fig. 8c). In turn, the escape or “run” behaviour prolongs the directional motion of NC cells by displacing the source of the attractant (Fig. 8d). This phenomenon relies on N-Cadherin and Wnt/PCP most probably by inhibiting Rac1 (Fig. 8e-g) and locally increasing RhoA activity20, 28. This is a highly original mechanism that ensures a persistent directional migration, that depends upon the source of the chemoattractant (placodes) being modified by the attracted cells (NC).
Figure 8. Contact-Inhibition of Locomotion and Chemotaxis between NC and placodal cells drives coordinated migration of both cell populations.
(a) The overall behaviour of NC and placodal cells is reminiscent of the popular image of the donkey and the carrot where the donkey (NC) is attracted to the carrot (placodes) but the carrot moves away because of the donkey’s progression. (b) NC cells are attracted to placodal cells due to Sdf1-dependent chemotaxis. (c) Contact between NC and placodal cells induces CIL. Protrusions are inhibited in placodal cells at the region of contact with NC cells. This breaks the symmetry of the placodal tissue thus promoting directional movement. (d) The system self-sustains due to chemotaxis and CIL. Sdf1 gradient is shown as shades of grey. NC cells are in green, placodal cells are in red. (e-g) Molecular pathways involved in the chase-and-run between NC and placodes. (e) Sdf1 released by the placodes acts on NC cells promoting an increase in Rac activity, which stabilizes protrusions and focal adhesions. NC moves towards placodes (grey arrow). (f) NC moves forward contacting placode cells and triggering a CIL response in both cell types. A transient cell junction complex is formed (blue), which together with PCP signalling (grey) inhibit Rac activity at the cell contact, leading to collapse of cell protrusions and disassembly of focal adhesions. This localized response within the placode cluster generates an asymmetry which leads to directional migration of the cluster away from NC (grey arrow from placodes). (g) During this “run” phase placodes continue secreting Sdf1 which will attract NC cells (grey arrow from NC), with the consequent coordinated migration of both cell populations.
The “run” phase during the “chase-and-run” behaviour corresponds to the collective migration of a placode cluster, reminiscent of the migration of Drosophila border and zebrafish lateral line cells24, 25. It is well known that cell protrusions like lamellipodia play an important role in establishing the directionality in single cells as well as in collective cell migration2, 38–40. However, our findings show that unlike border or lateral line cells, placodes move forward not by stabilizing protrusions at the front, but by collapsing protrusions at the back of the cluster.
In Xenopus, local rearrangements of placode cells without large-scale cell migration41 have been described previously and we confirm this finding. However, our data demonstrate that placode cells in the pre-placodal domain move actively, although on a local scale, to form discrete subpopulations. Similar placode cell movements have been described in chick42 but their dependence on NC migration has not been studied. The influence of NC cells on placodal cell migration is clearly temporally restricted: at later stages placode assembly is independent of NC cell migration11, 14. Our observations in Xenopus and zebrafish, together with data published elsewhere43, 44, call for the analysis of placode segregation after inhibition of NC cell migration in amniotes. Furthermore, placode cells not only move away from NC cells but simultaneously reorganize into multilayered structures suggesting that these two events may be linked. Thus, the aggregation of pre-placodal cells into discrete placodes may be controlled by NC cells based on a “chase-and-run” behaviour. Although we here focused on precursors for epibranchial placodes, a similar aggregation process is observed for other placodes in the proximity of neural crest cells9, 10.
In summary, we describe a mechanism that controls the coordinated behaviour of different cell populations. The same “chase-and-run” behaviour may represent a more general mechanism to explain the coordinated migration of cells with different properties, from embryo development to cancer metastasis.
Supplementary Material
Acknowledgments
We thank Lorena Marchant for the experiments shown in Supplementary Fig. 2h-i. We are grateful to Nicolas David for the zebrafish Sdf1 morpholino and to Gerhard Schlosser for the Xenopus Eya1 morpholino. We thank G. Schlosser, C. Stern, B. Stramer, L. Cramer, B. Baum, M. Tada and all members of RM laboratory for comments on the manuscript. This study was supported by grants from MRC and BBSRC to R.M., from Wellcome Trust to A.S. and R.M., from the Spanish Ministry for Economy and Competitiveness (BFU2012-38146 and BFU2009-07595), and the European Research Council (Grant Agreement 242993) to X.T. and the Wellcome Trust Value in People Award to E.T.; E.S. is the recipient of a Wellcome Trust PhD fellowship.
Footnotes
Author Contributions
Experiments were designed by E.T., B.S. and R.M., with the participation of X.T and A.S. All experiments were performed in R.M. laboratory. E.T and B.S. performed most of the experiments. E.S. performed the repolarization and clustering assays. S.G., E. T. and X.T. performed the traction forces experiments. E.T., B.S. and R.M. analysed and interpreted data, with the participation of X.T. and A.S. E.T., B.S., A.S. and R.M. wrote the manuscript. All authors commented on the manuscript.
Competing Financial Interests
The authors declare no competing financial interests.
References
- 1.Aman A, Piotrowski T. Cell migration during morphogenesis. Dev Biol. 2010;341:20–33. doi: 10.1016/j.ydbio.2009.11.014. [DOI] [PubMed] [Google Scholar]
- 2.Friedl P, Gilmour D. Collective cell migration in morphogenesis, regeneration and cancer. Nat Rev Mol Cell Biol. 2009;10:445–457. doi: 10.1038/nrm2720. [DOI] [PubMed] [Google Scholar]
- 3.Aman A, Piotrowski T. Cell migration during morphogenesis. Dev Biol. 2009;341:20–33. doi: 10.1016/j.ydbio.2009.11.014. [DOI] [PubMed] [Google Scholar]
- 4.Tsuji T, Ibaragi S, Hu GF. Epithelial-mesenchymal transition and cell cooperativity in metastasis. Cancer Res. 2009;69:7135–7139. doi: 10.1158/0008-5472.CAN-09-1618. [DOI] [PMC free article] [PubMed] [Google Scholar]
- 5.Le Douarin N, Kalcheim C. The neural crest. Edn 2nd. Cambridge University Press; Cambridge, UK: New York, NY, USA: 1999. [Google Scholar]
- 6.Hall B. The neural crest and neural crest cells in vertebrate development and evolution. Edn 2nd. Springer; New York: 2008. [Google Scholar]
- 7.Theveneau E, Mayor R. Neural crest delamination and migration: From epithelium-to-mesenchyme transition to collective cell migration. Dev Biol. 2012 doi: 10.1016/j.ydbio.2011.12.041. [DOI] [PubMed] [Google Scholar]
- 8.Theveneau E, Mayor R. Can mesenchymal cells undergo collective cell migration? The case of the neural crest. Cell Adh Migr. 2011;5:490–498. doi: 10.4161/cam.5.6.18623. [DOI] [PMC free article] [PubMed] [Google Scholar]
- 9.Schlosser G. Making senses development of vertebrate cranial placodes. Int Rev Cell Mol Biol. 2010;283:129–234. doi: 10.1016/S1937-6448(10)83004-7. [DOI] [PubMed] [Google Scholar]
- 10.Streit A. StemBook. The Stem Cell Research Community, StemBook; 2008. The cranial sensory nervous system: specification of sensory progenitors and placodes. [PubMed] [Google Scholar]
- 11.Coppola E, et al. Epibranchial ganglia orchestrate the development of the cranial neurogenic crest. Proc Natl Acad Sci U S A. 2010;107:2066–2071. doi: 10.1073/pnas.0910213107. [DOI] [PMC free article] [PubMed] [Google Scholar]
- 12.Gans C, Northcutt RG. Neural crest and the origin of vertebrates: a new head. Science. 1983;220:268–273. doi: 10.1126/science.220.4594.268. [DOI] [PubMed] [Google Scholar]
- 13.D’Amico-Martel A, Noden DM. Contributions of placodal and neural crest cells to avian cranial peripheral ganglia. Am J Anat. 1983;166:445–468. doi: 10.1002/aja.1001660406. [DOI] [PubMed] [Google Scholar]
- 14.Begbie J, Graham A. Integration between the epibranchial placodes and the hindbrain. Science. 2001;294:595–598. doi: 10.1126/science.1062028. [DOI] [PubMed] [Google Scholar]
- 15.Gaggioli C, et al. Fibroblast-led collective invasion of carcinoma cells with differing roles for RhoGTPases in leading and following cells. Nat Cell Biol. 2007;9:1392–1400. doi: 10.1038/ncb1658. [DOI] [PubMed] [Google Scholar]
- 16.Belmadani A, et al. The chemokine stromal cell-derived factor-1 regulates the migration of sensory neuron progenitors. J Neurosci. 2005;25:3995–4003. doi: 10.1523/JNEUROSCI.4631-04.2005. [DOI] [PMC free article] [PubMed] [Google Scholar]
- 17.Belmadani A, Jung H, Ren D, Miller RJ. The chemokine SDF-1/CXCL12 regulates the migration of melanocyte progenitors in mouse hair follicles. Differentiation. 2009;77:395–411. doi: 10.1016/j.diff.2008.10.015. [DOI] [PMC free article] [PubMed] [Google Scholar]
- 18.Olesnicky Killian EC, Birkholz DA, Artinger KB. A role for chemokine signaling in neural crest cell migration and craniofacial development. Dev Biol. 2009;333:161–172. doi: 10.1016/j.ydbio.2009.06.031. [DOI] [PMC free article] [PubMed] [Google Scholar]
- 19.Kasemeier-Kulesa JC, McLennan R, Romine MH, Kulesa PM, Lefcort F. CXCR4 controls ventral migration of sympathetic precursor cells. J Neurosci. 2010;30:13078–13088. doi: 10.1523/JNEUROSCI.0892-10.2010. [DOI] [PMC free article] [PubMed] [Google Scholar]
- 20.Theveneau E, et al. Collective chemotaxis requires contact-dependent cell polarity. Dev Cell. 2010;19:39–53. doi: 10.1016/j.devcel.2010.06.012. [DOI] [PMC free article] [PubMed] [Google Scholar]
- 21.Schlosser G, et al. Eya1 and Six1 promote neurogenesis in the cranial placodes in a SoxB1-dependent fashion. Dev Biol. 2008;320:199–214. doi: 10.1016/j.ydbio.2008.05.523. [DOI] [PMC free article] [PubMed] [Google Scholar]
- 22.Tambe DT, et al. Collective cell guidance by cooperative intercellular forces. Nat Mater. 2011;10:469–475. doi: 10.1038/nmat3025. [DOI] [PMC free article] [PubMed] [Google Scholar]
- 23.Trichet L, et al. Evidence of a large-scale mechanosensing mechanism for cellular adaptation to substrate stiffness. Proc Natl Acad Sci U S A. 2012;109:6933–6938. doi: 10.1073/pnas.1117810109. [DOI] [PMC free article] [PubMed] [Google Scholar]
- 24.Montell DJ. Command and control: regulatory pathways controlling invasive behavior of the border cells. Mech Dev. 2001;105:19–25. doi: 10.1016/s0925-4773(01)00393-8. [DOI] [PubMed] [Google Scholar]
- 25.Sarrazin AF, et al. Origin and early development of the posterior lateral line system of zebrafish. J Neurosci. 2010;30:8234–8244. doi: 10.1523/JNEUROSCI.5137-09.2010. [DOI] [PMC free article] [PubMed] [Google Scholar]
- 26.Abercrombie M, Heaysman JE. Observations on the social behaviour of cells in tissue culture. I. Speed of movement of chick heart fibroblasts in relation to their mutual contacts. Exp Cell Res. 1953;5:111–131. doi: 10.1016/0014-4827(53)90098-6. [DOI] [PubMed] [Google Scholar]
- 27.Abercrombie M, Dunn GA. Adhesions of fibroblasts to substratum during contact inhibition observed by interference reflection microscopy. Exp Cell Res. 1975;92:57–62. doi: 10.1016/0014-4827(75)90636-9. [DOI] [PubMed] [Google Scholar]
- 28.Carmona-Fontaine C, et al. Contact inhibition of locomotion in vivo controls neural crest directional migration. Nature. 2008;456:957–961. doi: 10.1038/nature07441. [DOI] [PMC free article] [PubMed] [Google Scholar]
- 29.Banerjee S, et al. A novel role for MuSK and non-canonical Wnt signaling during segmental neural crest cell migration. Development. 2011;138:3287–3296. doi: 10.1242/dev.067306. [DOI] [PMC free article] [PubMed] [Google Scholar]
- 30.Carmona-Fontaine C, Matthews H, Mayor R. Directional cell migration in vivo: Wnt at the crest. Cell Adh Migr. 2008;2:240–242. doi: 10.4161/cam.2.4.6747. [DOI] [PMC free article] [PubMed] [Google Scholar]
- 31.De Calisto J, Araya C, Marchant L, Riaz CF, Mayor R. Essential role of non-canonical Wnt signalling in neural crest migration. Development. 2005;132:2587–2597. doi: 10.1242/dev.01857. [DOI] [PubMed] [Google Scholar]
- 32.Matthews HK, et al. Directional migration of neural crest cells in vivo is regulated by Syndecan-4/Rac1 and non-canonical Wnt signaling/RhoA. Development. 2008;135:1771–1780. doi: 10.1242/dev.017350. [DOI] [PubMed] [Google Scholar]
- 33.Rios AC, Serralbo O, Salgado D, Marcelle C. Neural crest regulates myogenesis through the transient activation of NOTCH. Nature. 2011 doi: 10.1038/nature09970. [DOI] [PubMed] [Google Scholar]
- 34.Shi DL, Boucaut JC. Xenopus frizzled 4 is a maternal mRNA and its zygotic expression is localized to the neuroectoderm and trunk lateral plate mesoderm. Mech Dev. 2000;94:243–245. doi: 10.1016/s0925-4773(00)00294-x. [DOI] [PubMed] [Google Scholar]
- 35.Witzel S, Zimyanin V, Carreira-Barbosa F, Tada M, Heisenberg CP. Wnt11 controls cell contact persistence by local accumulation of Frizzled 7 at the plasma membrane. J Cell Biol. 2006;175:791–802. doi: 10.1083/jcb.200606017. [DOI] [PMC free article] [PubMed] [Google Scholar]
- 36.Ulrich F, et al. Wnt11 functions in gastrulation by controlling cell cohesion through Rab5c and E-cadherin. Dev Cell. 2005;9:555–564. doi: 10.1016/j.devcel.2005.08.011. [DOI] [PubMed] [Google Scholar]
- 37.Streit A. The preplacodal region: an ectodermal domain with multipotential progenitors that contribute to sense organs and cranial sensory ganglia. Int J Dev Biol. 2007;51:447–461. doi: 10.1387/ijdb.072327as. [DOI] [PubMed] [Google Scholar]
- 38.Ridley AJ, et al. Cell migration: integrating signals from front to back. Science. 2003;302:1704–1709. doi: 10.1126/science.1092053. [DOI] [PubMed] [Google Scholar]
- 39.Friedl P, Wolf K. Plasticity of cell migration: a multiscale tuning model. J Cell Biol. 2009;188:11–19. doi: 10.1083/jcb.200909003. [DOI] [PMC free article] [PubMed] [Google Scholar]
- 40.Rorth P. Collective cell migration. Annu Rev Cell Dev Biol. 2009;25:407–429. doi: 10.1146/annurev.cellbio.042308.113231. [DOI] [PubMed] [Google Scholar]
- 41.Pieper M, Eagleson GW, Wosniok W, Schlosser G. Origin and segregation of cranial placodes in Xenopus laevis. Dev Biol. 360:257–275. doi: 10.1016/j.ydbio.2011.09.024. [DOI] [PubMed] [Google Scholar]
- 42.Streit A. Extensive cell movements accompany formation of the otic placode. Dev Biol. 2002;249:237–254. doi: 10.1006/dbio.2002.0739. [DOI] [PubMed] [Google Scholar]
- 43.Bhat N, Riley BB. Integrin-alpha5 coordinates assembly of posterior cranial placodes in zebrafish and enhances Fgf-dependent regulation of otic/epibranchial cells. PLoS One. 2011;6:e27778. doi: 10.1371/journal.pone.0027778. [DOI] [PMC free article] [PubMed] [Google Scholar]
- 44.Culbertson MD, Lewis ZR, Nechiporuk AV. Chondrogenic and gliogenic subpopulations of neural crest play distinct roles during the assembly of epibranchial ganglia. PLoS One. 2011;6:e24443. doi: 10.1371/journal.pone.0024443. [DOI] [PMC free article] [PubMed] [Google Scholar]
Associated Data
This section collects any data citations, data availability statements, or supplementary materials included in this article.


