

ABSTRACT
Background: Lung cancer is the most common cancer that is caused by perturbation of regulatory pathways rather than dysfunction of a single gene. Cisplatin (CDDP; cis-diamminedichloroplatinum II) is the first member of a class of platinum-containing anti-cancer medication, which binds to DNA and triggers apoptosis. CDDP-based chemotherapy is used to treat various types of cancers. However, the efficacy of CDDP in the treatment of non-small-cell lung cancer (NSCLC) is limited by acquired drug resistance. MicroRNAs have recently emerged as key regulators of cancers, and miR-26a is one of down-regulated miRNAs in A549/CDDPres cell line. This study aimed to investigate the role of miR-26a in CDDP resistance in NSCLC as well as the underlying mechanisms.
Methods: In this study, we analyzed expressional profiles of CDDP resistance-related mRNA, miRNA, and transcription factors (TF) that regulate miRNA expression in NSCLC. A549 cells were treated with CDDP, miR-26a mimic, or miR-26a inhibitor, and followed by biological analysis including drug sensitivity assay, colony formation assay, terminal-deoxynucleoitidyl Transferase Mediated Nick End Labeling (TUNEL) assay, and cell cycle analysis. Luciferase assay was used to determine the target of miR-26a. The regulation of miR-26a in Akt pathway was measured by western blot.
Results: High mobility group A (HMGA) 2 was identified as the target of miR-26a. Overexpression of miR-26a in A549 cells inhibited G1-S transition, increased cell death in response to CDDP treatment, and decreased the colony formation of A549 cells. MiR-26a significantly decreased the expression of E2F1, diminished Akt phosphorylation, and downregulated Bcl2 expression. Cell growth was suppressed by inhibiting HMGA2-mediated E2F1-Akt pathway.
Conclusion: MiR-26a is responsible for A549 cell sensitivity in the treatment of CDDP through regulating HMGA2-mediated E2F1-Akt pathway.
KEYWORDS: Cisplatin resistance, E2F1, HMGA2, miR-26a, non-small-cell lung cancer
Introduction
Lung cancer is one of the most common type of cancer worldwide and the leading cause of cancer-related mortality.1 Non-small-cell lung cancer (NSCLC) accounts for ∼85% of all lung cancer cases.2 Currently, the most effective therapy for NSCLC is complete lung resection. However, the survival rate after surgery is not satisfactory. Thusly, cisplatin (cis-diamminedichloroplatinum II, CDDP)-based chemotherapy, which is primarily effective through DNA-damage,3 is widely used as an important alternative. Although target gene therapy drugs, such as erlotinib and cetuximab, can also increase the overall survival rate of NSCLC patients, CDDP based chemotherapy remains the most important treatment for NSCLC patients, especially in advanced cases.4
However, the ability of cancer cells to become resistant to CDDP remains a significant impediment to successful chemotherapy. The mechanism of CDDP resistance is complicated5 and remains to be fully addressed.
MiRNAs are a class of small non-coding RNAs that are 19 to 24 nucleotides in length and function as regulators of gene expression. Most miRNA is thought to play a role in the post-transcriptional regulation of hundreds of genes, and translational blockade of a given gene may require binding of multiple miRNAs.6 It is estimated that one-third of all genes in the human genome are regulated by miRNAs.7 To date, about 1800 human miRNAs have been identified (miRBase Release 21.0, http://www.mirbase.org/),8 including many that participate in key cellular processes, such as apoptosis, proliferation, and differentiation.9 MiRNA misexpressions or mutations result in a gain or loss of miRNA function, resulting in the down- or up-regulation of the target protein. More importantly, the successful use of antagomirs to silence miRNAs in mice10 and nonhuman primates11 suggests the possible therapeutic use of miRNAs. Recently, miRNAs have been identified as oncogenes or tumor suppressors and play a role in drug resistance.12,13 For instance, miR-141 enhances cisplatin resistance through repressing KEAP1 in ovarian cancer cells,14 and miR-106a induces multidrug resistance by targeting RUNX3 in gastric cancer.15 On the contrary, miR-200b and miR-15b reverse chemotherapy induced epithelial-mesenchymal transition (EMT) in human tongue cancer cells by targeting BMI1.16
We have previously identified an A549/CDDPres cell line that is resistant to CDDP and found that a series of miRNAs and mRNAs in these CDDP resistant cells are expressed differently from those in the parental A549 cells.17 In this study, we aimed to identify active transcriptional and posttranscriptional regulatory pathways in NSCLC based on CDDP resistance-related expression profiles of mRNA and miRNA as well as regulation of miRNA and transcription factors (TF). In addition, by using breadth-first-search (BFS) approach, we found a potential active TF-miRNA regulatory pathway that may contain non-differentially expressed (DE) genes. Finally, we verified the effect of miRNA-26a on CDDP resistance in A549 cell line. This study provides a novel insight into the mechanisms of CDDP resistance in NSCLC.
Results
The active TF-miRNA regulatory pathways in CDDP resistance
Based on the established TF-miRNA regulatory networks that are listed in the 5 databases (TRANSFAC, TransmiR, miRTarBase, miRecords, and TarBase)18 and using random variance model (RVM) t-test, we identified 1741 differentially expressed mRNA probes and 29 differentially expressed miRNAs at the P level of 0.05. We mapped these 1741 mRNAs and 29 miRNAs to construct the potential active TF-miRNA regulatory subnetwork. We then used the breadth first-search (BFS) approach to find all of the directed pathways from 0-indegree nodes to 0-outdegree nodes in the potential active TF-miRNA regulatory subnetwork. Furthermore, we selected 974 known CDDP-associated genes from the GeneCards database19 and 38 known CDDP associated miRNAs from the HMDD database20 and miR2Disease database21 to evaluate the significance of the potential active pathways. Fig. 1 shows a model that demonstrates the active pathways derived from hypergeometric test.
Figure 1.
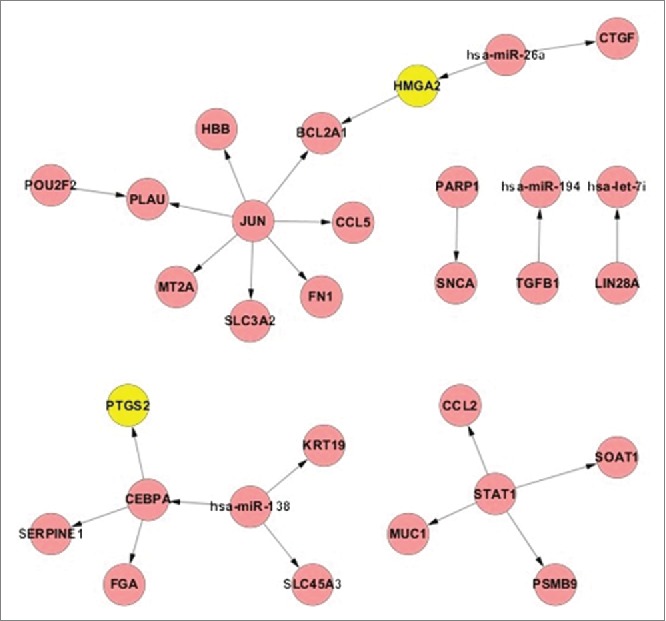
The union of active TF-miRNA regulatory pathway in CDDP resistance. Yellow nodes represent the known CDDP associated genes and red nodes represent the direct curated genes.
The role of HMGA2 and miR-26a in lung cancer
Fig. 1 suggests that High mobility group A (HMGA) 2, a known CDDP associated TF, plays an important role in CDDP resistance in NSCLC. The role of HMGA2 in lung cancer prognosis was evaluated in lung adenocarcinoma patients, who were treated with CDDP based chemotherapy. To more accurately test the correlation between HMGA2 level and the patients' survival rate, we applied published microarray data22 in GEO database (GSE36471) and calculated the Kaplan–Meier survival curve by DRUGSURV.23 The results showed that patients with higher levels of HMGA2 expression had significantly lower survival probability than those with lower levels of HMGA2 expression (Fig. 2A). This finding led us to focus our study on the role of the miR-26a-HMGA2-Bcl2 pathway in CDDP resistance. To explore the role of miR-26a and HMGA2 in A549 cells with different CDDP resistant characteristics, we measured expression of miR-26a and HMGA2 in parental A549 cells and A549/CDDPres cells, and self-cultured A549/CDDPres cells that can sustain in 0.5, 1.0, and 1.5 mg/L of CDDP, respectively. Fig. 2B shows that miR-26a expression in A549/CDDPres cells is lower than that that in A549 cells (P<0.01); and Fig. 2C presents higher levels of HMGA2 in A549/CDDPres cells than that in A549 cells.
Figure 2.
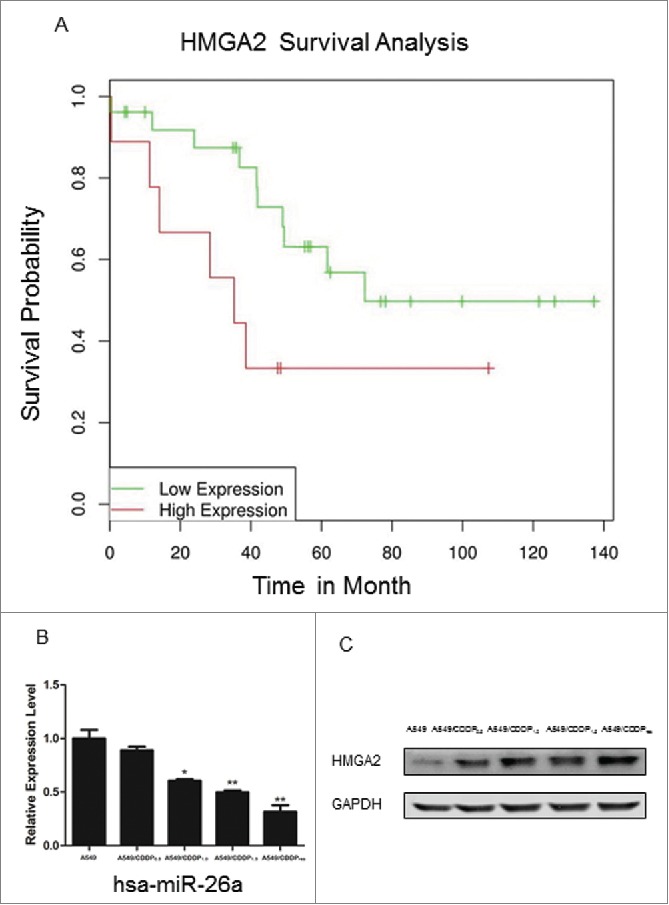
Role of HMGA2 and miR-26a in lung cancer. (A) Kaplan–Meier survival analysis of lung adenocarcinoma patients with high or low HMGA2 expression (N=35). The results shows that the patients with low HMGA2 exhibited significantly longer overall survival (OS) (log-rank test, P=0.03). (B) Validation of miR-26a expression in A549 versus A549/CDDPres by realtime RT-PCR. The relative amount of miR-26a was normalized to U6 snRNA. (C) Validation of HMGA2 expression in A549 vs. A549/CDDPres by Western blot. The relative amount of HMGA2 was normalized with GAPDH. Data in histograms are means ± SD, **P<0.01 compared with A549 (t test).
MiR-26a directly targets HMGA2 in NSCLC cells
The analysis using algorithm TargetScan24 suggested that HMGA2 mRNA is the target of miR-26a (Fig. 3A). Both real-time RT-PCR and Western blotting analysis showed that ectopic expression of miR-26a markedly decreased HMGA2 expression in A549 at RNA and protein levels, respectively; whereas, inhibition of miR-26a increased HMGA2 expression (Fig. 3B and 3C). To test whether HMGA2 directly associates with miR-26a, a 3′UTR reporter of HMGA2, as illustrated in Fig. 3D, and miR-26a mimics were co-transfected into A549 cells using the DharmaFECT reagent. When the plasmid associates with miRNA, the 3′UTR reporter will be unlinked and the RenSP luciferase reporter gene will be released to react with its substrate. The RenSP luciferase level measured by luminometer showed that miR-26a mimics bind with HMGA2 in a dose-dependent manner (Fig. 3E); further suggesting that HMGA2 is a target of miR-26a.
Figure 3.
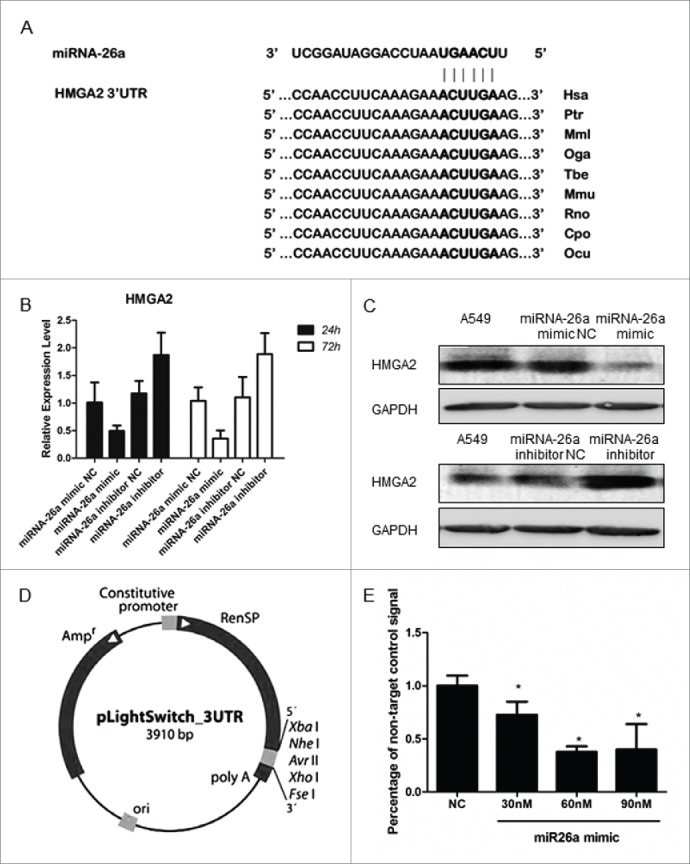
miR-26a directly targets HMGA2 in NSCLC cells. (A) Predicted miR-26a target sequence in the 3′ UTR of HMGA2. (B) Realtime PCR and western blotting analysis of HMGA2 expression in A549 cells transfected with miR-26a mimic or the miR-26a inhibitor, GAPDH served as the loading control. (C) 3′ UTR reporter vector model. The LightSwitch 3´UTR Reporter vector contains a 3124 bp human HMGA2 3´UTR sequence cloned downstream of the RenSP luciferase gene in the pLightSwitch_3UTR reporter vector. A constitutive promoter drives expression of the hybrid RenSP- 3´UTR transcript. (D) Luciferase reporter assay of the A549 cells transfected with the HMGA2–3′ UTR reporter and increasing amounts (30, 60, 90 nM) of miR-329 mimics. Bars represent the mean ± SD of 3 independent experiments. * P<0.05.
Overexpression of miR-26a reduces CDDP resistance in NSCLC
To confirm the role of miR-26a in the development of CDDP resistance in NSCLC, we examined the effect of over-expressed miR-26a on IC50 of A549/CDDPres. A methyl thiazolyl tetrazolium (MTT) assay showed that upregulated miR-26a significantly increased the inhibition rate of A549/CDDPres cells treated with a variety of concentrations of CDDP (Fig. 4A). We found that overexpression of miR-26a in A549 cells significantly suppressed the cells' colony formation ability after treatment of CDDP at 10mg/L for 48 h, as shown by decreased colony numbers and sizes (Fig. 4B). These results suggested that upregulated miR-26a inhibits A549 cell proliferation in vitro. Using terminal-deoxynucleoitidyl Transferase Mediated Nick End Labeling (TUNEL) assay, we found that overexpression of miR-26a in A549 cells markedly increased cell death in response to CDDP treatment (Fig. 4C). Furthermore, flow cytometry analysis showed that miR-26a overexpression significantly decreased the percentage of the cells in S phase and increased the percentage of the cells in G1/G0 phase (Fig. 4D). This result suggests that miR-26a induces G1-S arrest and counters CDDP resistance in NSCLC.
Figure 4.

miR-26a overexpression reduces CDDP resistance in NSCLC. (A) Drug sensitivity assays revealed that upregulation of miR-26a decrease IC50 of A549/CDDPres to CDDP. (B) Representative micrographs and quantification of crystal violet stained cell colonies. (C) Flow cytometric analysis for TUNEL assay of A549 cells transfected with NC or miR-26a mimics. Each bar represents the mean of 3 independent experiments. (D) Cell cycle analysis of A549 cells transfected with NC or miR-26a mimics. Each bar represents the mean of 3 independent experiments. * P< 0.05.
Inhibition of miR-26a increases CDDP resistance in NSCLC
We further examined the effect of miR-26a inhibition on CDDP resistance in NSCLC. Consistent with the results shown in Fig. 4, MTT assay showed that inhibition of miR-26a dramatically increased the IC50 of A549 cells in response to CDDP as compared with that of control cells transfected with negative control plasmid (Fig. 5A). In addition, inhibition of miR-26a significantly increased the colony formation ability of A549 cells in response to CDDP (Fig. 5B). The cell death rate detected by TUNEL assay showed that inhibition of miR-26a also reduced A549 cell death after the treatment of CDDP (Fig. 5C). Furthermore, miR-26a inhibitor significantly increased the percentage of the cells in S phase and decreased the percentage of cells in G0/G1 phase (Fig. 5D). These results suggest that miR-26a acting through regulating cell G1-S transition influences NSCLC resistance to CDDP.
Figure 5.

miR-26a inhibition increase CDDP resistance in NSCLC. (A) Drug sensitivity assays revealed that downregulation of miR-26a increase IC50 of A549 to CDDP. (B) Representative micrographs and quantification of crystal violet stained cell colonies. (C) Flow cytometric analysis for TUNEL assay of A549 cells transfected with NC or miR-26a inhibitor. Each bar represents the mean of 3 independent experiments. (D) Cell cycle analysis of A549 cells transfected with NC or miR-26a inhibitor. Each bar represents the mean of 3 independent experiments. * P< 0.05.
MiR-26a inhibits E2F1 and Akt pathway
Previous studies suggested that HMGA2 can activate E2F1 transcription.25,26 Change of miR-26a expression in A549 resulted in the changes in E2F1 mRNA level, which occurred at 48 h after transfection of hsa-miR-26a mimic or hsa-miR-26a inhibitor (Fig. 6A). Noteworthy, the changes in E2F1 mRNA started at 12 h after the alteration of HMGA2 mRNA occurred (Fig. 6A). Transfection of miR-26a mimics in A549 cells resulted in a significant decrease in E2F1 expression, Akt phosphorylation, and Bcl2 expression; whereas, transfection of miR-26a inhibitor in A549 cells led to an increase in E2F1 expression, Akt phosphorylation, and Bcl2 expression in the cells (Fig. 6B). We also analyzed the relationship between E2F1 expression and patients' prognosis based on existing data in GEO database (GSE13213),27 and found that increased E2F1 expression is associated with lower survival probability, as shown in Fig. 6C.
Figure 6.

miR-26a inhibits E2F1 and Akt pathway. (A) Real time PCR analysis of E2F1 expression in A549 cells transfected with miR-26a mimic or the miR-26a inhibitor, GAPDH served as the loading control. (B) Western blotting analysis of E2F1, phosphor-Akt and Bcl2 expression in A549 cells transfected with miR-26a mimic or the miR-26a inhibitor, GAPDH served as the loading control. (C) Kaplan-Meier survival analysis of lung adenocarcinoma patients with high or low E2F1 expression (N=113). Adenocarcinoma patients with high E2F1 exhibited significatly shorter OS (log-rank test, P = 0.0257). (D) Western blotting analysis of E2F1, phosphor-Akt and Bcl2 expression in A549 cells transfected with siRNA HMGA2, GAPDH served as the loading control.
Studies have shown that Akt kinase signaling plays an important role in regulating cell growth, survival, and apoptosis.28 E2F1 has been suggested to be able to regulate Bcl2 expression through activating Akt.29,30 To test the molecular linkage of miR-26a-HMGA2-E2F1-Akt-Bcl in the signaling pathway that regulates cell resistance to CDDP, we suppressed the expression of HMGA2 in A549 using a siRNA approach. As shown in Fig. 6D, decreased HMGA2 expression was associated with a decrease in E2F1 expression, Akt phosphorylation, and Bcl2 expression. These results indicate that miR-26a negatively regulates the Akt survival pathway through HMGA2-E2F1 signaling, and decreased expression of miR-26a plays an important role in the mechanism of CDDP resistance in NSCLC.
Discussion
The efficacy of CDDP in the treatment of NSCLC is significantly limited by acquired drug resistance. The mechanism of CDDP resistance remains unclear. The role of dysregulation of miRNAs in the development of diseases, including cancers has been reported.31 In this study, we proposed an approach to identify active TF-miRNA regulatory pathways by analyzing the profiles of regulation of CDDP resistance-related mRNA and the corresponding miRNA expression, and identified 9 active TF-miRNA regulatory pathways that were significantly related to CDDP resistance.
The key finding of the current study is that miR-26a expression was markedly down-regulated in CDDP resistant A549/CDDPres cells as compared with that in parental A549 cells. Furthermore, increased expression of miR-26a inhibited cell proliferation and ameliorated CDDP resistance in NSCLC, while miR-26a inhibition exhibited opposite effects. It has been reported that miR-26a is involved in various malignant pathological processes and acts as a tumor suppressor to inhibit tumor cell proliferation by directly targeting EZH2 in pancreatic, nasopharyngeal, breast, and lung cancer.32-35 In addition, clinical studies showed that patients with higher level of miR-26a in tumor tissues have better prognosis, possibly through the role of miR-26a in inhibition of cell proliferation via targeting cyclin D2, cyclin E2, and IL-6.36,37 Our results suggest that miR-26a acts through arresting G1-S transition to suppress A549 cell proliferation, and this effect is mediated by HMGA2-E2F1-Akt signaling pathway.
HMGA2 is a member of the HMG.38 HMGA2 protein is abundant in pluripotent embryonic stem cells and has been reported to play an important role in pituitary adenomas formation.25,39 HMGA2 acts as an activator or repressor of certain target genes through binding to specific sites at promoter regions.40 It was reported that HMGA2 binds the complex formed by pRB and HDAC1 to dissociate pRB from genomic promoter regions and promote the transcriptional activity of E2F1 by acetylation.41 In the present study, we found that HMGA2 is negatively regulated by miR-26a at the posttranscriptional level through a specific target site (nt 1867–1873) within the 3′-UTR. The negatively regulated expression of HMGA2 leads to decrease in E2F1 expression and Akt phosphorylation, and subsequent suppression of cell proliferation. These effects of HMGA2 were further confirmed by knocking down HMGA2 in A549 cells using a siRNA approach (Fig. 6D). Thus, HMGA2 is a direct and functional target of miR-26a and mediates miR-26a-suppressed CDDP resistance in A549 cells.
E2F1 is a downstream regulator controlled by the Rb pathway, which is capable of inducing cell proliferation and cell cycle progression by regulating mTORC1 activity.42-45 Our results showed that the expression of E2F1 was regulated by miR-26a and HMGA2. It has been reported that E2F1 is overexpressed in CDDP-resistant cell lines, and decreased expression of E2F1 sensitizes cancer cells to chemotherapeutic agents.46 E2F1 is known to promote cell cycle progression through regulating pRB.47,48 Therefore, downregulation of E2F1 might induce cell cycle arrest. In the current study, G1-S transition arrest was found when the E2F1 expression is inhibited. This observation demonstrates the role of E2F1 in the mechanism of CDDP resistance in NSCLC.
Akt, a key component of the pathway activated in the majority of cancers, represents a nodal point in the signaling of malignant growth. Activated Akt phosphorylates many downstream proteins that can have a multitude of effects on a cell. As one of the downstream components of E2F1, Akt also participates in the regulation of cell cycle entry mainly through phosphorylating GSK-3β. GSK-3β promotes cell cycle entry by phosphorylating Cyclin D1-Cdk4 complexes; while, activated Akt through phosphorylating GSK-3β inactivates GSK-3β.49,50 The stabilized cyclin D1 is important for regulating the G1-S transition.51 Another downstream target of Akt is MDM2, which is an inhibitor of p53.52 Thus, Akt is able to block p53 activity, causing self-sufficiency in growth signals and limitless replication potential: over activation of Akt pathway is believed to cause CDDP resistance in cancer cell.53
Bcl2 is a well-known anti-apoptotic protein and can be regulated by Akt. Bcl2 has been reported as a regulator of CDDP sensitivity in ovarian cancer.54 The current study shows that Bcl2 expression is regulated by miR-26a-HMGA2 signaling in A549 cells. Lower expression of miR-26a in A549/CDDPres cell associated with high expression of Bcl2, which also contributes to the mechanism of CDDP resistance of NSCLC.
In summary, the current study provides an effective approach to identifying active TF-miRNA regulatory pathways and a novel insight into the pathogenesis and development of CDDP resistance in NSCLC. Our findings suggest that targeting miR-26a-HMGA2 interaction or restoring miR-26a-expression may present a new therapeutic strategy for the treatment of CDDP resistance in NSCLC.
Materials and Methods
Cell culture
Human lung adenocarcinoma cell line A549 and CDDP-resistant variant cell line A549/CDDPres were purchased from the Peking Union Medical College, Beijing, China. A549 and A549/CDDPres cells were maintained in RPMI-1640 medium (Life Technologies, Grand Island, NY) supplemented with 10% fetal calf serum (Gibco, Gran Island, NY) in a humid atmosphere containing 5% CO2 at 37°C. The A549/CDDPres cell medium additionally contained 2 mg/L CDDP in order to maintain its drug-resistant phenotype. Cells in the logarithmic phase of growth were used for all experiments.
In vitro drug sensitivity assay
Cells were seeded in 96-well plates at a density of 5×10³ cells/well and incubated overnight at 37°C. The cells were incubated with different concentrations of CDDP (1 mg - 81 mg/L) for 48 h at 37°C, followed by addition of 100 μl sterile MTT dye (0.5 mg/ml, Sigma, St. Louis, MO). At 4 h after adding MTT, the culture medium was removed and 150 μl of dimethyl sulphoxide (DMSO) (Sigma, St. Louis, MO) was added to the cells. The absorbance was measured at 570 nm, with 655 nm as the reference wavelength. The concentration of CDDP that produced 50% inhibition of growth (IC50) was calculated from relative survival curves. Three independent experiments were performed in 6 duplicate wells.
Real-time RT-PCR
Real-time RT-PCR was used to verify mRNA differential expression. The cDNA was synthesized using reverse transcriptase (Bio-Rad, Hercules, CA), oligo (dT) primers with 1 µg RNA. Each real-time RT-PCR reaction (in 20 µL) contained 2×SYBR Green Realtime PCR Master Mix (Bio-Rad), 0.5 µM primers and 10 µg of template cDNA. The cycling conditions consisted of an initial, single cycle of 2 min at 95°C, followed by 40 cycles of 10 s at 95°C and 30 s at 60°C. PCR amplifications were performed in 3 duplicates for each sample. Gene expression levels were quantified relative to the expression of 18S using an optimized comparative Ct (ΔΔCt) value method. The primers used are listed as follows:
HMGA2 forward 5′-CCTCCTCCTCTTGCTACCTC-3′, reverse 5′-GCTGCCACCATCAACACC-3′; E2F1forward 5′-AAGAAGTCCAAGAACCACATCC-3′, reverse 5′-CTGCTGCTCGCTCTCCTG-3′; 18S forward 5′-GTAACCCGTTGAACCCCATT-3′, reverse 5′-CCATCCAATCGGTAGTAGCG-3′.
The differences in gene expression levels between groups were compared using the Student's t-test. P-values <0.05 were considered statistically significant.
QRT-PCR of miRNA
Bulge-loop™ miRNA qRT-PCR Primer Sets (one RT primer and a pair of qPCR primers for each set) specific for miR-26a were designed by RiboBio (Guangzhou, China). Briefly, the total RNA was extracted using a MiRNeasy Mini Kit (QIAGEN, Hilden, Germany). The miRNA bulge-loop was reverse transcribed with the Quantscript RT Kit (TIANGEN, China). Each real-time RT-PCR reaction (in 25 µL) contained 2×SuperReal PreMix (TIANGEN), 10 µM primers, and 1 µL of template cDNA. The cycling conditions consisted of an initial, single cycle of 3 min at 95°C, followed by 40 cycles of 10 s at 95°C, 20 s at 60°C and 30 s at 70°C. The relative amount of miRNAs was normalized against U6 snRNA, and the fold change for each miRNA was calculated by the 2−ΔΔCt method. P-values <0.05 were considered statistically significant.
Luciferase assay
LightSwitch Luciferase Assay System was applied for microRNA target gene detection. Generally, HMGA2 3′UTR GoClone reporters and LightSwitch miRNA mimics were co-transfected into A549 using DharmaFECT DUO (Active Motif, Carlsbad, CA) according to the manufacturer's instructions. Cells were then treated with LightSwitch Assay Reagents and the results were read in a plate luminometer. The knockdown was calculated by calculating luciferase signal ratio for each construct for specific miRNA over the non-targeting control (luminescence=specific miRNA/non-targeting control).
Small interfering RNA (siRNA)
To evaluate the role of miR-26a and inhibition of HMGA2 in the mechanism of CDDP resistance in A549 cells, different concentration of has-miR-26a mimic, hsa-miR-26a inhibitor (QIAGEN), or HMGA2 siRNA (Sigma) were transfected into A549 using Lipofectamine RNAiMAX reagent according to the manufacturer's instructions. Cells transfected with the transfection agent and scramble-control siRNA (negative control) were used as controls.
Western blot analysis
Total protein was separated by denaturing 10% SDS–polyacrylamide gel electrophoresis. Detection was performed with Odyssey system (Gene Company Limited, USA). The primary antibodies for HMGA2 (1:500), E2F1 (1:1000), Akt (1:1000), phosphor-Akt (1:500), Bcl-2 (1:1000), and GAPDH (1:5000) were purchased from Cell Signaling Technology (Denvers, MA). Protein levels were normalized to GAPDH and changes were determined.
Flow cytometry
Cells were plated in 6-well plates (2×10⁵ cells/well). 24 hours after the transfection of miR-26a mimic or inhibitor, as described above, A549 cells were treated by CDDP at a final concentration of 10 mg/L. 48 hours after the treatment of CDDP, flow cytometry was used to detect apoptosis of the transfected A549 cells by determining the relative amount of TUNEL-positive cells.
Colony formation assays
Cells were plated on 24-well plates (2×10³ cells per plate) and cultured for 10 d. The colonies were stained with 1.0% crystal violet for 30s after fixation with 10% formaldehyde for 5 min. The colony number in each well was counted.
Cell cycle analysis
All cells in a culture dish were harvested by trypsinization, washed in ice-cold PBS, and fixed in 90% ice-cold ethanol in PBS. Before staining, the cells were spun down in a cooled centrifuge and resuspended in the cold. Bovine pancreatic RNAase (Sigma, St. Louis, MO, USA) was added at a final concentration of 2 mg/mL, and cells were incubated at 37°C for 30 min, followed by incubation in 20 mg/mL of propidium iodide (Sigma, St. Louis, MO, USA) for 1 h at 4°C. 10,000 cells were analyzed with a flow cytometer (FACSCalibur; BD Biosciences, San Jose, CA).
Data analysis
Each experiment was repeated at least 3 times. Numerical data were presented as means and standard deviation (± SD). The Kaplan–Meier method was used for survival analysis in different gene expression. Differences between means were analyzed using Student's t test. All statistical analyses were performed using SPSS13.0 software (Chicago, IL). The microarray data used for survival analysis were from 2 GEO databases including 117 and 35 specimens, respectively. The median gene expression level was set as the boundary to divide the subjects.
Significant differential gene analysis
RVM t-test was used to identify differentially expressed genes for the control and experiment groups. This model has more power than standard tests to detect large changes in expression, without increasing the rate of false positives.56 After the significant analysis, we selected the differentially expressed genes according to predefined P-value thresholds (<0.05).56-58
TF and miRNA regulatory network
The TF and miRNA regulatory network was constructed by integrating 5 related data resources: TRANSFAC,59 TransmiR,60 miRTarBase,61 miRecords62 and TarBase.63 The relationship between human TF and gene regulation was searched from the TRANSFAC database (version 11.4); the data on TF regulation of miRNA in human were obtained from the TransmiR database (version 1.2); and the data on miRNA regulation of gene expression in human were acquired from the union of miRecords (version 3), TarBase (version 5.0) (excluding the FALSE support type of the miRNA-gene interactions), and miRTarBase databases (release 2.5). Within the regulatory network, all of the redundant edges were collapsed into a single edge, and all of the self-directed edges were pruned from the network.
Known CDDP-associated genes and miRNAs
The known CDDP-associated genes were searched from the GeneCards database.19 The disease genes presented in GeneCards were extracted from multiple databases that included known disease-associated genes. The known AD-associated miRNAs were derived from HMDD20 and the miR2Disease database.21 Both of these databases manually collected the associations between miRNAs and diseases from published studies.
Identification of potential active TF-miRNA regulatory pathways in CDDP resistance in NSCLC
A subnetwork often has a complex structure, even if it is distilled from the original background network. These complex connections impede the interpretation and validation of the subnetwork of interest. In this study, we focused on regulatory pathways, which were the paths connected to multiple TFs, miRNAs and target genes in the curated TF-miRNA regulatory network. Identifying the active regulatory pathways in NSCLC CDDP resistance not only uncovered transcriptional and post-transcriptional regulatory cascades but also shed light on the molecular mechanisms of NSCLC CDDP resistance.
From the potential active TF-miRNA regulatory subnetwork, we identified all directed acyclic paths from 0-indegree nodes to 0-outdegree nodes. The gene/miRNA with a 0-indegree cannot be regulated by other regulators, which indicates that it is located upstream of the regulatory pathway. Similarly, the gene/miRNA with a 0-outdegree does not regulate other genes/miRNAs, which means that it is located downstream of the regulatory pathway. The upstream genes/miRNAs are important because their activation could cause a cascade effect that results in the alteration of downstream gene/miRNA expression, leading to CDDP resistance. Thus, by searching all of the pathways/paths between 0-indegree genes/miRNAs and 0-outdegree genes/miRNAs, we can find key upstream genes/miRNAs in the regulatory pathways. To accomplish this task, the potential active subnetwork was treated as a directed graph. First, we used BFS algorithm to traverse all vertexes in the graph. Second, based on the results of graph traversal, a backtracking method was used to extract all paths from 0-indegree nodes to 0-outdegree nodes.
In this study, directed acyclic paths with more than 2 nodes were considered to be potential active regulatory pathways, in which there was at least one differentially expressed node and no more than one non-differentially expressed node or node without expression values between the 2 differentially expressed nodes.
Evaluation of potential active TF-miRNA regulatory pathways in CDDP resistance
Here, we defined a coverage rate (CR) of known CDDP-associated genes and miRNAs in the potential active pathway to measure the strength of the relationships between the potential active pathway and CDDP resistance. CR was calculated as CR =ND/NT. Where ND represents the number of known CDDP-associated genes and miRNAs in the pathway, and NT represents the total number of genes and miRNAs in the pathway.
Next, we used the hypergeometric test on Matlab software (version 7.0, MathWorks, Natick, MA) to evaluate the statistical significance of the CR value. Hypergeometric test is a type of command statement in the software. For example, we aimed to identify a list of 30 genes from the entire genome of 20000 genes, and 5 genes are related to cycle, while there are totally 200 cell cycle genes in the genome, then the decimal p-value will be: p=exp(log_hypergeometric(5,30,200,20000). A low P-value indicates that the observed CR value is unlikely to occur by chance and the pathway exhibits a greater than expected trend toward participating in CDDP resistance.
Disclosure of potential conflicts of interest
No potential conflicts of interest were disclosed.
Funding
This work was supported by the National Natural Foundation of China grant 81470262 and 81400056.
References
- 1.Siegel R, Naishadham D, Jemal A. Cancer statistics, 2013. CA Cancer J Clin 2013; 63:11-30; PMID:23335087; http://dx.doi.org/ 10.3322/caac.21166 [DOI] [PubMed] [Google Scholar]
- 2.Seve P, Reiman T, Dumontet C. The role of betaIII tubulin in predicting chemoresistance in non-small cell lung cancer. Lung Cancer 2010; 67:136-43; PMID:19828208; http://dx.doi.org/ 10.1016/j.lungcan.2009.09.007 [DOI] [PubMed] [Google Scholar]
- 3.Siddik ZH. Cisplatin: mode of cytotoxic action and molecular basis of resistance. Oncogene 2003; 22:7265-79; PMID:14576837; http://dx.doi.org/ 10.1038/sj.onc.1206933 [DOI] [PubMed] [Google Scholar]
- 4.Xiao X, Yu S, Li S, Wu J, Ma R, Cao H, Zhu Y, Feng J. Exosomes: decreased sensitivity of lung cancer A549 cells to cisplatin. PloS one 2014; 9:e89534; PMID:24586853; http://dx.doi.org/ 10.1371/journal.pone.0089534 [DOI] [PMC free article] [PubMed] [Google Scholar]
- 5.Stewart DJ. Mechanisms of resistance to cisplatin and carboplatin. Crit Rev Oncol Hematol 2007; 63:12-31; PMID:17336087; http://dx.doi.org/ 10.1016/j.critrevonc.2007.02.001 [DOI] [PubMed] [Google Scholar]
- 6.Bartel DP. MicroRNAs: genomics, biogenesis, mechanism, and function. Cell 2004; 116:281-97; PMID:14744438; http://dx.doi.org/ 10.1016/S0092-8674(04)00045-5 [DOI] [PubMed] [Google Scholar]
- 7.Lewis BP, Burge CB, Bartel DP. Conserved seed pairing, often flanked by adenosines, indicates that thousands of human genes are microRNA targets. Cell 2005; 120:15-20; PMID:15652477; http://dx.doi.org/ 10.1016/j.cell.2004.12.035 [DOI] [PubMed] [Google Scholar]
- 8.Kozomara A, Griffiths-Jones S. miRBase: integrating microRNA annotation and deep-sequencing data. Nucleic Acids Res 2011; 39:D152-7; PMID:21037258; http://dx.doi.org/ 10.1093/nar/gkq1027 [DOI] [PMC free article] [PubMed] [Google Scholar]
- 9.Li X, Zhang J, Gao L, McClellan S, Finan MA, Butler TW, Owen LB, Piazza GA, Xi Y. MiR-181 mediates cell differentiation by interrupting the Lin28 and let-7 feedback circuit. Cell Death Differ 2012; 19:378-86; PMID:21979467; http://dx.doi.org/ 10.1038/cdd.2011.127 [DOI] [PMC free article] [PubMed] [Google Scholar]
- 10.Krutzfeldt J, Rajewsky N, Braich R, Rajeev KG, Tuschl T, Manoharan M, Stoffel M. Silencing of microRNAs in vivo with ‘antagomirs’. Nature 2005; 438:685-9; PMID:16258535; http://dx.doi.org/ 10.1038/nature04303 [DOI] [PubMed] [Google Scholar]
- 11.Elmen J, Lindow M, Schutz S, Lawrence M, Petri A, Obad S, Lindholm M, Hedtjärn M, Hansen HF, Berger U, et al.. LNA-mediated microRNA silencing in non-human primates. Nature 2008; 452:896-9; PMID:18368051; http://dx.doi.org/ 10.1038/nature06783 [DOI] [PubMed] [Google Scholar]
- 12.Lee YS, Dutta A. MicroRNAs: small but potent oncogenes or tumor suppressors. Curr Opin Investig Drugs 2006; 7:560-4; PMID:16784027 [PubMed] [Google Scholar]
- 13.Caldas C, Brenton JD. Sizing up miRNAs as cancer genes. Nat Med 2005; 11:712-4; PMID:16015356; http://dx.doi.org/ 10.1038/nm0705-712 [DOI] [PubMed] [Google Scholar]
- 14.van Jaarsveld MT, Helleman J, Boersma AW, van Kuijk PF, van Ijcken WF, Despierre E, Vergote I, Mathijssen RH, Berns EM, Verweij J, et al.. miR-141 regulates KEAP1 and modulates cisplatin sensitivity in ovarian cancer cells. Oncogene 2013; 32:4284-93; PMID:23045278; http://dx.doi.org/ 10.1038/onc.2012.433 [DOI] [PubMed] [Google Scholar]
- 15.Zhang Y, Lu Q, Cai X. MicroRNA-106a induces multidrug resistance in gastric cancer by targeting RUNX3. FEBS Lett 2013; 587:3069-75; PMID:23932924; http://dx.doi.org/ 10.1016/j.febslet.2013.06.058 [DOI] [PubMed] [Google Scholar]
- 16.Sun L, Yao Y, Liu B, Lin Z, Lin L, Yang M, Zhang W, Chen W, Pan C, Liu Q, et al.. MiR-200b and miR-15b regulate chemotherapy-induced epithelial-mesenchymal transition in human tongue cancer cells by targeting BMI1. Oncogene 2012; 31:432-45; PMID:21725369; http://dx.doi.org/ 10.1038/onc.2011.263 [DOI] [PubMed] [Google Scholar]
- 17.Yang Y, Li H, Hou S, Hu B, Liu J, Wang J. The noncoding RNA expression profile and the effect of lncRNA AK126698 on cisplatin resistance in non-small-cell lung cancer cell. PloS One 2013; 8:e65309. [DOI] [PMC free article] [PubMed] [Google Scholar]
- 18.Jiang W, Zhang Y, Meng F, Lian B, Chen X, Yu X, Dai E, Wang S, Liu X, Li X, et al.. Identification of active transcription factor and miRNA regulatory pathways in Alzheimer disease. Bioinformatics 2013; 29:2596-602; PMID:23990414; http://dx.doi.org/ 10.1093/bioinformatics/btt423 [DOI] [PubMed] [Google Scholar]
- 19.Safran M, Solomon I, Shmueli O, Lapidot M, Shen-Orr S, Adato A, Ben-Dor U, Esterman N, Rosen N, Peter I, et al.. GeneCards 2002: towards a complete, object-oriented, human gene compendium. Bioinformatics 2002; 18:1542-3; PMID:12424129; http://dx.doi.org/ 10.1093/bioinformatics/18.11.1542 [DOI] [PubMed] [Google Scholar]
- 20.Lu M, Zhang Q, Deng M, Miao J, Guo Y, Gao W, Cui Q. An analysis of human microRNA and disease associations. Plos One 2008; 3:e3420; PMID:18923704; http://dx.doi.org/ 10.1371/journal.pone.0003420 [DOI] [PMC free article] [PubMed] [Google Scholar]
- 21.Jiang Q, Wang Y, Hao Y, Juan L, Teng M, Zhang X, Li M, Wang G, Liu Y. miR2Disease: a manually curated database for microRNA deregulation in human disease. Nucleic Acids Res 2009; 37:D98-104; PMID:18927107; http://dx.doi.org/ 10.1093/nar/gkn714 [DOI] [PMC free article] [PubMed] [Google Scholar]
- 22.Wilkerson MD, Yin X, Walter V, Zhao N, Cabanski CR, Hayward MC, Miller CR, Socinski MA, Parsons AM, Thorne LB, et al.. Differential pathogenesis of lung adenocarcinoma subtypes involving sequence mutations, copy number, chromosomal instability, and methylation. Plos One 2012; 7:e36530; PMID:22590557; http://dx.doi.org/ 10.1371/journal.pone.0036530 [DOI] [PMC free article] [PubMed] [Google Scholar]
- 23.Amelio I, Gostev M, Knight RA, Willis AE, Melino G, Antonov AV. DRUGSURV: a resource for repositioning of approved and experimental drugs in oncology based on patient survival information. Cell Death Dis 2014; 5:e1051; PMID:24503543; http://dx.doi.org/ 10.1038/cddis.2014.9 [DOI] [PMC free article] [PubMed] [Google Scholar]
- 24.Friedman RC, Farh KK, Burge CB, Bartel DP. Most mammalian mRNAs are conserved targets of microRNAs. Genome Res 2009; 19:92-105; PMID:18955434; http://dx.doi.org/ 10.1101/gr.082701.108 [DOI] [PMC free article] [PubMed] [Google Scholar]
- 25.Fedele M, Pierantoni GM, Visone R, Fusco A. E2F1 activation is responsible for pituitary adenomas induced by HMGA2 gene overexpression. Cell Div 2006; 1:17; PMID:16914062; http://dx.doi.org/ 10.1186/1747-1028-1-17 [DOI] [PMC free article] [PubMed] [Google Scholar]
- 26.Fedele M, Visone R, De Martino I, Troncone G, Palmieri D, Battista S, Ciarmiello A, Pallante P, Arra C, Melillo RM, et al.. HMGA2 induces pituitary tumorigenesis by enhancing E2F1 activity. Cancer Cell 2006; 9:459-71; PMID:16766265; http://dx.doi.org/ 10.1016/j.ccr.2006.04.024 [DOI] [PubMed] [Google Scholar]
- 27.Tomida S, Takeuchi T, Shimada Y, Arima C, Matsuo K, Mitsudomi T, Yatabe Y, Takahashi T. Relapse-related molecular signature in lung adenocarcinomas identifies patients with dismal prognosis. J Clin Oncol 2009; 27:2793-9; PMID:19414676; http://dx.doi.org/ 10.1200/JCO.2008.19.7053 [DOI] [PubMed] [Google Scholar]
- 28.Martini M, De Santis MC, Braccini L, Gulluni F, Hirsch E. PI3K/AKT signaling pathway and cancer: an updated review. Ann Med 2014; 46:372-83; PMID:24897931; http://dx.doi.org/ 10.3109/07853890.2014.912836 [DOI] [PubMed] [Google Scholar]
- 29.Ladu S, Calvisi DF, Conner EA, Farina M, Factor VM, Thorgeirsson SS. E2F1 inhibits c-Myc-driven apoptosis via PIK3CA/Akt/mTOR and COX-2 in a mouse model of human liver cancer. Gastroenterology 2008; 135:1322-32; PMID:18722373; http://dx.doi.org/ 10.1053/j.gastro.2008.07.012 [DOI] [PMC free article] [PubMed] [Google Scholar]
- 30.Belkhiri A, Dar AA, Zaika A, Kelley M, El-Rifai W. t-Darpp promotes cancer cell survival by upregulation of Bcl2 through Akt-dependent mechanism. Cancer Res 2008; 68:395-403; PMID:18199533; http://dx.doi.org/ 10.1158/0008-5472.CAN-07-1580 [DOI] [PubMed] [Google Scholar]
- 31.Gommans WM, Berezikov E. Controlling miRNA regulation in disease. Methods Mol Biol 2012; 822:1-18; PMID:22144188; http://dx.doi.org/ 10.1007/978-1-61779-427-8_1 [DOI] [PubMed] [Google Scholar]
- 32.Bao B, Ali S, Banerjee S, Wang Z, Logna F, Azmi AS, Kong D, Ahmad A, Li Y, Padhye S, et al.. Curcumin analogue CDF inhibits pancreatic tumor growth by switching on suppressor microRNAs and attenuating EZH2 expression. Cancer Res 2012; 72:335-45; PMID:22108826; http://dx.doi.org/ 10.1158/0008-5472.CAN-11-2182 [DOI] [PMC free article] [PubMed] [Google Scholar]
- 33.Lu J, He ML, Wang L, Chen Y, Liu X, Dong Q, Chen YC, Peng Y, Yao KT, Kung HF, et al.. MiR-26a inhibits cell growth and tumorigenesis of nasopharyngeal carcinoma through repression of EZH2. Cancer Res 2011; 71:225-33; PMID:21199804; http://dx.doi.org/ 10.1158/0008-5472.CAN-10-1850 [DOI] [PubMed] [Google Scholar]
- 34.Zhang B, Liu XX, He JR, Zhou CX, Guo M, He M, Li MF, Chen GQ, Zhao Q. Pathologically decreased miR-26a antagonizes apoptosis and facilitates carcinogenesis by targeting MTDH and EZH2 in breast cancer. Carcinogenesis 2011; 32:2-9; PMID:20952513; http://dx.doi.org/ 10.1093/carcin/bgq209 [DOI] [PubMed] [Google Scholar]
- 35.Dang X, Ma A, Yang L, Hu H, Zhu B, Shang D, Chen T, Luo Y. MicroRNA-26a regulates tumorigenic properties of EZH2 in human lung carcinoma cells. Cancer Genet 2012; 205:113-23; PMID:22469510; http://dx.doi.org/ 10.1016/j.cancergen.2012.01.002 [DOI] [PubMed] [Google Scholar]
- 36.Kota J, Chivukula RR, O'Donnell KA, Wentzel EA, Montgomery CL, Hwang HW, Chang TC, Vivekanandan P, Torbenson M, Clark KR, et al.. Therapeutic microRNA delivery suppresses tumorigenesis in a murine liver cancer model. Cell 2009; 137:1005-17; PMID:19524505; http://dx.doi.org/ 10.1016/j.cell.2009.04.021 [DOI] [PMC free article] [PubMed] [Google Scholar]
- 37.Yang X, Liang L, Zhang XF, Jia HL, Qin Y, Zhu XC, Gao XM, Qiao P, Zheng Y, Sheng YY, et al.. MicroRNA-26a suppresses tumor growth and metastasis of human hepatocellular carcinoma by targeting interleukin-6-Stat3 pathway. Hepatology 2013; 58:158-70; PMID:23389848; http://dx.doi.org/ 10.1002/hep.26305 [DOI] [PubMed] [Google Scholar]
- 38.Ashar HR, Chouinard RA Jr., Dokur M, Chada K. In vivo modulation of HMGA2 expression. Biochim Biophys Acta 2010; 1799:55-61; PMID:20123068; http://dx.doi.org/ 10.1016/j.bbagrm.2009.11.013 [DOI] [PubMed] [Google Scholar]
- 39.Li O, Vasudevan D, Davey CA, Droge P. High-level expression of DNA architectural factor HMGA2 and its association with nucleosomes in human embryonic stem cells. Genesis 2006; 44:523-9; PMID:17078040; http://dx.doi.org/ 10.1002/dvg.20242 [DOI] [PubMed] [Google Scholar]
- 40.Eda A, Tamura Y, Yoshida M, Hohjoh H. Systematic gene regulation involving miRNAs during neuronal differentiation of mouse P19 embryonic carcinoma cell. Biochem Biophys Res Commun 2009; 388:648-53; PMID:19679099; http://dx.doi.org/ 10.1016/j.bbrc.2009.08.040 [DOI] [PubMed] [Google Scholar]
- 41.Fusco A, Fedele M. Roles of HMGA proteins in cancer. Nat Rev Cancer 2007; 7:899-910; PMID:18004397; http://dx.doi.org/ 10.1038/nrc2271 [DOI] [PubMed] [Google Scholar]
- 42.Gorgoulis VG, Zacharatos P, Mariatos G, Kotsinas A, Bouda M, Kletsas D, Asimacopoulos PJ, Agnantis N, Kittas C, Papavassiliou AG. Transcription factor E2F-1 acts as a growth-promoting factor and is associated with adverse prognosis in non-small cell lung carcinomas. J Pathol 2002; 198:142-56; PMID:12237873; http://dx.doi.org/ 10.1002/path.1121 [DOI] [PubMed] [Google Scholar]
- 43.Eymin B, Gazzeri S, Brambilla C, Brambilla E. Distinct pattern of E2F1 expression in human lung tumours: E2F1 is upregulated in small cell lung carcinoma. Oncogene 2001; 20:1678-87; PMID:11313916; http://dx.doi.org/ 10.1038/sj.onc.1204242 [DOI] [PubMed] [Google Scholar]
- 44.Suh DS, Yoon MS, Choi KU, Kim JY. Significance of E2F-1 overexpression in epithelial ovarian cancer. Int J Gynecol Cancer 2008; 18:492-8; PMID:17692085; http://dx.doi.org/ 10.1111/j.1525-1438.2007.01044.x [DOI] [PubMed] [Google Scholar]
- 45.Real S, Meo-Evoli N, Espada L, Tauler A. E2F1 regulates cellular growth by mTORC1 signaling. Plos One 2011; 6:e16163; PMID:21283628; http://dx.doi.org/ 10.1371/journal.pone.0016163 [DOI] [PMC free article] [PubMed] [Google Scholar]
- 46.Hirano G, Izumi H, Kidani A, Yasuniwa Y, Han B, Kusaba H, Akashi K, Kuwano M, Kohno K. Enhanced expression of PCAF endows apoptosis resistance in cisplatin-resistant cells. Mol Cancer Res 2010; 8:864-72; PMID:20530585; http://dx.doi.org/ 10.1158/1541-7786.MCR-09-0458 [DOI] [PubMed] [Google Scholar]
- 47.Iaquinta PJ, Lees JA. Life and death decisions by the E2F transcription factors. Curr Opin Cell Biol 2007; 19:649-57; PMID:18032011; http://dx.doi.org/ 10.1016/j.ceb.2007.10.006 [DOI] [PMC free article] [PubMed] [Google Scholar]
- 48.Polager S, Ginsberg D. E2F - at the crossroads of life and death. Trends Cell Biol 2008; 18:528-35; PMID:18805009; http://dx.doi.org/ 10.1016/j.tcb.2008.08.003 [DOI] [PubMed] [Google Scholar]
- 49.Diehl JA, Cheng M, Roussel MF, Sherr CJ. Glycogen synthase kinase-3beta regulates cyclin D1 proteolysis and subcellular localization. Genes Dev 1998; 12:3499-511; PMID:9832503; http://dx.doi.org/ 10.1101/gad.12.22.3499 [DOI] [PMC free article] [PubMed] [Google Scholar]
- 50.Cross DA, Alessi DR, Cohen P, Andjelkovich M, Hemmings BA. Inhibition of glycogen synthase kinase-3 by insulin mediated by protein kinase B. Nature 1995; 378:785-9; PMID:8524413; http://dx.doi.org/ 10.1038/378785a0 [DOI] [PubMed] [Google Scholar]
- 51.Johnson DG, Walker CL. Cyclins and cell cycle checkpoints. Annu Rev Pharmacol Toxicol 1999; 39:295-312; PMID:10331086; http://dx.doi.org/ 10.1146/annurev.pharmtox.39.1.295 [DOI] [PubMed] [Google Scholar]
- 52.Zhou BP, Liao Y, Xia W, Zou Y, Spohn B, Hung MC. HER-2/neu induces p53 ubiquitination via Akt-mediated MDM2 phosphorylation. Nat Cell Biol 2001; 3:973-82; PMID:11715018; http://dx.doi.org/ 10.1038/ncb1101-973 [DOI] [PubMed] [Google Scholar]
- 53.Fraser M, Bai T, Tsang BK. Akt promotes cisplatin resistance in human ovarian cancer cells through inhibition of p53 phosphorylation and nuclear function. Int J Cancer 2008; 122:534-46; PMID:17918180; http://dx.doi.org/ 10.1002/ijc.23086 [DOI] [PubMed] [Google Scholar]
- 54.Bansal N, Marchion DC, Bicaku E, Xiong Y, Chen N, Stickles XB, Sawah EA, Wenham RM, Apte SM, Gonzalez-Bosquet J, et al.. BCL2 antagonist of cell death kinases, phosphatases, and ovarian cancer sensitivity to cisplatin. J Gynecol Oncol 2012; 23:35-42; PMID:22355465; http://dx.doi.org/ 10.3802/jgo.2012.23.1.35 [DOI] [PMC free article] [PubMed] [Google Scholar]
- 55.Sumazin P, Yang X, Chiu HS, Chung WJ, Iyer A, Llobet-Navas D, Rajbhandari P, Bansal M, Guarnieri P, Silva J, et al.. An extensive microRNA-mediated network of RNA-RNA interactions regulates established oncogenic pathways in glioblastoma. Cell 2011; 147:370-81; PMID:22000015; http://dx.doi.org/ 10.1016/j.cell.2011.09.041 [DOI] [PMC free article] [PubMed] [Google Scholar]
- 56.Wright GW, Simon RM. A random variance model for detection of differential gene expression in small microarray experiments. Bioinformatics 2003; 19:2448-55; PMID:14668230; http://dx.doi.org/ 10.1093/bioinformatics/btg345 [DOI] [PubMed] [Google Scholar]
- 57.Clarke R, Ressom HW, Wang A, Xuan J, Liu MC, Gehan EA, Wang Y. The properties of high-dimensional data spaces: implications for exploring gene and protein expression data. Nat Rev Cancer 2008; 8:37-49; PMID:18097463; http://dx.doi.org/ 10.1038/nrc2294 [DOI] [PMC free article] [PubMed] [Google Scholar]
- 58.Yang H, Crawford N, Lukes L, Finney R, Lancaster M, Hunter KW. Metastasis predictive signature profiles pre-exist in normal tissues. Clin Exp Metastasis 2005; 22:593-603; PMID:16475030; http://dx.doi.org/ 10.1007/s10585-005-6244-6 [DOI] [PMC free article] [PubMed] [Google Scholar]
- 59.Wingender E, Chen X, Hehl R, Karas H, Liebich I, Matys V, Meinhardt T, Prüss M, Reuter I, Schacherer F. TRANSFAC: an integrated system for gene expression regulation. Nucleic Acids Res 2000; 28:316-9; PMID:10592259; http://dx.doi.org/ 10.1093/nar/28.1.316 [DOI] [PMC free article] [PubMed] [Google Scholar]
- 60.Wang J, Lu M, Qiu C, Cui Q. TransmiR: a transcription factor-microRNA regulation database. Nucleic Acids Res 2010; 38:D119-22; PMID:19786497; http://dx.doi.org/ 10.1093/nar/gkp803 [DOI] [PMC free article] [PubMed] [Google Scholar]
- 61.Hsu SD, Lin FM, Wu WY, Liang C, Huang WC, Chan WL, Tsai WT, Chen GZ, Lee CJ, Chiu CM, et al.. miRTarBase: a database curates experimentally validated microRNA-target interactions. Nucleic Acids Res 2011; 39:D163-9; PMID:21071411; http://dx.doi.org/ 10.1093/nar/gkq1107 [DOI] [PMC free article] [PubMed] [Google Scholar]
- 62.Xiao F, Zuo Z, Cai G, Kang S, Gao X, Li T. miRecords: an integrated resource for microRNA-target interactions. Nucleic Acids Res 2009; 37:D105-10; PMID:18996891; http://dx.doi.org/ 10.1093/nar/gkn851 [DOI] [PMC free article] [PubMed] [Google Scholar]
- 63.Sethupathy P, Corda B, Hatzigeorgiou AG. TarBase: A comprehensive database of experimentally supported animal microRNA targets. RNA 2006; 12:192-7; PMID:16373484; http://dx.doi.org/ 10.1261/rna.2239606 [DOI] [PMC free article] [PubMed] [Google Scholar]