

ABSTRACT
Erythroid differentiation-associated gene (EDAG) is differentially expressed in normal hematopoietic progenitor/stem cells and a variety of embryonic tissues. High EDAG-1 expression is also found in human thyroid cancer cells and peripheral blood of patients with leukemia, but its functional significance was unclear. Current study aims to further clarify the expression pattern of EDAG-1 and tests its roles in proliferation and invasion of human thyroid cancer cells in vitro and in vivo. To this end, we have performed gain-of-function and loss-of-function studies to clarify how EDAG-1 regulates the proliferation, invasion, and adhesion ability of human thyroid cancer cells SW579cells. We found that overexpression of EDAG-1 promoted the proliferation, invasion, and adhesion of human thyroid cancer cells, whereas silencing of EDAG-1 reversed all these changes and reduced the tumorigenesis risk of nude mice. Mechanistically, we found that overexpression of EDAG-1 activated the MAPK/Erk and AKT signal pathways. These findings provide novel insights of the role of EDAG-1 in thyroid tumors, and may have direct clinical implication.
KEYWORDS: AKT, EDAG-1, invasion, MAPK/Erk, proliferation, thyroid cancer, SW579 cells
Abbreviations
- EDAG-1
Erythroid differentiation-associated gene-1
- MTT
3-[4, 5-dimehyl-2-thiazolyl]-2, 5-diPhenyl-2H- tetrazolium bromide
- OD
optical density
- PI
propidium iodide
- PVDF
Polyvinylidene difluoride membranes
Introduction
Thyroid cancer is the most common malignant tumor in the endocrine system,1 and noticeably, its incidence increased steadily recently.2-4 Invasion and metastasis are the main biological characteristics of malignant tumor,5 and are also the major cause of death in thyroid cancer patients.
EDAG (Erythroid differentiation-associated gene)-1 was originally cloned by Yang et al.6 This gene encodes a protein of 484 amino acids, and is highly homologous with mice Hemogen and rats RP59.7 Previous studies found that EDAG-1 differentially expressed in hematopoietic tissues, fetal liver and adult liver tissues.8 Our recent study further confirmed that the expression level of EDAG-1 is extremely low in most differentiated tissues, such as the normal brain, heart, kidney, liver, lung, muscle, tonsil, mature white blood cells. In contrast, high level of expression was found in adult bone marrow, most embryonic tissues and thyroid tumor tissue.9
Previous functional study found that EDAG-1 might play a vital role in the hematopoietic development and differentiation through regulating cell's proliferation and differentiation, because abnormal high expression of EDAG-1 was associated with leukemia.10. On the other hand, EDAG was thought to enhance the protein stability of NPM1 via binding to NPM1, which plays a critical role in the anti-apoptosis of leukemia cells.11,12 Study also found that EDAG-1 has transcriptional activation activity, and abnormal activity of EDAG-1 could disrupt intracellular microenvironment.13 However, the exact role of EDAG-1 in human thyroid tumors is currently unknown.
Dysregulated RAS/Erk1/2 and PI3K/AKT pathways have been implicated in thyroid tumors, since both pathways are abnormally activated in high percentage of thyroid tumors.14 PI3K/AKT signaling has been reported to play role on proliferation, migration, invasion, and tumorigenesis of thyroid cancer cells,15,16 while IL-8-AKT-Slug pathway sustains EMT/stemness of thyroid cancer cells.17 However, the exact role of EDAG-1 on MAPK/Erk and AKT signal pathway in thyroid cancer is still unknown.
Our current study first examined the expression of EDAG-1 in thyroid related specimens by standard immunohistochemistry and Western blotting. We then studied the effects of EDAG-1 overexpression on proliferation, invasion, and adhesion ability of thyroid cancer cells line SW579, through MTT, colony formation, cell cycle, adhesion and wound closure assays. Complimentary knockdown studies were also performed to observe its effects on malignant biological behaviors of thyroid cancer cells in vitro and in vivo. Furthermore, we studied the mechanism of EDAG-1 regulated the progression of thyroid cancer cells, and we found that EDAG-1 promotes proliferation and invasion of the thyroid cancer cells by activating the MAPK/Erk and AKT signal pathways.
Results
EDAG-1 is highly expressed in thyroid tumor tissues
To investigate the roles of EDAG-1 in thyroid cancer, we first compared the expression of EDAG-1 in thyroid cancers (papillary thyroid carcinoma), benign thyroid tumor tissues, thyroid cysts and gastric cancer (adenocarcinoma) tissues through standard immunohistochemistry (IHC) and Western Blotting. Similar to previous report (Li V. Yang et al, 2001), the positive signal of EDAG-1 is perinuclear and in the nuclei of tumor cells (Fig. 1A a). More importantly, the expression is significantly higher in thyroid cancer (Fig. 1A a), than that of benign thyroid tumor tissues (Fig. 1A b), and thyroid cysts (Fig. 1A c). In contrast, the expression of EDAG-1 in gastric cancer tissues is undetectable (Fig. 1A d).
Figure 1.

The expression of EDAG-1 in human thyroid tumor. (A) Positive signal of EDAG-1 presented as small claybank granules, located mainly in the nuclei of tumor cells (a). Immunohistochemical results showed that EDAG-1 highly expressed in thyroid cancer (papillary thyroid carcinoma, in this case) (a) and benign thyroid tumor tissue (b), but not in thyroid cysts (c) and gastric cancer (adenocarcinoma) tissue (d). (B&C) Western blotting confirmed the finding, and additionally, it also showed that EDAG-1 is highly expressed in SW579 cells.
We further quantified the protein expression level of EDAG-1 in thyroid cancer, thyroid tumor tissues, thyroid cysts, gastric cancer tissues, and SW579 cells by Western Blotting. As shown in Figs. 1B&C, EDAG-1 is highly expressed in SW579 cells, thyroid cancer and benign thyroid tumor tissue, while the expression is quite low in thyroid cysts. Consistent with IHC study, there was no detectable expression of EDAG-1 in gastric cancer tissues.
EDAG-1 promotes the proliferation of thyroid cancer cells
To start to understand the roles of EDAG-1 in malignant biological behavior of thyroid cancer, we first constructed the eukaryotic expression vector to overexpress EDAG-1 (pcDNA3.1-EDAG-1), or inhibit EDAG-1 (pcDNA3.1-AS-EDAG-1 and EDAG-1 siRNA). Western Blotting showed that the all vectors worked as we expected in SW579 cells (Figs. 2A-D). Empty vector pcDNA3.1 was served as a control.
Figure 2.

overexpression of EDAG-1 enhanced the proliferation of thyroid cancer cells. (A&B) Western blotting showed higher and lower level of EDAG-1 in pcDNA3.1-EDAG-1 and pcDNA3.1-AS-EDAG, respectively, comparing to the control groups (pcDNA3.1&Control), as expected. (C&D) Similarly, EDAG-1 protein expression in siRNA group decreased significantly. (E) In the MTT assay, cell viability was increased by pcDNA3.1–EDAG-1. (F) In contrast, cell viability was decreased by siRNA. (G&H) High level of EDAG-1 accelerated the cell progression into the G2 phase (second gap), n = 3.
With these eukaryotic expression vectors of EDAG-1, we test whether gain-of-function or loss-of-function of EDAG-1 is correlated with the proliferation of thyroid cancer cells through MTT assay. We found that, at the time points of 48 h and 72 h after transfection, cell proliferation rate increased significantly in pcDNA3.1-EDAG-1group (Fig. 2E, P < 0.01). Consistently, cell proliferation rate decreased sharply in pcDNA3.1-AS-EDAG-1 group (P < 0.01) and siRNA interference group (P> 0.05), comparing with empty vector or no transfection control (Fig. 2F).
High EDAG-1 also promoted the cell progression into the G2 phase (second gap) (Figs. 2G&H, n = 3) further supported the idea that the cell proliferation was enhanced by gain-of-function of EDAG-1.
EDAG-1 increased the colony formation rate of thyroid cancer cells
Complimentarily, colony formation assay indicated that the colony formation rate of pcDNA3.1-EDAG-1 group was increased (P < 0.01), while the rate was markedly decreased in pcDNA3.1(+)-AS-EDAG-1group (P < 0.01) (Figs. 3A&B). This data suggested that, in addition to enhanced cell proliferation, the ability of colony formation may also be increased by EDAG-1.
Figure 3.

EDAG-1 increased the colony formation rate of thyroid cancer cells. (A) Typical images of colony-forming assay demonstrated that colony formation rate of pcDNA3.1-EDAG-1 group was significantly higher, while was lower in the group of pcDNA3.1-AS-EDAG-1, comparing to control groups (Control and pcDNA3.1). (B) Quantification of (A), *P < 0.05, **P < 0.01.
EDAG-1 overexpression enhanced the migration and adhesion of thyroid cancer cells
Abnormal migration and adhesion abilities are also characteristic features of malignant tumor. To explore whether EDAG-1 also regulates migration, we carried out the wound closure assay, and we found that the migration speed of pcDNA3.1-EDAG-1 transfected cells was dramatically increased than that of the control group. For example, at the time of 48 hr after scratch, the wound in cells transfected with pcDNA3.1-EDAG-1 were almost closed, while a wide gap still existed in the control groups (Figs. 4A&B). This demonstrated that EDAG-1 overexpression can promote migration of thyroid cancer cells.
Figure 4.

EDAG-1 overexpression enhanced the migration of thyroid cancer cells. (A&B) Migration of cells was assessed by the wound closure assay. After 48h, the wound was nearly closed in pcDNA3.1-EDAG-1 group, while the scratches are still visible in the control groups (pcDNA3.1&Control).
Similarly, adhesion assay also found that EDAG-1 overexpression caused enhanced adhesion ability of thyroid cancer cells at each tested time point (P < 0.05) (Figs. 5A&B). Consistently, loss-of-function study also suggested that adhesion was decreased in siRNA interference group (P < 0.05) (Figs. 5A&B). This demonstrated that high level of EDAG-1 can promote adhesion of thyroid cancer cells.
Figure 5.

EDAG-1 overexpression enhanced the adhesion of thyroid cancer cells. (A) Top panels show that EDAG-1 can promote cell adhesion, while the siRNA group shows the opposite result, comparing to control groups (pcDNA3.1& Control), at different time points. (B) Bottom panel is the quantification of top panels (P < 0.05).
Downregulated the expression of EDAG-1 suppressed the tumorigenicity of thyroid cancer cells in vivo
To further assess whether the EDAG-1 associated abnormal in vitro behavior could translated into abnormal tumorigenesis in vivo, cells from EDAG-1 overexprssion group, Control group, and EDAG-1 siRNA group were injected subcutaneously into athymic mice respectively. The tumor volumes were measured at 4 time points after the inoculation, i.e., 10, 20, 30, and 40days. As shown in Figs. 6A-C, tumor growth of EDAG-1 overexprssion group was faster than that of the Control group (P < 0.01), while the tumor growth of EDAG-1 siRNA group was slower than that of the Control group (P < 0.01). Similarly, the final tumor weight of EDAG-1 overexprssion group was heavier than that of the Control group (P < 0.05), while the tumor weight of EDAG-1 siRNA group was reduced (P < 0.05).
Figure 6.

EDAG-1 regulates the tumorigenicity of thyroid cancer cells in vivo. (A) Representative images of tumors from different groups. (B) Tumor weights of EDAG-1 overexprssion group were higher than that of the Control group (**P < 0.01, *P < 0.05), while the siRNA group shows the opposite result (**P < 0.01, *P < 0.05). (C) Tumor volumes of EDAG-1 overexprssion group were bigger than that of the Control group (**P < 0.01, *P < 0.05), while the EDAG-1 siRNA group shows the opposite trend.
EDAG-1 activated MAPK/Erk and Akt signal pathways
To further understand the mechanism associated with the process, Western blotting was carried out to detect the signal pathways activated by EDAG-1. SW579 cells were transfected with pcDNA3.1-EDAG-1 and EDAG-1-siRNA respectively to up-regulate or down-regulate the expression of EDAG-1. As shown in Figs. 7A-D, overexpression of EDAG-1 increased the expression of p-Erk and p-Akt, whereas silencing of EDAG-1 decreased p-Erk and p-Akt level (P < 0.05). This suggested that high level of EDAG-1 can activate both the MAPK/Erk and Akt signal pathways.
Figure 7.
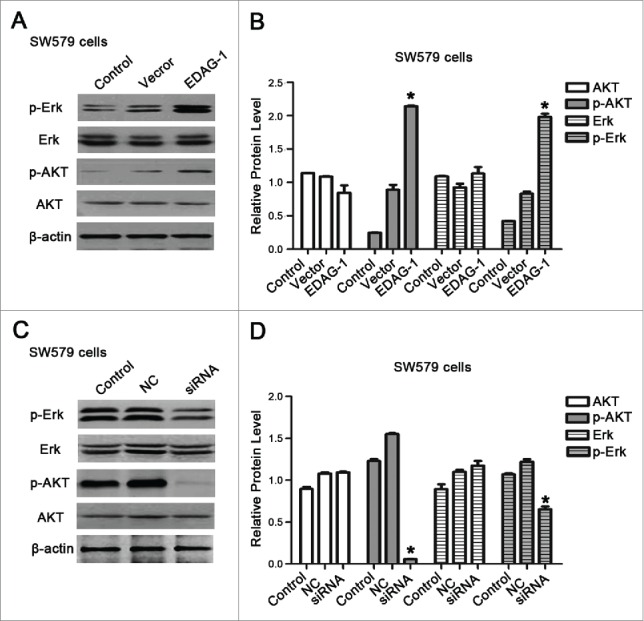
EDAG-1 regulated MAPK/Erk and Akt signal pathways. (A) Western blotting showed the expression of Erk/p-Erk, and AKT/p-AKT after SW579 cells were transfected with pcDNA3.1, and pcDNA3.1-EDAG-1. (B) Quantification of (A), *P < 0.05; **P < 0.01. (C) Western blotting showed the expression of Erk/p-Erk, and AKT/p-AKT after SW579 cells were transfected with Control-siRNA, and EDAG-1-siRNA. (D) Quantification of (C), *P < 0.05; **P < 0.01.
Discussion
Previous study demonstrated that EDAG overexpression in NIH3T3 cells caused anchorage-independent growth, loss of cells' contact inhibition, and tumorigenesis in athymic mouse,18 which suggested that it may be a proto-oncogene. Consistently, high expression of EDAG was founded in leukemia cell lines, solid tumors like thymic tumors, thyroid tumors and non-Hodgkin's lymphoma.9,10
Current study further clarified the expression pattern of EDAG-1 (Fig. 1A), which suggested that gain-of-function of EDAG-1 may be associated with thyroid cancer/tumors. Based on this original finding, our studies focused on how overexpression and knockdown of EDAG-1 regulates the malignant biological behavior of thyroid cancer cells in vitro and in vivo.
Specifically, MTT and Cell cycle studies showed that high level of EDAG-1 was associated with the high level of proliferation, while RNAi effectively inhibited the proliferation of SW579 cells (Figs. 2E-H). Complimentarily studies also suggested that the gain-of-function of EDAG-1 was associated with increased colony formation, migration, adhesion, and in vivo tumorigenicity. Collectively, these findings suggested EDAG-1 may play key roles in regulating the malignant biological behavior of thyroid cancer through multiple mechanisms, especially through regulating tumor proliferation and invasion.
Unsurprisingly, previous studies also have shown that EDAG-1 participated in the process of tumor metastasis. Aberrant gene expression of EDAG-1 can lead to malignant transformation of normal cells, and higher malignant behavior of tumor cells,19 and down-regulation of EDAG expression by retrovirus-mediated small interfering RNA could inhibit the growth and IL-8 production of leukemia cells.20 Mechanistically, previous reports seem to suggested that EDAG gene probably regulates the thyroid cancer cells proliferation by inhibiting the activation of NF-κB9 or GATA-1.21,22,23 Interestingly, MAPK/Erk and AKT pathways have also been reported to be promising therapeutic targets for thyroid cancer,24-26 and more importantly, combinational regime utilizing the molecular inhibitors that inhibited both pathways seemed to show more potent treatment effects for thyroid cancer.27
Consistent with these reports, our study shed further insights into the expression and the functions of EDAG-1, which specifically suggested that EDAG-1 might play a key role in thyroid cancer through regulating the proliferation and invasion of the thyroid cancer cells. Mechanistically, we provided the evidence that MAPK/Erk and AKT signal pathways at least partially mediated the high EDAG-1 induced tumorigenesis in thyroid cancer; therefore, targeting EDAG-1 and/or dysregulated MAPK/Erk and AKT signal pathways may have direct clinical implication for thyroid cancer therapy.
Materials and methods
Immunohistochemistry
Immunohistochemical kit was used to detect the expression of EDAG-1 in human tissues. Antigen retrieval solution, PBS, primary antibody mouse anti-human monoclonal antibody was obtained from Beijing Military and Science College, secondary antibody, goat anti-mouse, were bought from Beijing BoSen Biological Technology Company. Immunohistochemical study was performed according to standard procedure. Briefly, primary antibody was first incubated with sections at −4°C overnight, and then the sections were washed 3 times with PBS before the secondary antibody was added. After incubation at room temperature for 10–15 minutes, sections were washed 3 times with PBS, and then sections were colored with DAB.
Cell culture
Human thyroid cancer cells SW579 were obtained from the Chinese academy of sciences, Shanghai institute of cell biology. Fetal bovine serum and calf serum was purchased from GIBCO. Cells were cultured in complete medium with 10% fetal bovine serum and incubated under 5% CO2 at 37°C.
Western blotting analysis
Western blotting was performed according to the standard procedure. Protein lysates were boiled in the sample-loading buffer, resolved in 6–15% sodium dodecyl sulfate-polyacrylamide gel electrophoresis (SDS-PAGE), and were transferred to polyvinylidene fluoride membranes (PVDF, Millipore, Billerica, MA, USA); the immune complexes were detected by enhanced chemiluminescence (Cell Signaling Technology). Primary antibodies used in this study were: EDAG-1(Santa Cruz), Erk(CST), p-Erk(CST), AKT(CST), p-AKT(CST), β-actin (Abcam). Blots were quantified by densitometry, and normalized by β-actin.
Cell transfection
SW579 cells in logarithmic growth phase were re-suspended, and seeded at adensity of 1.0 ∼2.5×10⁶/well into 60 mm plates, and transfected with a cationic lipsome-mediated vector lipofectamine™2000 (8μg/well), according to manufacturer's instruction. 24 hours after transfection, cells were diluted (1:10) with the culture medium that contains G418 for 2 weeks.
MTT assay
SW579 cells were seeded and cultured on 96-well plates at an initial density of 5000/well after trypsinization. The cell's proliferation capacity was measured by MTT (methyl thiazolyl tetrazolium) assay at 0 hour, 24 hours and 48 hours. Specifically, 0.02 mL of MTT solution (5 mg/mlin PBS) was added into each well, and incubated for 4 hours at 37°C. After that, the medium was replaced by 0.15 mL of dimethyl sulfoxide for 10-min incubation. The optical density at 570 nm was measured by Microplate spectrophotometer (Thermo Scientific, Franklin, MA). All experiments were performed in triplicate.
Colony-formation assay
SW579 cells were seeded and cultured on 60mm2 plates at an initial density of 1000/well after trypsinization, each group was measured in 3 parallel wells, and incubated for 2∼3 weeks at 37°C, 5% CO2. Then cells were washed with PBS, and fixed for 15 minutes at room temperature. Cells were then stained with crystal violet 10∼30 minutes, washed and air dried. Colony numbers were counted by eyes.
Cell cycle analysis
SW579 cells and SW579-EDAG-1 cells without IL-3 were collected. 1×10⁶ cells were fixed in cold ethanol (70%) for overnight. After washing with PBS, cells were permeabilized with 100μl RNAase in PBS for 30 min at 37°C in the absence of light, and then cells were stained with 400μL of PI (propidium iodide) (Sigma) for 30 min. The cell-cycle phases were analyzed by flow cytometry system (Beckman Coulter, Indianapolis, IN) at an excitation wavelength of 488 nm and an emission wavelength of 525 nm.
Wound-healing assay
Wound-healing assay was used to detect the migration ability of SW579 cells before and after transfection. pcDNA3.1-EDAG-1 and pcDNA3.1 transfected cells, and SW579 cells at logarithmic phase were collected, and seeded on 6-well plate at a density of 1×10⁶/well. Once the full confluence was reached, a ‘wound’ was made in the middle of the culture plate with a sterile 200μl pipettetip. The wound-healing process was observed under an inverted microscope at 0 hour, 24 hours, and 48 hours after the scratch. Similarly, the migration ability of SW579 cells after siRNA was measured.
Adhesion assay
100μl pcDNA3.1-EDAG-1 and pcDNA3.1 transfected cells, and SW579 cells were seeded into the 96-well culture plate at a density of 1×10⁵/well, and incubated at 37°C, 5% CO2. Images were taken at different time points, i.e., 10 minutes, 30 minutes, 1 hour, 2 hours and 4 hours after crystal violet staining. The experiment was repeated 3 times.
siRNA interference
EDAG siRNA was synthesized by Gemma Shanghai. The sense strand was 5-AUAAGGAUGUGCCUAAAGATT-3′; the anti-sense strand was 5′-UCUUUAGGCACAUCCUUAUUT-3. The Negative control sequences were 5′-UUCUCCGAACGUGUCACGUTT-3; 5-ACGUGACACGUUCGGAGATT-3′. siRNA was transfected into SW579 cells, according to the optimal transfection condition. After transfection, total protein was extracted from 1×10⁶ cells to test the effectiveness of the siRNA.
Tumorigenicity assay
0.1 ml cells (1×10⁶) from each group (EDAG-1 overexpression cells, SW579 / siRNA cells, SW579 cells) were inoculated subcutaneously into the back of 10 athymic mice. Tumor size was measured at 4 different time-points, i.e., 10, 20, 30 and 40 days after inoculation. Specifically, the longest diameter and shortest diameter of the tumors were measured, and recorded as a, b. Tumor volumes were then calculated according to the formula: Tumor Volume (mmm3) = a × b2/2 (Cancer Res 1986, 46: 4109–15).
Statistical analysis
All data were analyzed by SPSS13.0, and SPSS11.5 software. x2 test or rank test was used for categorical variables, and Student's T-test for continuous variables. *indicates statistical difference with p < 0.05, **indicates statistical difference with p < 0.01.
Disclosure of potential conflicts of interest
No potential conflicts of interest were disclosed.
Funding
This work was supported by the Project of the National Natural Sciences Foundation of China (30873046).
References
- 1.Hundahl SA, Fleming ID, Fremgen AM, Menck HR. A National Cancer Date Base report on 53, 856 cases of thyroid carcinoma treated in the U.S. Cancer 1998; 83:2638-2648; PMID:9874472; http://www.ncbi.nlm.nih.gov/pubmed/9874472 [DOI] [PubMed] [Google Scholar]
- 2.Chen AY, Jemal A, Ward EM. Increasing Incidence of Differentiated Thyroid Cancer in the United States, 1988–2005. Cancer 2009; 8:3801-3807; PMID:19598221; http://dx.doi.org/ 10.1002/cncr.24416 [DOI] [PubMed] [Google Scholar]
- 3.Cramer JD, Fu P, Harth KC, Margevicius S, Wilhelm SM. FACS, Cleveland, OH. Analysis of the rising incidence of thyroid cancer using the Surveillance, Epidemiology and End Results national cancer data registry. Surgery 2010; 148:1147-53; PMID:21134545; http://dx.doi.org/ 10.1016/j.surg.2010.10.016 [DOI] [PubMed] [Google Scholar]
- 4.Sipo JA, Mazzaferri EL. Thyroid Cancer Epidemiology and Prognostic Variables. Clinical Oncology 2010; 22:395-404; PMID:0627675; http://dx.doi.org/ 10.1016/j.clon.2010.05.004 [DOI] [PubMed] [Google Scholar]
- 5.Liotta LA. Tumor Invasion and Metastases-Role of the Extracellular Matrix: Rhoads Memorial Award Lecture1. Cancer Research 1986; 46:1-7; PMID:2998604; http://cancerres.aacrjournals.org/content/46/1/1 [PubMed] [Google Scholar]
- 6.Yang LV, Nicholson RH, Kaplan J, Galy A, Li L. Hemogen is a novel nuclear factor specifically expressed in mouse hematopoietic development and its human homologue EDAG maps to chromosome 9q22, a region containing break points of hematological neoplasms. Mechanisms of Development 2001; 104: 105-111; PMID:11404085; http://dx.doi.org/ 10.1016/S0925-4773(01)00376-8 [DOI] [PubMed] [Google Scholar]
- 7.Wurtz T, Kruger A, Christersson C, Lundmark C. A new protein expressed in bone marrow cells and osteoblasts with implication in osteoblast recruitment. Experimental Cell Research 2001; 263:236-242; PMID:11161722; http://dx.doi.org/ 10.1016/excr.2000.5114 [DOI] [PubMed] [Google Scholar]
- 8.lv J, Xu W-X, Wang S-Y, Zhan Y-Q, Jiang Y, Cai W-M, Yang X-M. Isolation and Characterization of EDAG-1, A Novel Gene Related to Regulation in Hematopoietic System. ACTA BIOCHIMICA ET BIOPHYSICASINICA 2001; 33(6):641-646; PMID:12035055; http://www.ncbi.nlm.nih.gov/pubmed/12035055 [PubMed] [Google Scholar]
- 9.Li CY, Zhan YQ, Xu CW, Xu WX, Wang SY, Lv J, Zhou Y, Yue PB, Chen B, Yang XM. EDAG regulates the proliferation and differentiation of hematopoietic cells and resists cell apoptosis through the activation of nuclear factor-kappaB. Cell Death and Differentiation 2004; 11(12):1299-1308; PMID:15332117; http://dx.doi.org/ 10.1038/sj.cdd.4401490 [DOI] [PubMed] [Google Scholar]
- 10.Hus M, Dmoszynska A, Kocki J, Hus I, Jawniak D, Adamczyk-Cioch M, Grzasko N. High expression of EDAG and its significance in AML. Leukemia 2005; 19(8):1499-1502; PMID:15920494; http://dx.doi.org/ 10.1038/sj.leu.2403808 [DOI] [PubMed] [Google Scholar]
- 11.Zhang MJ, Ding YL, Xu CW, Yang Y, Lian WX, Zhan YQ, Li W, Xu WX, Yu M, Ge CH, et al.. Erythroid differentiation-associated gene interacts with NPM1 (nucleophosmin/B23) and increases its proteinstability, resisting cell apoptosis. FEBS 2012; 279: 2848-2862; PMID:22712502; http://dx.doi.org/ 10.1111/j.1742-4658.2012.08663.x [DOI] [PubMed] [Google Scholar]
- 12.Qin FX, Shao HY, Chen XC, Tan S, Zhang HJ, Miao ZY, Wang L, Hui C, Zhang L. Knockdown of NPM1 by RNA interference inhibits cells proliferation and induces apoptosis in leukemic cell line. Int J MedSci 2012; 8:287-294; PMID: 21537492; http://dx.doi.org/ 10.7150/ijms.8.287 [DOI] [PMC free article] [PubMed] [Google Scholar]
- 13.Li C-Y, Zhan Y-Q, Li W, Xu C-W, Xu W-X, Yu D-H, Peng R-Y, Cui Y-F, Yang X, Hou N, et al.. Overexpression of a hematopoietic transcriptional regulator EDAG induces myelopoiesis and suppresses lymphopoiesis in transgenic mice. Leukemia 2007; 21:2277-2286; PMID:17690693; http://dx.doi.org/ 10.1038/sj.leu.2404901 [DOI] [PubMed] [Google Scholar]
- 14.Glassmann A, Winter J, Kraus D, Veit N, Probstmeier R. Pharmacological suppression of the Ras/MAPK pathway in thyroid carcinoma cells can provoke opposite effects on cell migration and proliferation: The appearance of yin-yang effects and the need of combinatorial treatments. Int J Oncol 2014; 45:2587-95; PMID:25269412; http://dx.doi.org/ 10.3892/ijo.2014.2668 [DOI] [PubMed] [Google Scholar]
- 15.Xu X, Qin J, Liu W. Curcumin inhibits the invasion of thyroid cancer cells via down-regulation of PI3K/Akt signaling pathway. Gene 2014; 546:226-32; PMID:24910117; http://dx.doi.org/ 10.1016/j.gene.2014.06.006 [DOI] [PubMed] [Google Scholar]
- 16.Campos M, Kool MM, Daminet S, Ducatelle R, Rutteman G, Kooistra HS, Galac S, Mol JA. Upregulation of the PI3K/Akt Pathway in the Tumorigenesis of Canine Thyroid Carcinoma. J Vet Intern Med 2014; 28:1814-23; PMID:25231196; http://dx.doi.org/ 10.1111/jvim.12435 [DOI] [PMC free article] [PubMed] [Google Scholar]
- 17.Visciano C, Liotti F, Prevete N, Cali' G, Franco R, Collina F, de Paulis A, Marone G, Santoro M, Melillo RM. Mast cells induce epithelial-to-mesenchymal transition and stem cell features in human thyroid cancer cells through an IL-8–Akt–Slug pathway. Oncogene 2015; 7:1-12; PMID:25619830; http://dx.doi.org/ 10.1038/onc.2014.441 [DOI] [PubMed] [Google Scholar]
- 18.Lü J, Xu WX, Wang SY, Jiang Y, Li CY, Cai WM, Yang XM. Overexpression of EDAG-1 in NIH3T3 cells leads to malignant transformation. ACTA BIOCHIM ICA et BIOPHYSICA SINICA 2002; 34(1):95-98; PMID:11958143; http://www.ncbi.nlm.nih.gov/pubmed/11958143 [PubMed] [Google Scholar]
- 19.Ding YL, Xu CW, Wang ZD, Zhan YQ, Li W, Xu WX, Yu M, Ge CH, Li CY, Yang XM. Over-Expression of EDAG in the Myeloid Cell Line 32D: Induction of GATA-1 Expression and Erythroid/Megakaryocytic Phenotype. Journal of Cellular Biochemistry 2010; 110:866-874; PMID:20564185; http://dx.doi.org/ 10.1002/jcb.22597 [DOI] [PubMed] [Google Scholar]
- 20.Ling B, Zhou Y, Feng D, Shen G, Gao T, Shi Y, Wei H, Tian Z. Down-regulation of EDAG expression by retrovirus-mediated small interfering RNA inhibits the growth and IL-8 production of leukemia cells. Oncology Reports 2007; 18:659-664; PMID:17671716; http://dx.doi.org/ 10.3892/or.18.3.659 [DOI] [PubMed] [Google Scholar]
- 21.Li CY, Fang F, Xu WX, Xu CW, Zhan YQ, Wang ZD, Ding YL, Li YH, Sun HB, Yang XM. Suppression of EDAG gene expression by phorbol 12-myristate 13-acetate is mediated through down-regulation of GATA-1. Biochimica et Biophysica Acta 2008; 1779:606-615; PMID:18599389; http://dx.doi.org/ 10.1016/j.bbagrm.2008.06.004 [DOI] [PubMed] [Google Scholar]
- 22.Zheng WW, Dong XM, Yin RH, Xu FF, Ning HM, Zhang MJ, Xu CW, Yang Y, Ding YL, Wang ZD, et al.. EDAG Positively Regulates Erythroid Differentiationand Modifies GATA1 Acetylation Through Recruiting p300. Stem Cells 2014; 32:2278-89; PMID:24740910; http://dx.doi.org/ 10.1002/stem.1723 [DOI] [PubMed] [Google Scholar]
- 23.Ding YL, Xu CW, Wang ZD, Zhan YQ, Li W, Xu WX, Yu M, Ge CH, Li CY, Yang XM. Over-Expression of EDAG in the Myeloid Cell Line 32D: Induction of GATA-1 Expression and Erythroid/Megakaryocytic Phenotype. J Cell Biochem 2010; 110:866-74. PMID:20564185; http://dx.doi.org/ 10.1002/jcb.22597 [DOI] [PubMed] [Google Scholar]
- 24.Petrulea MS, Plantinga TS, Smit JW, Georgescu CE, Netea-Maier RT. PI3K/Akt/mTOR:A promising therapeutic target for non-medullary thyroid carcinoma. Cancer Treat Rev 2015; 41:707-13; PMID:26138515; http://dx.doi.org/ 10.1016/j.ctrv.2015.06.005 [DOI] [PubMed] [Google Scholar]
- 25.Manfredi GI, Dicitore A, Gaudenzi G, Caraglia M, Persani L, Vitale G. PI3K/Akt/mTOR signaling in medullary thyroid cancer: a promising molecular target for cancer therapy. Endocrine 2015; 48:363-70; PMID: 25115638; http://dx.doi.org/ 10.1007/s12020-014-0380-1 [DOI] [PubMed] [Google Scholar]
- 26.Milosevic Z, Pesic M, Stankovic T, Dinic J, Milovanovic Z, Stojsic J, Dzodic R, Tanic N, Bankovic J. Targeting RAS-MAPK-ERK and PI3K-AKT-mTOR signal transduction pathways to chemosensitize an aplastic thyroid carcinoma. Transl Res 2014; 164:411-23; PMID:25016932; http://dx.doi.org/ 10.1016/j.trsl.2014.06.005 [DOI] [PubMed] [Google Scholar]
- 27.Barollo S, Bertazza L, Baldini E, Ulisse S, Cavedon E, Boscaro M, Pezzani R, Mian C. The combination of RAF265, SB590885, ZSTK474 on thyroid cancer cell lines deeply impact on proliferation and MAPK and PI3K/Akt signaling pathways. Invest New Drugs 2014; 32:626-35; PMID:24821574; http://dx.doi.org/ 10.1007/s10637-014-0108-3 [DOI] [PubMed] [Google Scholar]