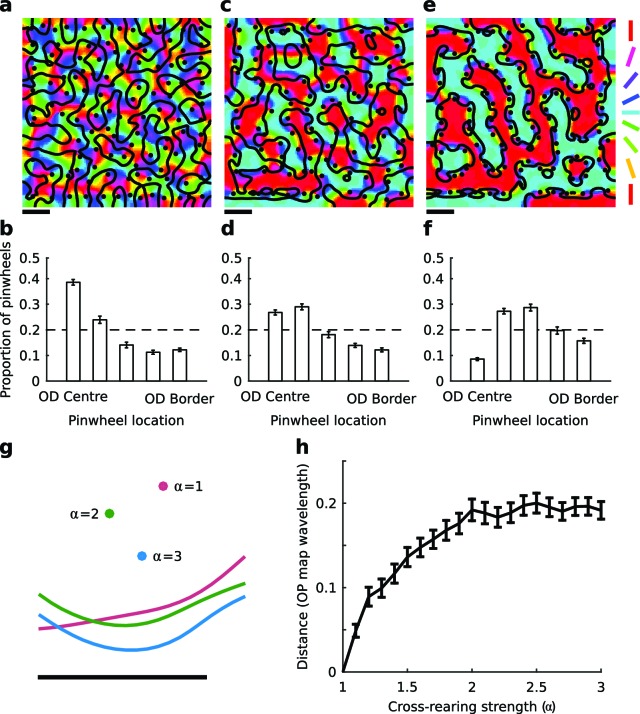
Figure 1. The elastic net model predicts changes in spatial map relationships under cross-rearing.
(a) Simulated orientation preference map (colours), orientation pinwheels (black dots), and ocular dominance borders (black lines) under normal rearing (relative strength of over-representation of horizontal and vertical contours in the input α = 1). (b) Histogram of pinwheel locations relative to the OD borders under normal rearing, showing a preference for pinwheels located near the centre of OD regions as previously observed experimentally. Error bars show ± 1 SEM from 10 independent simulations. The dashed line shows the expected distribution if pinwheels were arranged randomly. (c) Simulated orientation preference map for the cross-reared condition (α = 3). (d) Histogram of pinwheel locations relative to OD borders for this case. (e,f) Simulated orientation preference maps and corresponding histogram of pinwheel locations relative to OD borders for a higher level of cross-rearing (α = 5). In the simulations of cross-rearing, pinwheels are shifted away from the centre and towards the border of OD regions. (g) A cropped region of a simulated OP and OD map produced with the same random seed but increasing strengths of over-representation. Circles show the location of a pinwheel and lines show the location of the adjacent OD border. Both the pinwheel and the OD border move under cross-rearing relative to their positions under normal rearing (α = 1), but the distance between them decreases. (h) The average distance that pinwheels move from their original positions (measured in units of average OP map wavelength) as a function of the strength of cross-rearing. Errors bars show ± 1 SEM across all pinwheels in the map. Scale bars in panels a, c, e and g indicate 15 pixels in the simulated feature maps. Source data for this figure are available in Figure 1—source data 1.
DOI: http://dx.doi.org/10.7554/eLife.13911.003

