

Abstract
Down-regulation of PINK1 and PGC-1α proteins is implicated in both mitochondrial dysfunction and oxidative stress potentially linking metabolic abnormality and neurodegeneration. Here, we report that PGC-1α and PINK1 expression is markedly decreased in Alzheimer disease (AD) and diabetic brains. We observed a significant down-regulation of PGC-1α and PINK1 protein expression in H2O2-treated cells but not in those cells treated with N-acetyl cysteine. The protein levels of two key enzymes of the mitochondrial β-oxidation machinery, acyl-coenzyme A dehydrogenase, very long chain (ACADVL) and mitochondrial trifunctional enzyme subunit α are significantly decreased in AD and diabetic brains. Moreover, we observed a positive relationship between ACADVL and 64 kDa PINK1 protein levels in AD and diabetic brains. Overexpression of PGC-1α decreases lipid-droplet accumulation and increases mitochondrial fatty acid oxidation; down-regulation of PINK1 abolishes these effects. Together, these results provide new insights into potential cooperative roles of PINK1 and PGC-1α in mitochondrial fatty acid oxidation, suggesting possible regulatory roles for mitochondrial function in the pathogenesis of AD and diabetes.
Keywords: PGC-1α, PINK1, Mitochondria, Alzheimer disease, Diabetes
1. Introduction
PTEN-induced putative kinase 1 (PINK1) dysfunction has recently emerged as a key molecule linking neurodegenerative diseases and diabetes. Mutations in PINK1 are observed in early-onset Parkinson disease (PD) (Valente et al., 2004). In AD brains, PINK1 immunoreactivity is observed in senile plaques and vascular amyloid deposition, as well as reactive astrocytes associated with the AD lesions (Wilhelmus et al., 2011). Moreover, down-regulation of PINK1 transcriptional expression is observed in the hippocampus of AD patients (George et al., 2010). In the skeletal muscle of diabetic patients, all transcripts from the PINK1 locus are suppressed, which is associated with the severity of diabetes (Scheele et al., 2007). Genomic variants at the PINK1 locus are associated with plasma nonesterified fatty acid concentration and oxidative energy metabolism in diabetes (Franks et al., 2008). Ample studies using many model systems have shown that PINK1 down-regulation causes mitochondrial dysfunction, increased oxidative stress, and neuronal inactivity (Gautier et al., 2008).
Peroxisome proliferator-activated receptor-gamma co-activator 1α (PGC-1α) is a well-known transcriptional co-activator that powerfully regulates mitochondrial oxidative function and systemic metabolic homeostasis (Gerhart-Hines et al., 2007; Wu et al., 1999). A recent study indicated an important role of PGC-1α in AD (Sheng et al., 2012), Parkinson disease (PD) (Shin et al., 2011), Huntington disease (HD) (Cui et al., 2006; Johri et al., 2011), and amyotrophic lateral sclerosis (ALS) (Liang et al., 2011; Zhao et al., 2011) as well as diabetes (Benton et al., 2010). Single-nucleotide polymorphisms in PPARGC1A, the gene encoding PGC-1α, are associated with the age onset in HD and PD (Clark et al., 2011; Che et al., 2011), and with conversion from impaired glucose tolerance to diabetes (Esterbauer et al., 1999). The PGC-1α null mouse displays severe systemic mitochondrial and metabolic abnormalities, and spongiform neurodegeneration (Lin et al., 2004). Overexpression of PGC-1α markedly increases mitochondrial fatty acid oxidation in cells and animal models of type 2 diabetes (Lehman et al., 2008; Espinoza et al., 2010). Almost all studies with PGC-1α describe activities of full-length PGC-1α. In addition to full-length PGC-1α, recent studies suggest the potential importance of various short isoforms of PGC-1α including 35 kDa PGC-1α in regulating mitochondrial function (Johri et al., 2011; Choi et al., 2013; Soyal et al., 2012; Zhang et al., 2009). Although the origin of various short isoforms of PGC-1α remains unclear, alternate promoter use for the synthesis of PGC-1α has been reported; the start codon of the PGC-1α protein, however, seems to remain the same (Soyal et al., 2012). Our recent study demonstrated that novel PGC-1α (35 kDa) localizes in the mitochondrial inner membrane and the matrix in the brain and associates with PINK1 in the mitochondria (Choi et al., 2013). This finding suggests potential cooperative binding functions of PGC-1α with PINK1 in regulating mitochondrial integrity that go beyond nuclear transcriptional regulation.
Mitochondrial dysfunction and impaired lipid metabolism have been shown to result in a predisposition and/or exacerbation of pathologies associated with diabetes and neurodegenerative diseases (Moreira et al., 2007). Mitochondrial fatty acid oxidation is a key process that maintains cellular lipid homeostasis and provides energy for cell survival. Disruption of this process leads to bioenergetic failure and intracellular lipid accumulation. This ectopic fatty acid accumulation further inhibits mitochondrial function, leading to increased oxidative stress and apoptotic neuronal cell death in diabetes (Schrauwen and Hesselink, 2004), which may increase the risk of developing neurodegenerative diseases. Indeed, altered brain lipid metabolism is known to be correlated with memory loss and hippocampal neurodegeneration (Espinoza et al., 2010). In AD patients, elevated circulating total cholesterol, elevated cholesteryl esters in the brain, and an accumulation of neutral lipids in neurons were reported (Martins et al., 2009; Chan et al., 2012; Gomez-Ramos and Asuncion Moran, 2007). Lipid has been found in the synuclein-containing Lewy bodies purified from human PD (Gai et al., 2000). Lipid loading increases the amount of synuclein bound to membrane/lipid droplets, which results in increased formation of synuclein oligomers and altered triglyceride metabolism (Cole et al., 2002).
To gain insight into the potential role of PINK1 and PGC-1α in the common pathogenesis of diabetes and AD, we measured the changes in their expression levels on well-characterized human brain tissues of AD and diabetic animals. Given the fact that various studies support the notion of a neuroprotective role for PGC-1α against oxidative stress, we measured 35 kDa PGC-1α expression in H2O2-treated “neuronal cells” (SH-SY5Y neuroblastoma cell line), as well as in those cells treated with N-acetyl cysteine. In addition, we investigated the effect of PINK1 down-regulation on the mitochondrial fatty acid oxidation and lipid droplet accumulation in the PGC-1α-overexpressing cells. Here, we show that PGC-1α (as evidenced by p35 (35 kDa)) expression and not full length PGC-1α and PINK1 expression are down-regulated in human AD and diabetic animal brains. Moreover, 35 kDa PGC-1α protein expression is significantly down-regulated in H2O2-treated “neuronal cells” (SH-SY5Y neuroblastoma cell line), but not in those cells treated with N-acetyl cysteine (NAC). PINK1 expression is necessary for increased PGC-1α function in regulating lipid droplet formation and mitochondrial fatty acid oxidation in the settings of fatty acid overload. This result suggests a possible role for PGC-1α and PINK1 in regulating mitochondrial function in the brain, which may be implicated in the pathogenesis of AD and diabetes.
2. Materials and methods
2.1. Animals
All animal procedures were approved by the Institutional Animal Care and Use committee at the University of Maryland School of Medicine (#0812009), IACUC, the VA Maryland R&D Committee, and were in accordance with the NIH Guide for the Care and Use of Laboratory Animals. Mice were housed under approved conditions with a 12-h light/dark cycle with free access to food and water. Hyperglycemia was induced via serial intraperitoneal injections of streptozotocin (STZ) over 6 days and were given sucrose water and small amounts of food throughout the STZ treatment as follows: day 1—remove food, day 2—STZ injection 85 mg/kg, day 3–STZ 70 mg/kg, day 4–STZ 55 mg/kg, day 5—regular water and food, day 6—check glucose and give 55 mg/kg more STZ to mice below 300 mg/dl. Diabetes was verified with a glucose monitor and glucose-oxidase reagent strip. Mice having blood glucose levels of 300 mg/dl (16.7 mM) or greater were considered to be diabetic. Our previous study verified and reported that diabetic peripheral neuropathy occurred in the STZ-induced diabetic mice used in this study (Choi et al., 2014). The results showed: 1) a significant increase in glycosylated hemoglobin, indicating prolonged hyperglycemia, 2) impaired nerve conduction studies consistent with neuropathy, 3) loss of the largest myelinated fibers, indicating changes in nerve morphometry, and 4) oxidative injury and mitochondrial dysfunction in dorsal root ganglion neurons (Choi et al., 2014). We used these five diabetic mice for Western blot analysis in this study.
2.2. Human brain samples and Western blot analysis
Brain tissues were obtained from the NICHD Brain and Tissue Bank for Developmental Disorders at the University of Maryland, Baltimore, MD. For biochemical studies, hippocampus tissues from five AD cases and five non-demented control subjects were used (Table 1). The neuropathological diagnosis of AD was made using the Consortium to Establish a Registry for Alzheimer Disease criteria (Mirra et al., 1991). Brain tissues were homogenized in a buffer containing 50 mM HEPES, 100 mM NaCl, 1% (w/v) NP-40, and a mixture of protease inhibitors (Roche Molecular Biochemicals, Mannheim, Germany) and phosphatase inhibitors (Sigma, St. Louis, MO, U.S.A.). The supernatants were used for Western blot analysis with anti-PGC-1α (Choi et al., 2013), anti-actin (MAB1501R; Millipore, Billerica, MA, U.S.A.), and anti-PINK1 antibodies (LS-B3384; LSBio). Previously our study using Western blot analysis combined with siRNA treatment against PGC-1α showed that rabbit polyclonal PGC-1α (P-120) antibody raised against amino acids 1–120 can detect all potential isoforms of PGC-1α protein (Choi et al., 2013). Horseradish peroxidase-conjugated secondary antibodies were purchased from Pierce Biotechnology. Antibody binding was detected by using the SuperSignal chemiluminescence kit (Pierce Biotechnology, Rockford, IL, U.S.A.) and an Alpha Innotech imaging system.
Table 1.
Demographic data of cases included in this study.
| Lane | Diagnosis | Age (years) | Sex | PMI (h) |
|---|---|---|---|---|
| 1 | AD | 83 | Male | 7 |
| 2 | AD | 59 | Female | 19 |
| 3 | AD | 54 | Male | 18 |
| 4 | AD | 80 | Male | 9 |
| 5 | AD | 66 | Male | 10 |
| 6 | Control | 81 | Male | 17 |
| 7 | Control | 56 | Male | 5 |
| 8 | Control | 62 | Male | 6 |
| 9 | Control | 86 | Male | 23 |
| 10 | Control | 54 | Female | 23 |
PMI, post-mortem interval.
2.3. Isolation of mitochondria from human and mouse brains
Hippocampal tissue of human or mouse brain was prepared as previously described (Choi et al., 2013). Brain tissues were homogenized in isolation medium (225 mmol mannitol, 75 mmol sucrose, 5 mmol HEPES, 1 mmol EGTA, pH 7.4). The homogenate was centrifuged at 1300 ×g for 3 min, and the pellet will be re-suspended and centrifuged again at 1300 ×g for 3 min. The pooled supernatants will be centrifuged at 21,200 ×g for 10 min; the crude mitochondrial pellet was re-suspended in 15% Percoll, and layered on a pre-formed gradient of 40% and 24% Percoll. After centrifugation at 31,700 ×g for 8 min, the mitochondria were collected from the interface of the lower two layers, diluted with isolation medium and centrifuged at 16,700 ×g for 10 min. The Percoll-purified mitochondrial pellet was incubated with protease K (for 25 min at 0 °C) to remove the cytosolic proteins loosely associated to the outer mitochondrial membrane. The purified mitochondrial pellet was lysed in a buffer containing 50 mM HEPES, 100 mM NaCl, 1% NP-40, and a mixture of protease inhibitors (Roche Molecular Biochemicals, Mannheim, Germany) and phosphatase inhibitors (Sigma, St. Louis, MO, U.S.A.). After homogenizing with 20 strokes using a Dounce homogenizer, mitochondrial lysates were centrifuged at 20,000 ×g, and the supernatants were used for Western blot analysis with anti-ACADVL (1:1000; sc-98338; Santa Cruz Biotechnology, Dallas, TX, U.S.A.), anti-HADHA (1:1000; sc-82185; Santa Cruz Biotechnology, Dallas, TX, U.S.A.), or anti-HSP 60 (1:1000; 4870; Cell Signaling, Danvers, MA, U.S.A.) antibodies.
2.4. Cell culture and transfection
Human embryonic kidney cells (HEK 293) were purchased from the ATCC and maintained in Dulbecco’s modified Eagle’s medium (DMEM) supplemented with 10% (w/v) fetal bovine serum and 100 units/ml penicillin/streptomycin. To generate stable PGC-1α-overexpressing cell lines, HEK 293 cells were transfected with the plasmid pCMV6 Myc-PGC-1α (OriGene, Rockville, MD, U.S.A.) or control vector using Lipofectamine 2000 (0.10% (v/v) final, Invitrogen, Grand Island, NY, U.S.A.) and selected with G418 (Invitrogen; 1 mg/ml in DMEM, 10% (w/v) fetal bovine serum) for 24 days. Individual colonies were expanded in 40 μg/ml G418. Expression of PGC-1α was confirmed by Western blot analysis with anti-PGC-1α antibody. Because no difference was found between the control vector and untransfected cells, only the control vector was reported.
2.5. siRNA transfection
For depletion of PINK1 in HEK 293 cells, the following siRNAs were tested: PINK1 siRNA-1 (1199, Ambion, Grand Island, NY, U.S.A.), 5′-GGAGAUCCAGGCAAUUUUUTT-3′ and PINK1 siRNA-2, 5′-GACGCUGU UCCUCGUUAUGAA-3′ (S100287931, Qiagen, Venlo, Netherlands). Scrambled siRNAs with no known mammalian homology (non-targeting siRNA #1 (Ambion) and #2 (Santa Cruz Biotechnology, Dallas, TX, U.S.A.)) were used as negative controls. HEK cells were transfected with the siRNAs using the Mirus TransIT-TKO® reagent (Mirus, Madison, WI, U.S.A.) according to the manufacturer’s manual and then harvested after 48 h. Control vector-transfected cells were used as controls for all the experiments.
2.6. Western blotting
Cells were rinsed in cold PBS and collected in 200 μl RIPA buffer (150 mM NaCl, 1% (v/v) Triton X-100, 0.5% (w/v) sodium deoxycholate, 0.1% (w/v) sodium dodecyl sulfate in 50 mM Tris, pH 8.0) and protease inhibitors (Roche Molecular Biochemicals, Mannheim, Germany) for Western blot analysis as previously described (Choi et al., 2013). Protein content was determined using bovine serum albumin as a standard (Pierce Biotechnology, Rockford, IL, U.S.A.). Proteins were separated by SDS-PAGE electrophoresis (25 μg/lane) and transferred to nitrocellulose membranes (Bio-Rad Laboratories, Hercules, CA, U.S.A.). Primary antibodies used included rabbit PGC-1α (1:5000) (Choi et al., 2013), anti-actin (1:2000; MAB1501R; Millipore, Billerica, MA, U.S.A.), anti-HSP 60 (1:1000, Cell Signaling, 4870), and anti-PINK1 (1:1000; LS-B3384; LSBio, Seattle, WA, U.S.A.). Horseradish peroxidase-conjugated secondary antibodies were purchased from Pierce Biotechnology. Antibody binding was detected by using the SuperSignal chemiluminescence kit (Pierce Biotechnology, Rockford, IL, U.S.A.) and an Alpha Innotech imaging system.
2.7. Preparation of palmitate–BSA or oleic acid–BSA conjugates
Palmitate was conjugated to BSA as described (Crunkhorn et al., 2007). Briefly, sodium palmitate was solubilized in 150 mM sodium chloride by heating up to 65 °C in a water bath. Fat-free bovine serum albumin (FA-BSA) that was obtained from Roche Diagnostics (Indianapolis, IN, U.S.A.) was dissolved in phosphate buffered saline (PBS) and warmed up to 37 °C. Solubilized palmitate was added to BSA at 37 °C with continuous stirring. The conjugated palmitate-BSA was aliquoted and stored at −20 °C. Palmitate–BSA conjugate was used to assess oxidation of exogenous fatty acid. To prepare oleic acid–BSA conjugates, FA-BSA (2.8 g) was dissolved in 20 ml of 100 mM Tris buffer (pH 8.0) and mixed with 78 μl of oleic acid (Calbiochem, Billerica, MA, U.S.A.), followed by incubation in 37 °C water bath.
2.8. Lipid droplet staining and confocal microscopy
HEK 293 cells were incubated with 200 nM oleate–BSA conjugate for 18 h and fixed in 1× phosphate-buffered saline containing 4% (v/v) paraformaldehyde for 30 min. After washing, cells were stained with 1 μM 4,4-difluoro-5-(2-thienyl)-4-bora-3a,4a-diaza-s-indacene-3-dodecanoic acid (BODIPY® 558/568C12) lipid probe (Invitrogen, Grand Island, NY, U.S.A.) for 30 min. Confocal microscopy was performed with a Zeiss confocal microscope.
2.9. Seahorse measurement of cellular respiration
OCR measurement was performed using the Seahorse XF24 Extracellular Flux Analyzer. HEK 293 cells were plated in XF24 cell culture plates (Seahorse Bioscience, North Billerica, MA, U.S.A.) at 5 × 10⁴ cells/well. Cells were equilibrated with the assay medium (120 mM NaCl, 3.5 mM KCl, 1.3 mM CaCl2, 0.4 mM KH2PO4, 1 mM MgCl2, 5 mM HEPES, 0.5 mM carnitine, pH 7.4) without any supplements including glucose and glutamine and incubated in a 37 °C non-CO2 incubator for 45 min immediately before XF assay. Palmitate (20 nM), BSA, carbonyl cyanide 4-(trifluoromethoxy) phenylhydrazone (FCCP) (0.2 μM), or etomoxir (50 μM) compounds were prepared in the identical assay medium as in the corresponding well and were injected from the reagent ports automatically to the wells at the time indicated.
3. Statistics
The results are presented as mean ± SEM. A statistical analysis was performed based on Student’s t-test or one-way ANOVA with the significance level at P ≤ 0.05.
4. Results
4.1. Down-regulation of PGC-1α protein expression in the brains of AD and diabetes, and H2O2-treated neuronal cells
We measured PGC-1α protein level in AD and diabetic brains. Hippocampus tissues obtained from idiopathic AD and age-matched controls (Table 1), and streptozotocin (STZ)-induced diabetic mice and non-diabetic control animal were analyzed by Western blotting using anti-PGC-1α antibody (Fig. 1A and C). The results revealed that there is a significant decrease in 35 kDa PGC-1α protein levels in the hippocampus samples from AD patients compared with control brains (Fig. 1B). Compared with control animals, STZ-induced diabetic mice showed a significant decrease in the level of 35 kDa PGC-1α in the hippocampus (Fig. 1D). In addition, we observed weak PGC-1α-immunoreactive bands at 40, 45, and 55 kDa and the absence of detection of full-length 91 kDa PGC-1α isoform in the hippocampus samples of AD and control brains as well as diabetic and control mouse brains (Fig. 1A and C). The lack of detection of 91 kDa PGC-1α could be due to its lower abundance compared with the 35 kDa PGC-1α in the brain caused by difference in protein turnover or stability, making them undetectable because it might fall below the detection threshold required for anti-PGC-1α immunoblotting. Given the fact that oxidative stress is associated with the pathogenesis of AD and diabetes, we examined the influence of increased oxidative stress on PGC-1α protein expression. Western blot analysis revealed that there is a significant decrease in 35 kDa PGC-1α protein level in the H2O2-treated cells, but not in the H2O2-treated cells with the powerful antioxidant N-acetyl cysteine (NAC) compared with the control (Fig. 1E and F). We observed a slight increase in 91 kDa PGC-1α protein level in the H2O2-treated cells (Fig. 1E).
Fig. 1.
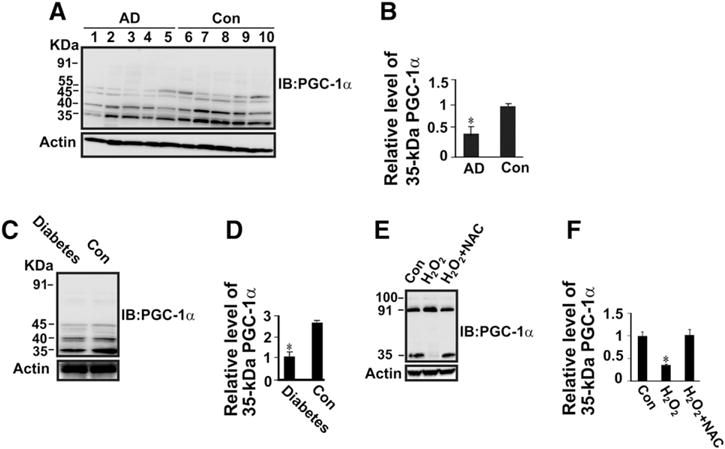
Down-regulation of 35 kDa PGC-1α protein expression in the hippocampus of AD and diabetic animal compared with control brains, and H2O2-treated neuronal cells compared with control cells. Protein extracts (50 μg of protein/lane) from hippocampus of control human and AD brains (A), and diabetic and non-diabetic control mice brains (C) were subjected to SDS-PAGE gel followed by immunoblotting with anti-PGC-1α antibody. (B) Densitometric quantification and normalization to the actin level in the corresponding samples. One result of three independent experiments. The bar graph shows the results (mean ± S.E.) from five AD and five control individuals. *P < 0.05 versus control. (E) SH-SY5Y cells were treated with 100 μM H2O2 without or with 1 mM NAC for 18 h. Total protein lysates were subjected to SDS-PAGE gel followed by immunoblotting with anti-PGC-1α antibody. (D & F) The relative level of 35 kDa PGC-1α protein resolved on SDS-PAGE gel on panels C and E was normalized to the actin level in the corresponding samples. A statistical analysis was performed based on Student’s t-test with the significance level at *P < 0.05. Data are expressed as mean ± SEM. n = 5. *P < 0.05 versus control or H2O2 + NAC.
4.2. Down-regulation of PINK1 protein expression in the brains of AD and diabetes, and H2O2-treated neuronal cells
Our previous study showed that PINK1 protein is associated with PGC-1α in rodent brain (Choi et al., 2013). Moreover, we showed that PGC-1α is down-regulated in the hippocampus of AD patients and experimental diabetes (Fig. 1). These results suggest that PINK1 protein expression might be influenced by PGC-1α down-regulation. Western blot analysis revealed that PINK1 protein expression is substantially down-regulated in the hippocampi of human AD patients and STZ-induced diabetic mice compared with hippocampi in age-matched controls (except for the oldest control patient labeled #9 in Table 1, where PINK1 levels are also reduced) and with hippocampi in non-diabetic control animals, respectively (Fig. 2). Besides the 64 kDa PINK1 protein, we observed weak PINK1-immunoreactive bands at 52 and 32 kDa. However, their relative levels were very low and we could not observe significant differences in human AD and diabetic mouse brains compared with controls. Next, we determined changes in PINK1 protein expression in response to exposure from oxidative stress. Results showed that 64 kDa PINK1 protein level is significantly decreased in the H2O2-treated cells, but it is significantly increased with NAC treatment in those cells (Fig. 2E and F). We observed a slight increase in 32 kDa PINK1 protein level in the H2O2-treated cells regardless of NAC treatment, but their relative levels were very low and were not significantly different (Fig. 2E and F).
Fig. 2.

Down-regulation of PINK1 protein expression in the hippocampus of AD and diabetic animals compared with control brains, and H2O2-treated neuronal cells compared with control cells. Protein extracts (50 μg of protein/lane) from hippocampus of control human and AD brains (A), and diabetic and non-diabetic control mice brains (C) were subjected to SDS-PAGE gel followed by immunoblotting with anti-PINK1 antibody. (B) Densitometric quantification and normalization to the actin level in the corresponding samples. Lanes 1–5 = AD; lanes 6–10 = control brain; lane 8 (the highest PINK1 level) was set at 100%. One result of three independent experiments. (E) SH-SY5Y cells were treated with 100 μM H2O2 without or with 1 mM NAC for 18 h. Total protein lysates were subjected to SDS-PAGE gel followed by immunoblotting with anti-PINK1 antibody. (D & F) The relative level of 64 kDa PINK1 protein resolved on SDS-PAGE gel on panels C and E was normalized to the actin level in the corresponding samples. A statistical analysis was performed based on Student’s t-test with the significance level at *P < 0.05. Data are expressed as mean ± SEM. n = 5. *P < 0.05 versus control or H2O2 + NAC.
4.3. Down-regulation of the protein expression of mitochondrial fatty acid oxidation machinery in the brains of AD and diabetes
Altered brain lipid metabolism is known to be correlated with memory loss and hippocampal neurodegeneration (Liu et al., 2010). Fatty acid taken up from extracellular environment is mainly metabolized by the mitochondrial β-oxidation machinery. Therefore, we determined whether the protein levels of two key enzymes of the mitochondrial β-oxidation machinery, acyl-coenzyme A dehydrogenase, very long chain (ACADVL) and mitochondrial trifunctional enzyme subunit α (HADHA) are altered in the hippocampus of AD patients and diabetic animals. Western blot analysis of purified hippocampal mitochondria revealed that there is a significant decrease in ACADVL and HADHA protein levels in AD patients and experimental diabetes compared with age-matched controls and non-diabetic control animals, respectively (Fig. 3). We assessed the relationship between ACADVL or HADHA protein levels and the 64 kDa PINK1 protein level in AD and control brains. Linear regression analysis revealed that there is a positive relationship between ACADVL and 64 kDa PINK1 protein levels (r = 0.91002, P ≤ 0.05 by Pearson’s r).
Fig. 3.

Down-regulation of the protein expression of mitochondrial fatty acid oxidation machinery in the hippocampus of AD and diabetic animal. Purified mitochondria from hippocampus of control human and AD brains (A), and diabetic and non-diabetic control mice brains (C) were subjected to SDS-PAGE gel followed by immunoblotting with anti-ACADVL and anti-HADHA antibodies. (B) Densitometric quantification and normalization to the HSP 60 level in the corresponding samples. Lanes 1–5 = AD; lanes 6–10 = control brain. One result of three independent experiments. The bar graph shows the results (mean ± S.E.) from five AD and five control individuals. *P < 0.05 versus control. (D) the relative level of ACADVL and HADHA proteins resolved on SDS-PAGE gel on panel C was normalized to the HSP 60 level in the corresponding samples. A statistical analysis was performed based on Student’s t-test with the significance level at *P < 0.05. Data are expressed as mean ± SEM. n = 5. *P < 0.05 versus control.
4.4. PINK1 down-regulation increases lipid droplet content and size in PGC-1α-overexpressing cells
Given the observed positive relationship between PINK1 expression and ACADVL expression, we investigated whether siRNA-mediated knockdown of PINK1 diminishes the PGC-1α-mediated increase in fatty acid oxidation. We observed that H2O2 treatment induces 91 kDa PGC-1α, but not 35 kDa PGC-1α (Fig. 1). In contrast, we showed that both 91- and 35-kDa PGC-1α protein levels are maintained in H2O2 with antioxidant co-treatment (Fig. 1). These results suggest that both 91-and 35-kDa PGC-1α protein isoforms might be important for protecting cells from stress. Therefore, we stably overexpressed PGC-1α in HEK 293 cells to assess the effect of PGC-1α overexpression on lipid droplet accumulation. We confirmed that both 91-kDa PGC-1α expression and 35-kDa PGC-1α expression are markedly up-regulated in PGC-1α-overexpressing cells compared to control cells (Fig. 4F). These cells were then exposed to 200 nM oleic acid for 18 h followed by staining with a BODIPY® 558/568C12 lipid probe and confocal microscopy. As expected, there was little lipid droplet formation in the BSA-treated control cells (data not shown). We observed the various sizes of lipid droplets (≈0.2–0.8 μm) in the control cells transfected with control siRNA (Fig. 4A) or PINK1 siRNA (Fig. 4B), or PGC-1α-overexpressing cells transfected with control siRNA (Fig. 4C). Notably, there was the appearance of different sizes of lipid droplets (≈1.5 to 1.8 μm) with PINK1 siRNA treatment in PGC-1α-overexpressing cells (Fig. 4D). Intracellular lipid droplet content was decreased by ~48% in PGC-1α-overexpressing cells compared to control cells (P < 0.05) (Fig. 4E). PINK1 siRNA increased lipid droplet content by ~50% in PGC-1α-overexpressing cells compared with control siRNA (Fig. 4E). PINK1 siRNA also increased lipid droplet content by ~15% in control cells compared with control siRNA (Fig. 4E). Western blot analysis revealed that there is little PINK1 protein expression in control cells with and without PINK1 siRNA (Fig. 4F). However, there is up-regulation of PINK1 protein expression in PGC-1α-overexpressing cells with control siRNA (Fig. 4F). As expected, PINK1 protein expression was markedly reduced in PGC-1α-overexpressing cells with PINK siRNA (Fig. 4F). Interestingly, PGC-1α expression was markedly reduced in PGC-1α-overexpressing cells (≈2.5-fold) and control cells (≈1.3-fold) with PINK1 siRNA compared with control siRNA (Fig. 4F). Taken together, this study demonstrated that PINK1 down-regulation increases lipid droplet content and alters its size in PGC-1α-overexpressing cells. In contrast, reduced PINK1 expression increases lipid droplet content without altering its size in control cells.
Fig. 4.

PINK1 knockdown abolishes the decreased lipid droplet content in PGC-1α overexpressing cells. HEK 293 cells were transfected with scrambled control siRNA (A) or PINK1 siRNA (B). HEK 293 cells stably overexpressing PGC-1α were transfected with scrambled control siRNA (C) or PINK1 siRNA (D). Cells were exposed to 200 nM oleic acid (A, B, C, & D) for 18 h. And then the lipid droplet formation was visualized by using BODIPY® 558/568C12 lipid probe, followed by confocal microscopy analysis. Scale bar: 10 μm. (F) Total cell lysates were subjected to Western blot analysis with anti-PINK1, anti-PGC-1α, and anti-HSP 60 antibodies. (E) Average number of lipid droplets quantified per cell (*P < 0.05 versus control cells transfected with control siRNA; #P < 0.05 versus control cells transfected with control siRNA; +P < 0.05 versus PGC-1α overexpressing cells transfected with control siRNA; mean ± S.E., n = 250 cells/condition, three independent experiments). A statistical analysis was performed based on one-way ANOVA with the significance level at P < 0.05.
4.5. PINK1 down-regulation decreases mitochondrial fatty acid oxidation capacity in PGC-1α-overexpressing cells
Fatty acid taken up from extracellular environment is mainly metabolized by the mitochondrial β-oxidation machinery. We, therefore, hypothesized that reduced capacity of mitochondrial fatty acid oxidation could increase the observed lipid droplet content and size in PGC-1α-overexpressing cells with PINK1 siRNA. To test this, we determined the cellular oxygen consumption rate (OCR) in the presence of 20 nM palmitate, or BSA as a control. No other exogenously added substrates such as glucose or glutamine were used. Therefore, an increase in cellular OCR truly depends on the oxidative capacity of exogenous fatty acids. The OCR was normalized against the number of viable cells being measured. The OCR was increased by ~25% in the PGC-1α-overexpressing cells compared with control cells (Fig. 5). The observed increase in OCR was blunted by PINK1 siRNA treatment (Fig. 5). The OCR was decreased by ~14% in the control cells transfected with PINK1 siRNA compared with control siRNA (Fig. 5). Transport of fatty acids into mitochondria through a carnitine palmitoyltransferase 1 inhibitor (CPT-1) on the mitochondrial outer membrane is a vital step for fatty acid oxidation. Addition of etomoxir (50 μM), a CPT-1 inhibitor, caused a significant inhibition of OCR in all four cells (Fig. 5). As expected, BSA treatment with or without etomoxir had little effect on the OCR increase in all four cells (Fig. 5). We also observed that the complex III inhibitor antimycin A completely blunted the OCR increase (data not shown). All this result confirmed that mitochondria indeed respired on exogenous fatty acids, which is responsible for the observed increased OCR upon addition of palmitate in all four cells. Taken together, these studies demonstrated that PINK1 down-regulation decreases mitochondrial fatty acid oxidation capacity in PGC-1α-overexpressing cells.
Fig. 5.

PINK1 knockdown abolishes the increased oxygen consumption rate (OCR) in PGC-1α overexpressing cells. Control HEK 293 cells and HEK 293 cells stably overexpressing PGC-1α were transfected with scrambled control siRNA or PINK1 siRNA. The growth medium was replaced with assay medium containing no glucose or glutamine, followed by measuring oxygen consumption rate (OCR) using the XF24 Extracellular Flux Analyzer. Palmitate (20 nM), BSA, or etomoxir (50 μM) was added to the cells from the reagent ports. The OCRs were normalized against the number of viable cells being measured: *P < 0.05 versus control cells transfected with control siRNA; #P < 0.05 versus control cells transfected with control siRNA; +P < 0.05 versus PGC-1α overexpressing cells transfected with control siRNA mean ± S.D. (n = 3). *P < 0.05; #P < 0.05; +P < 0.05; *P < 0.05 (versus palmitate + etomoxir, BSA alone, or BSA + etomoxir). A statistical analysis was performed based on one-way ANOVA with the significance level at P < 0.05.
5. Discussion
The present study demonstrates that the levels of PGC-1α (p35) and PINK1 proteins are decreased in the hippocampus of post-mortem brains of AD and experimental diabetic animals. In addition, PGC-1α (p35) and PINK1 are down-regulated in the neuronal cells in response to increased oxidative stress. The protein levels of two key enzymes of the mitochondrial β-oxidation machinery, ACADVL and HADHA are significantly decreased in AD and diabetic hippocampi. Importantly, ACADVL expression is positively correlated with 64 kDa PINK1 protein levels in AD and diabetic brains. Moreover, down-regulation of PINK1 compromises increased mitochondrial fatty acid oxidation and decreased lipid droplet accumulation in PGC-1α-overexpressing cells. Mitochondrial dysfunction, oxidative stress, and altered lipid metabolism have been well documented in AD and diabetes (Moreira et al., 2007; Schrauwen and Hesselink, 2004; Liu et al., 2010; Martins et al., 2009; Chan et al., 2012). Therefore, these findings support a reciprocal relationship between PINK1, PGC-1α, ACADVL, and HADHA expression and AD as well as positing a potential relationship between the pathogenesis of diabetes and AD.
We showed that there is a decrease in lipid droplet content and an increase in mitochondrial OCR in PGC-1α-overexpressing cells compared with control cells in the settings of fatty acid excess. Altered fatty acid oxidation and synthesis could contribute to changes in the cellular content of lipid droplets in PGC-1α-overexpressing cells. A previous study showed that PGC-1α increases lipid synthesis from glucose in the serum-replete state, while PGC-1α promotes lipid oxidation in the serum-starved state (Espinoza et al., 2010). Since the medium used for lipid droplet measurement in this study contains very low serum, glucose, and glutamine contents, the influence of increased fatty acid synthesis on lipid droplet accumulation in PGC-1α-overexpressing cells could be negligible. We observed that application of etomoxir, an inhibitor of fatty acid uptake, significantly inhibits OCR in PGC-1α-expressing cells transfected with either PINK1 siRNA or empty vector. Taken together, these results suggest that altered mitochondrial fatty acid oxidation is mainly responsible for changes in both OCR and lipid droplet content in these cells.
Interestingly, we observed that the level of ACADVL protein that catalyzes the first step of the mitochondrial β-oxidation pathway is positively correlated with 64 kDa PINK1 protein expression in AD and diabetic brains. This suggests that PINK1 down-regulation could be important for the decreased mitochondrial fatty acid oxidation capacity in these diseases. In supporting this possibility, we showed that PINK1 down-regulation causes decreased OCR and increased lipid droplet contents in PGC-1α-overexpressing cells. This also suggests that the maintenance of PINK1 protein expression is important for the increased PGC-1α function. We observed an increase in both 35 kDa PGC-1α protein expression and 91 kDa PGC-1α protein expression in the PGC-1α-overexpressing cells; these are down-regulated by PINK1 siRNA treatment in these cells. Moreover, we showed that PINK1 protein expression is up-regulated in the PGC-1α-overexpressing cells. This suggests that both PGC-1α protein expression and PINK1 protein expression are influenced by each other in either transcriptional and/or translational levels. Our previous study showed that mitochondrial 35 kDa PGC-1α is associated with PINK1 within mitochondria (Choi et al., 2013). Moreover, we showed that the 35 kDa isoform is the only PGC-1α found in the mitochondrial fraction and full-length 91 kDa PGC-1α is present in the remaining cytosolic fractions devoid of mitochondria (Choi et al., 2013). 91 kDa PGC-1α has long been known as a nuclear transcriptional co-activator (Lehman et al., 2008). These observations suggest that nuclear 91 kDa PGC-1α-mediated transcriptional controls may potentially activate PINK1 promoter, leading to increased PINK1 expression in PGC-1α-overexpressing cells. PINK1 is a putative mitochondrial kinase and knockdown of PINK1 results in mitochondrial dysfunctions (Gautier et al., 2008). PINK1-dependent phosphorylation has been proposed to be a protective mechanism against mitochondrial stress. Therefore, it is possible that PINK1 protein down-regulation by PINK1 siRNA treatment may potentially cause dephosphorylation of PGC-1α protein, which may decrease its stability and/or function and thus be incompetent in fatty acid oxidation. Given the fact that PGC-1α and PINK1 are well known as major mitochondrial regulators, it is possible that their down-regulation may potentially cause defects in the activities of the electron transport chain, β-oxidation machinery, tricarboxylate (TCA) cycle, and/or impaired mitochondrial biogenesis, which may potentially be responsible for alteration in fatty acid oxidation and accumulation. This aspect will have to be elucidated by future studies.
Interestingly, we observed that the 35 kDa PGC-1α protein is predominant in the rodent and human hippocampus tissues, but 91 PGC-1α is less commonly detected. We also detected a very faint band of 40–55 kDa in hippocampal tissues. In contrast, we detected both 35- and 91-kDa PGC-1α proteins in SH-SY5Y cells. The molecular basis for these various isoforms with different molecular masses and their differential abundance in tissues is unclear but could be due to tissue-specific post-transcriptional or post-translational modifications that may alter antibody recognition of epitopes in affected amino acid sequences, or may be due to the relatively short half-life or low expression level of full-length PGC-1α protein in brains. In accordance with our results, previous studies showed that several PGC-1α isoforms with various molecular masses ranging from ≈30 to ≈90 kDa are found in the brain, neuronal cells (SH-SY5Y), and other tissues (Johri et al., 2011; Choi et al., 2013; Soyal et al., 2012; Zhang et al., 2009). Moreover, recent report shows that several smaller PGC-1α transcripts are present in the brain and neuron and they are more abundant than 91 kDa PGC-1α in those tissues (Soyal et al., 2012). We observed a slight increase in 91 kDa PGC-1α protein level and a significant decrease in 35 kDa PGC-1α protein level in the H2O2-treated cells. These results suggest that 91 kDa PGC-1α could be up-regulated after oxidative stress, but 35 kDa PGC-1α may not be cleaved from 91 kDa PGC-1α during stress. Alternatively, alternative splicing and/or transcription initiation may increase 91 kDa PGC-1α and decrease 35 kDa PGC-1α protein level in response to oxidative stress. Further studies are needed to clarify the exact mechanism. We also observed that co-treatment of antioxidant with H2O2 resulted in a significant increase in 35 kDa PGC-1α protein level and a slight decrease in 91 kDa PGC-1α protein level compared to H2O2-treated cells. These results suggest that maintenance of protein levels of both 91- and 35-kDa PGC-1α might be important for protecting cells from stress. In human and diabetic animal hippocampus, and in cells, we observed several PINK1 protein isoforms of approximately 64, 52 and 32 kDa. Consistent with this, PINK1 is known to exist as multiple isoforms; a full-length protein, of approximately 63 to 64 kDa; an N-terminally truncated isoform of approximately 52 kDa; and an additional processed isoform of approximately 45 kDa (Silvestri et al., 2005; Beilina et al., 2005; Lin and Kang, 2008). However, the factors regulating PINK1 processing and their distribution as well as the functional importance of the different isoforms require further clarification.
We demonstrate down-regulation of PGC-1α, PINK1, ACADVL, and HADHA protein expression in the brains of AD patients and diabetic animal. Moreover, we show that PINK1 down-regulation blunts increased mitochondrial fatty acid oxidation and decreased lipid droplet content in PGC-1α-overexpressing cells. It should be clarified that our data do not lead to a conclusion regarding whether decreased 35 kDa PGC-1α alone is responsible for reduced fatty acid oxidation in the condition of PINK1 down-regulation. Rather, we proposed that PINK1 down-regulation diminishes the PGC-1α-mediated mitochondrial fatty acid oxidation, which may be implicated in the pathogenesis of AD and diabetes. Also, further work is required to show the molecular target of PINK1 and 35 kDa PGC-1α action within mitochondria. Given the potential importance of mitochondrial dysfunction and altered lipid homeostasis in the pathogenesis of neurodegenerative diseases and diabetes, this will promote our understanding of pathological processes linking these disorders.
Acknowledgments
The authors gratefully acknowledge Drs. Ru-ching Hasud, Carole Sztalryd Woodle, John C McLenithan, Brian M Polster and Tibor Kristian for their excellent help with immunoelectron microscopy, lipid droplet staining, mitochondrial isolation, and respiration measurement. Human tissue was obtained from the NICHD Brain and Tissue Bank for Developmental Disorders at the University of Maryland, Baltimore, MD. We thank Dr. Daniel Kelly and Ms. Theresa Leone for providing the PGC-1α antibody.
This work was supported in part by the Office of Research Development (Biomemedical and Laboratory Research Service and Rehabilitation Research and Development, 101RX001030), Department of Veterans Affairs, NIH RR024888, Juvenile Diabetes Research Foundation (JDRF), American Diabetes Association (ADA), Veterans Administration Research and Development REAP award (JC, JWR), VA Baltimore Research and Education Foundation (JC), Mid-Atlantic Nutrition Obesity Research Center (NIH P30 DK072488).
Abbreviations
- PGC-1α
peroxisome proliferator-activated receptor-gamma co-activator 1α
- PINK1
PTEN-induced putative kinase 1
- AD
Alzheimer disease
- PD
Parkinson disease
- HD
Huntington disease
- ALS
amyotrophic lateral sclerosis
- STZ
streptozotocin
- HEK
human embryonic kidney cells
- PMSF
phenylmethylsulfonyl fluoride
- DMEM
Dulbecco’s modified Eagle’s medium
- PBS
phosphate buffered saline
- FA-BSA
fat-free bovine serum albumin
- BODIPY® 558/568C12
4,4-difluoro-5-(2-thienyl)-4-bora-3a,4a-diaza-s-indacene-3-dodecanoic acid
- OCR
oxygen consumption rate
- CPT-1
carnitine palmitoyltransferase 1 inhibitor
- TCA
tricarboxylate cycle
- ACADVL
acyl-coenzyme A dehydrogenase, very long chain
- HADHA
mitochondrial trifunctional enzyme subunit α
References
- Beilina A, Van Der Brug M, Ahmad R, Kesavapany S, Miller DW, Petsko GA, Cookson MR. Mutations in PTEN-induced putative kinase 1 associated with recessive parkinsonism have differential effects on protein stability. Proc Natl Acad Sci U S A. 2005;102:5703–5708. doi: 10.1073/pnas.0500617102. [DOI] [PMC free article] [PubMed] [Google Scholar]
- Benton CR, Holloway GP, Han XX, Yoshida Y, Snook LA, Lally J, Glatz JF, Luiken JJ, Chabowski A, Bonen A. Increased levels of peroxisome proliferator-activated receptor gamma, coactivator 1 alpha (PGC-1alpha) improve lipid utilisation, insulin signalling and glucose transport in skeletal muscle of lean and insulin-resistant obese Zucker rats. Diabetologia. 2010;53:2008–2019. doi: 10.1007/s00125-010-1773-1. [DOI] [PubMed] [Google Scholar]
- Chan RB, Oliveira TG, Cortes EP, Honig LS, Duff KE, Small SA, Wenk MR, Shui G, Di Paolo G. Comparative lipidomic analysis of mouse and human brain with Alzheimer disease. J Biol Chem. 2012;287:2678–2688. doi: 10.1074/jbc.M111.274142. [DOI] [PMC free article] [PubMed] [Google Scholar]
- Che HV, Metzger S, Portal E, Deyle C, Riess O, Nguyen HP. Localization of sequence variations in PGC-1alpha influence their modifying effect in Huntington disease. Mol Neurodegener. 2011;6:1. doi: 10.1186/1750-1326-6-1. [DOI] [PMC free article] [PubMed] [Google Scholar]
- Choi J, Batchu VV, Schubert M, Castellani RJ, Russell JW. A novel PGC-1alpha isoform in brain localizes to mitochondria and associates with PINK1 and VDAC. Biochem Biophys Res Commun. 2013;435:671–677. doi: 10.1016/j.bbrc.2013.05.041. [DOI] [PMC free article] [PubMed] [Google Scholar]
- Choi J, Chandrasekaran K, Inoue T, Muragundla A, Russell JW. PGC-1α regulation of mitochondrial degeneration in experimental diabetic neuropathy. Neurobiol Dis. 2014;64C:118–130. doi: 10.1016/j.nbd.2014.01.001. [DOI] [PMC free article] [PubMed] [Google Scholar]
- Clark J, Reddy S, Zheng K, Betensky RA, Simon DK. Association of PGC-1alpha polymorphisms with age of onset and risk of Parkinson’s disease. BMC Med Genet. 2011;12:69. doi: 10.1186/1471-2350-12-69. [DOI] [PMC free article] [PubMed] [Google Scholar]
- Cole NB, Murphy DD, Grider T, Rueter S, Brasaemle D, Nussbaum RL. Lipid droplet binding and oligomerization properties of the Parkinson’s disease protein alpha-synuclein. J Biol Chem. 2002;277:6344–6352. doi: 10.1074/jbc.M108414200. [DOI] [PubMed] [Google Scholar]
- Crunkhorn S, Dearie F, Mantzoros C, Gami H, da Silva WS, Espinoza D, Faucette R, Barry K, Bianco AC, Patti ME. Peroxisome proliferator activator receptor gamma coactivator-1 expression is reduced in obesity: potential pathogenic role of saturated fatty acids and p38 mitogen-activated protein kinase activation. J Biol Chem. 2007;282:15439–15450. doi: 10.1074/jbc.M611214200. [DOI] [PubMed] [Google Scholar]
- Cui L, Jeong H, Borovecki F, Parkhurst CN, Tanese N, Krainc D. Transcriptional repression of PGC-1alpha by mutant huntingtin leads to mitochondrial dysfunction and neurodegeneration. Cell. 2006;127:59–69. doi: 10.1016/j.cell.2006.09.015. [DOI] [PubMed] [Google Scholar]
- Espinoza DO, Boros LG, Crunkhorn S, Gami H, Patti ME. Dual modulation of both lipid oxidation and synthesis by peroxisome proliferator-activated receptor-gamma coactivator-1alpha and −1beta in cultured myotubes. FASEB J. 2010;24:1003–1014. doi: 10.1096/fj.09-133728. [DOI] [PMC free article] [PubMed] [Google Scholar]
- Esterbauer H, Oberkofler H, Krempler F, Patsch W. Human peroxisome proliferator activated receptor gamma coactivator 1 (PPARGC1) gene: cDNA sequence, genomic organization, chromosomal localization, and tissue expression. Genomics. 1999;62:98–102. doi: 10.1006/geno.1999.5977. [DOI] [PubMed] [Google Scholar]
- Franks PW, Scheele C, Loos RJ, Nielsen AR, Finucane FM, Wahlestedt C, Pedersen BK, Wareham NJ, Timmons JA. Genomic variants at the PINK1 locus are associated with transcript abundance and plasma nonesterified fatty acid concentrations in European whites. FASEB J. 2008;22:3135–3145. doi: 10.1096/fj.08-107086. [DOI] [PubMed] [Google Scholar]
- Gai WP, Yuan HX, Li XQ, Power JT, Blumbergs PC, Jensen PH. In situ and in vitro study of colocalization and segregation of alpha-synuclein, ubiquitin, and lipids in Lewy bodies. Exp Neurol. 2000;166:324–333. doi: 10.1006/exnr.2000.7527. [DOI] [PubMed] [Google Scholar]
- Gautier CA, Kitada T, Shen J. Loss of PINK1 causes mitochondrial functional defects and increased sensitivity to oxidative stress. Proc Natl Acad Sci U S A. 2008;105:11364–11369. doi: 10.1073/pnas.0802076105. [DOI] [PMC free article] [PubMed] [Google Scholar]
- George AJ, Gordon L, Beissbarth T, Koukoulas I, Holsinger RM, Perreau V, Cappai R, Tan SS, Masters CL, Scott HS, Li QX. A serial analysis of gene expression profile of the Alzheimer’s disease Tg2576 mouse model. Neurotox Res. 2010;17:360–379. doi: 10.1007/s12640-009-9112-3. [DOI] [PubMed] [Google Scholar]
- Gerhart-Hines Z, Rodgers JT, Bare O, Lerin C, Kim SH, Mostoslavsky R, Alt FW, Wu Z, Puigserver P. Metabolic control of muscle mitochondrial function and fatty acid oxidation through SIRT1/PGC-1alpha. EMBO J. 2007;26:1913–1923. doi: 10.1038/sj.emboj.7601633. [DOI] [PMC free article] [PubMed] [Google Scholar]
- Gomez-Ramos P, Asuncion Moran M. Ultrastructural localization of intraneuronal Abeta-peptide in Alzheimer disease brains. JAD. 2007;11:53–59. doi: 10.3233/jad-2007-11109. [DOI] [PubMed] [Google Scholar]
- Johri A, Starkov AA, Chandra A, Hennessey T, Sharma A, Orobello S, Squitieri F, Yang L, Beal MF. Truncated peroxisome proliferator-activated receptor-gamma coactivator 1alpha splice variant is severely altered in Huntington’s disease. Neurodegener Dis. 2011;8:496–503. doi: 10.1159/000327910. [DOI] [PMC free article] [PubMed] [Google Scholar]
- Lehman JJ, Boudina S, Banke NH, Sambandam N, Han X, Young DM, Leone TC, Gross RW, Lewandowski ED, Abel ED, Kelly DP. The transcriptional coactivator PGC-1alpha is essential for maximal and efficient cardiac mitochondrial fatty acid oxidation and lipid homeostasis. Am J Physiol Heart Circ Physiol. 2008;295:H185–H196. doi: 10.1152/ajpheart.00081.2008. [DOI] [PMC free article] [PubMed] [Google Scholar]
- Liang H, Ward WF, Jang YC, Bhattacharya A, Bokov AF, Li Y, Jernigan A, Richardson A, Van Remmen H. PGC-1alpha protects neurons and alters disease progression in an amyotrophic lateral sclerosis mouse model. Muscle Nerve. 2011;44:947–956. doi: 10.1002/mus.22217. [DOI] [PubMed] [Google Scholar]
- Lin W, Kang UJ. Characterization of PINK1 processing, stability, and subcellular localization. J Neurochem. 2008;106:464–474. doi: 10.1111/j.1471-4159.2008.05398.x. [DOI] [PMC free article] [PubMed] [Google Scholar]
- Lin J, Wu PH, Tarr PT, Lindenberg KS, St-Pierre J, Zhang CY, Mootha VK, Jager S, Vianna CR, Reznick RM, Cui L, Manieri M, Donovan MX, Wu Z, Cooper MP, Fan MC, Rohas LM, Zavacki AM, Cinti S, Shulman GI, Lowell BB, Krainc D, Spiegelman BM. Defects in adaptive energy metabolism with CNS-linked hyperactivity in PGC-1alpha null mice. Cell. 2004;119:121–135. doi: 10.1016/j.cell.2004.09.013. [DOI] [PubMed] [Google Scholar]
- Liu Q, Trotter J, Zhang J, Peters MM, Cheng H, Bao J, Han X, Weeber EJ, Bu G. Neuronal LRP1 knockout in adult mice leads to impaired brain lipid metabolism and progressive, age-dependent synapse loss and neurodegeneration. J Neurosci. 2010;30:17068–17078. doi: 10.1523/JNEUROSCI.4067-10.2010. [DOI] [PMC free article] [PubMed] [Google Scholar]
- Martins IJ, Berger T, Sharman MJ, Verdile G, Fuller SJ, Martins RN. Cholesterol metabolism and transport in the pathogenesis of Alzheimer’s disease. J Neurochem. 2009;111:1275–1308. doi: 10.1111/j.1471-4159.2009.06408.x. [DOI] [PubMed] [Google Scholar]
- Mirra S, Heyman A, McKeel D, Sumi SM, Crain BJ, Brownlee LM, Vogel FS, Hughes JP, van Belle G, Berg L. The consortium to establish a registry for Alzheimer’s disease (CERAD), part II. Standardization of the neuropathologic assessment of Alzheimer’s disease. Neurology. 1991;4:479–486. doi: 10.1212/wnl.41.4.479. [DOI] [PubMed] [Google Scholar]
- Moreira PI, Santos MS, Seica R, Oliveira CR. Brain mitochondrial dysfunction as a link between Alzheimer’s disease and diabetes. J Neurol Sci. 2007;257:206–214. doi: 10.1016/j.jns.2007.01.017. [DOI] [PubMed] [Google Scholar]
- Scheele C, Nielsen AR, Walden TB, Sewell DA, Fischer CP, Brogan RJ, Petrovic N, Larsson O, Tesch PA, Wennmalm K, Hutchinson DS, Cannon B, Wahlestedt C, Pedersen BK, Timmons JA. Altered regulation of the PINK1 locus: a link between type 2 diabetes and neurodegeneration? FASEB J. 2007;21:3653–3665. doi: 10.1096/fj.07-8520com. [DOI] [PubMed] [Google Scholar]
- Schrauwen P, Hesselink MK. Oxidative capacity, lipotoxicity, and mitochondrial damage in type 2 diabetes. Diabetes. 2004;53:1412–1417. doi: 10.2337/diabetes.53.6.1412. [DOI] [PubMed] [Google Scholar]
- Sheng B, Wang X, Su B, Lee HG, Casadesus G, Perry G, Zhu X. Impaired mitochondrial biogenesis contributes to mitochondrial dysfunction in Alzheimer’s disease. J Neurochem. 2012;120:419–429. doi: 10.1111/j.1471-4159.2011.07581.x. [DOI] [PMC free article] [PubMed] [Google Scholar]
- Shin JH, Ko HS, Kang H, Lee Y, Lee YI, Pletinkova O, Troconso JC, Dawson VL, Dawson TM. PARIS (ZNF746) repression of PGC-1alpha contributes to neurodegeneration in Parkinson’s disease. Cell. 2011;144:689–702. doi: 10.1016/j.cell.2011.02.010. [DOI] [PMC free article] [PubMed] [Google Scholar]
- Silvestri L, Fau-Caputo V, Caputo V, Fau-Bellacchio E, Bellacchio E, Fau-Atorino L, Atorino L, Fau-Dallapiccola B, Dallapiccola B, Fau-Valente EM, Valente Em, Fau-Casari G, Casari G. Mitochondrial import and enzymatic activity of PINK1 mutants associated to recessive parkinsonism. Hum Mol Genet. 2005;14:3477–3492. doi: 10.1093/hmg/ddi377. [DOI] [PubMed] [Google Scholar]
- Soyal SM, Felder TK, Auer S, Hahne P, Oberkofler H, Witting A, Paulmichl M, Landwehrmeyer GB, Weydt P, Patsch W. A greatly extended PPARGC1A genomic locus encodes several new brain-specific isoforms and influences Huntington disease age of onset. Hum Mol Genet. 2012;21:3461–3473. doi: 10.1093/hmg/dds177. [DOI] [PubMed] [Google Scholar]
- Valente EM, Abou-Sleiman PM, Caputo V, Muqit MM, Harvey K, Gispert S, Ali Z, Del Turco D, Bentivoglio AR, Healy DG, Albanese A, Nussbaum R, Gonzalez-Maldonado R, Deller T, Salvi S, Cortelli P, Gilks WP, Latchman DS, Harvey RJ, Dallapiccola B, Auburger G, Wood NW. Hereditary early-onset Parkinson’s disease caused by mutations in PINK1. Science. 2004;304:1158–1160. doi: 10.1126/science.1096284. [DOI] [PubMed] [Google Scholar]
- Wilhelmus MM, van der Pol SM, Jansen Q, Witte ME, van der Valk P, Rozemuller AJ, Drukarch B, de Vries HE, Van Horssen J. Association of Parkinson disease-related protein PINK1 with Alzheimer disease and multiple sclerosis brain lesions. Free Radic Biol Med. 2011;50:469–476. doi: 10.1016/j.freeradbiomed.2010.11.033. [DOI] [PubMed] [Google Scholar]
- Wu Z, Puigserver P, Andersson U, Zhang C, Adelmant G, Mootha V, Troy A, Cinti S, Lowell B, Scarpulla RC, Spiegelman BM. Mechanisms controlling mitochondrial biogenesis and respiration through the thermogenic coactivator PGC-1. Cell. 1999;98:115–124. doi: 10.1016/S0092-8674(00)80611-X. [DOI] [PubMed] [Google Scholar]
- Zhang Y, Huypens P, Adamson AW, Chang JS, Henagan TM, Boudreau A, Lenard NR, Burk D, Klein J, Perwitz N, Shin J, Fasshauer M, Kralli A, Gettys TW. Alternative mRNA splicing produces a novel biologically active short isoform of PGC-1alpha. J Biol Chem. 2009;284:32813–32826. doi: 10.1074/jbc.M109.037556. [DOI] [PMC free article] [PubMed] [Google Scholar]
- Zhao W, Varghese M, Yemul S, Pan Y, Cheng A, Marano P, Hassan S, Vempati P, Chen F, Qian X, Pasinetti GM. Peroxisome proliferator activator receptor gamma coactivator-1alpha (PGC-1alpha) improves motor performance and survival in a mouse model of amyotrophic lateral sclerosis. Mol Neurodegener. 2011;6:51. doi: 10.1186/1750-1326-6-51. [DOI] [PMC free article] [PubMed] [Google Scholar]